Why is XRP’s Price Down Today? A Comprehensive Analysis
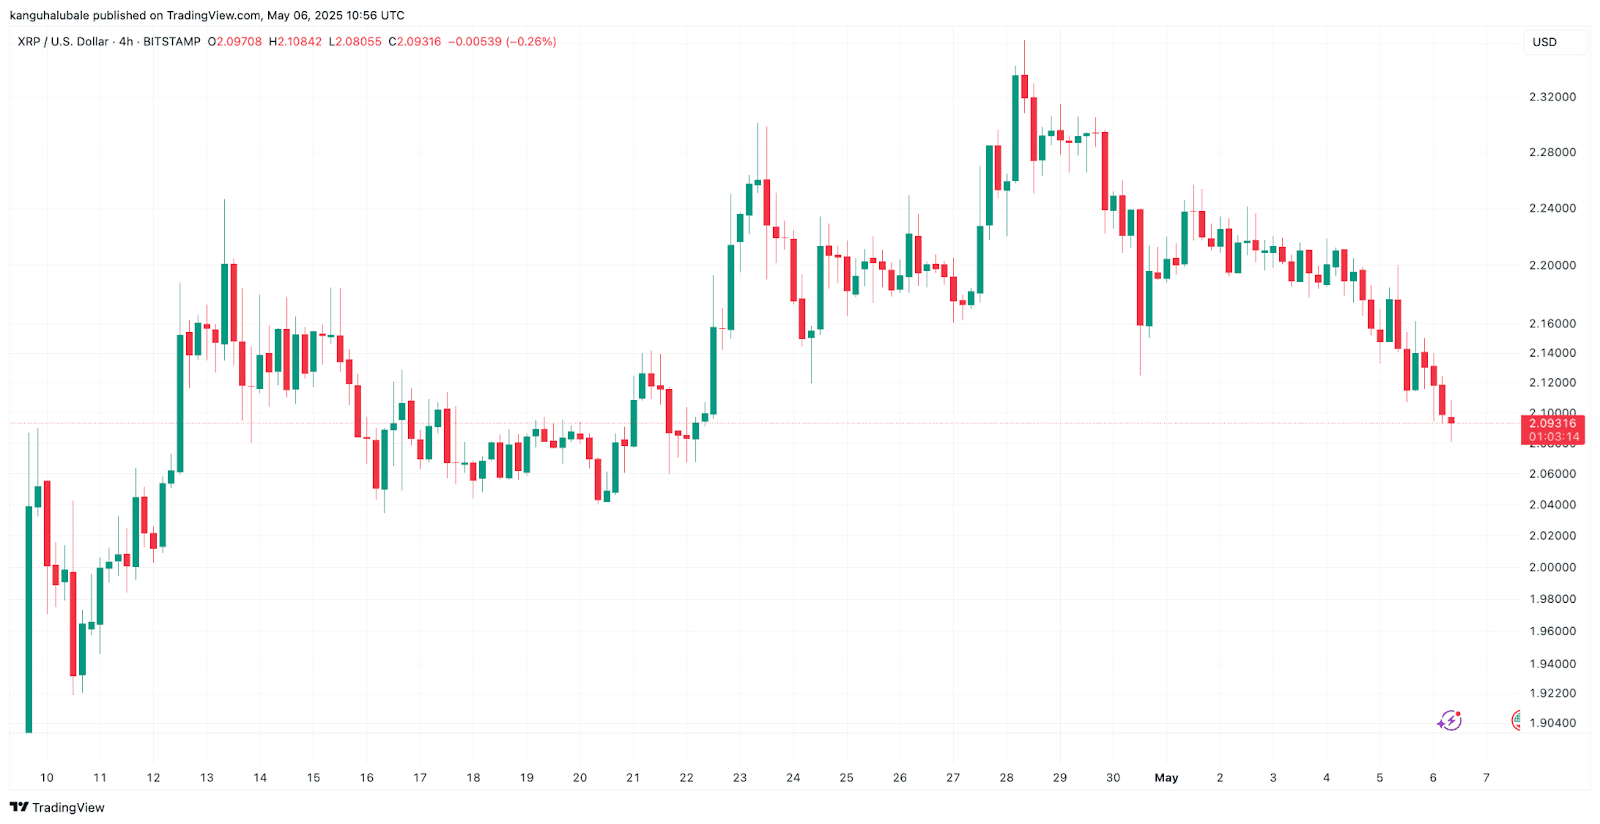
XRP (Ripple) experienced a price decrease on May 6th, falling 3% to $2.09. This decline is influenced by a combination of factors, which we will explore in detail.
Key Factors Influencing XRP’s Price Drop:
- Ripple’s Shift in Reporting Strategy: Ripple has discontinued its quarterly XRP markets report, raising concerns about transparency.
- Decreased Open Interest: A 10% drop in open interest for XRP futures suggests weakening trader confidence.
- Technical Analysis: XRP’s technical setup shows a descending triangle pattern, indicating potential further downside.
Ripple’s Discontinuation of Quarterly Reports: Transparency Concerns?
Ripple’s decision to cease publishing its quarterly XRP markets reports, a practice since 2017, has sparked debate. While Ripple cites the reports’ limitations and a focus on institutional adoption as reasons, some investors worry about reduced transparency into XRP’s market dynamics.
These reports previously provided insights into XRP sales, escrow activities, and adoption trends. The move has led to questions about whether Ripple is prioritizing institutional investors over retail transparency.
Some analysts view this as a strategic move towards greater decentralization and a focus on the broader XRP ecosystem, potentially allowing organizations like the XRPL Foundation to take a leading role in community growth and development.
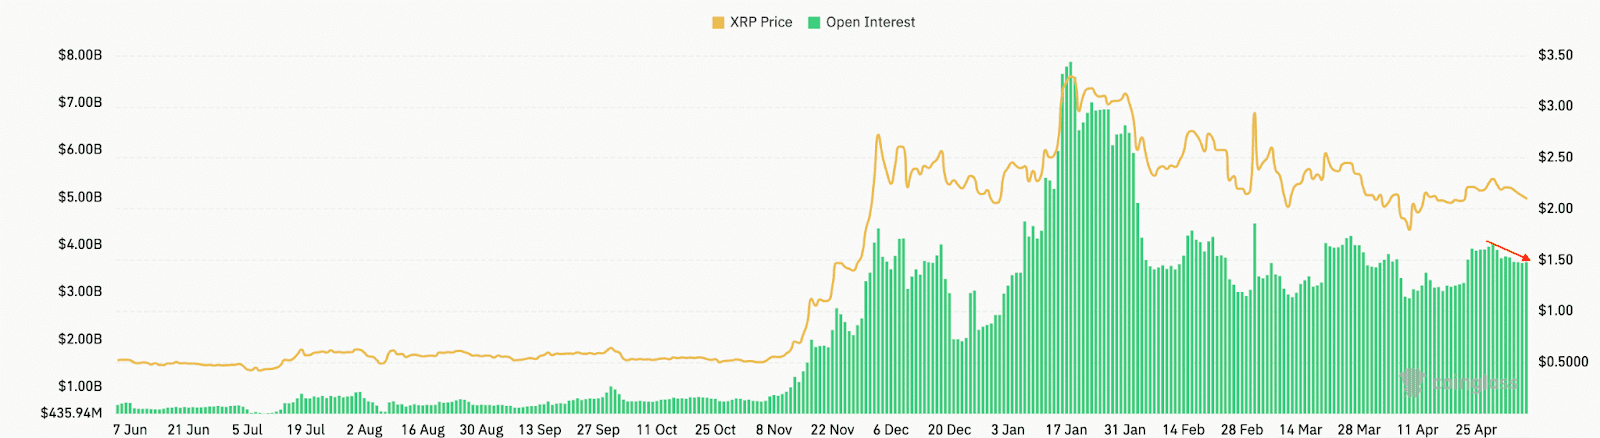
Declining Open Interest Signals Weak Sentiment
Open interest (OI) in XRP futures has decreased by 10% in the last week, reaching $3.6 billion. This decrease signals a reduction in trader confidence and market liquidity. A lower OI typically precedes or accompanies price declines, as fewer traders are actively participating in the market.
The recent price drop also resulted in liquidations of long positions worth $7.98 million, significantly higher than the $660,000 in short liquidations. This indicates increased selling pressure, as traders holding bullish positions were forced to sell at a loss, further driving down the price.
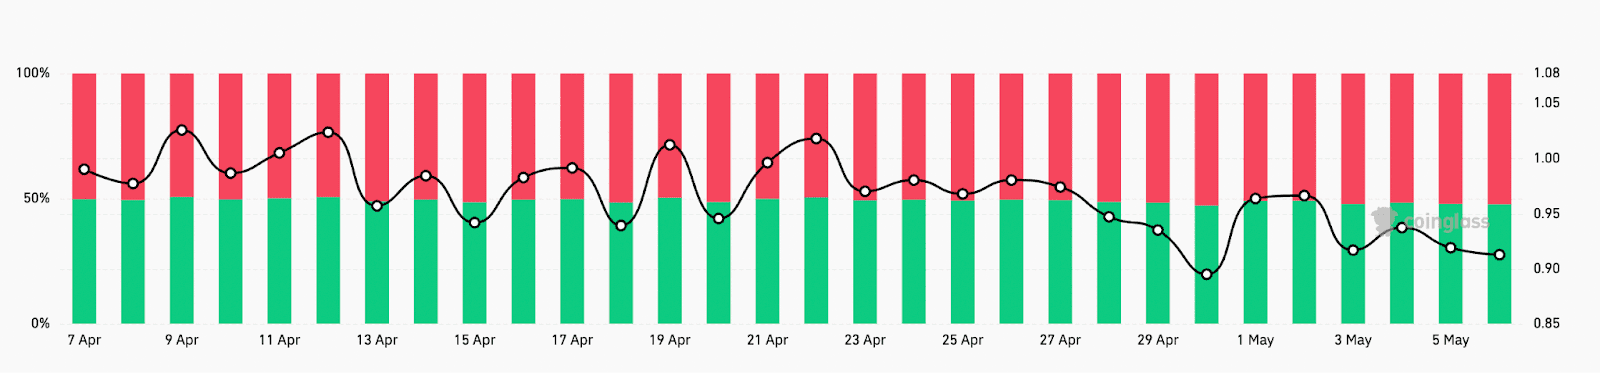
The 24-hour long/short ratio currently sits at 0.9131, confirming that bullish sentiment is diminishing. This ratio indicates that there are slightly more traders betting against XRP than those betting for it, amplifying the effect of the downturn.
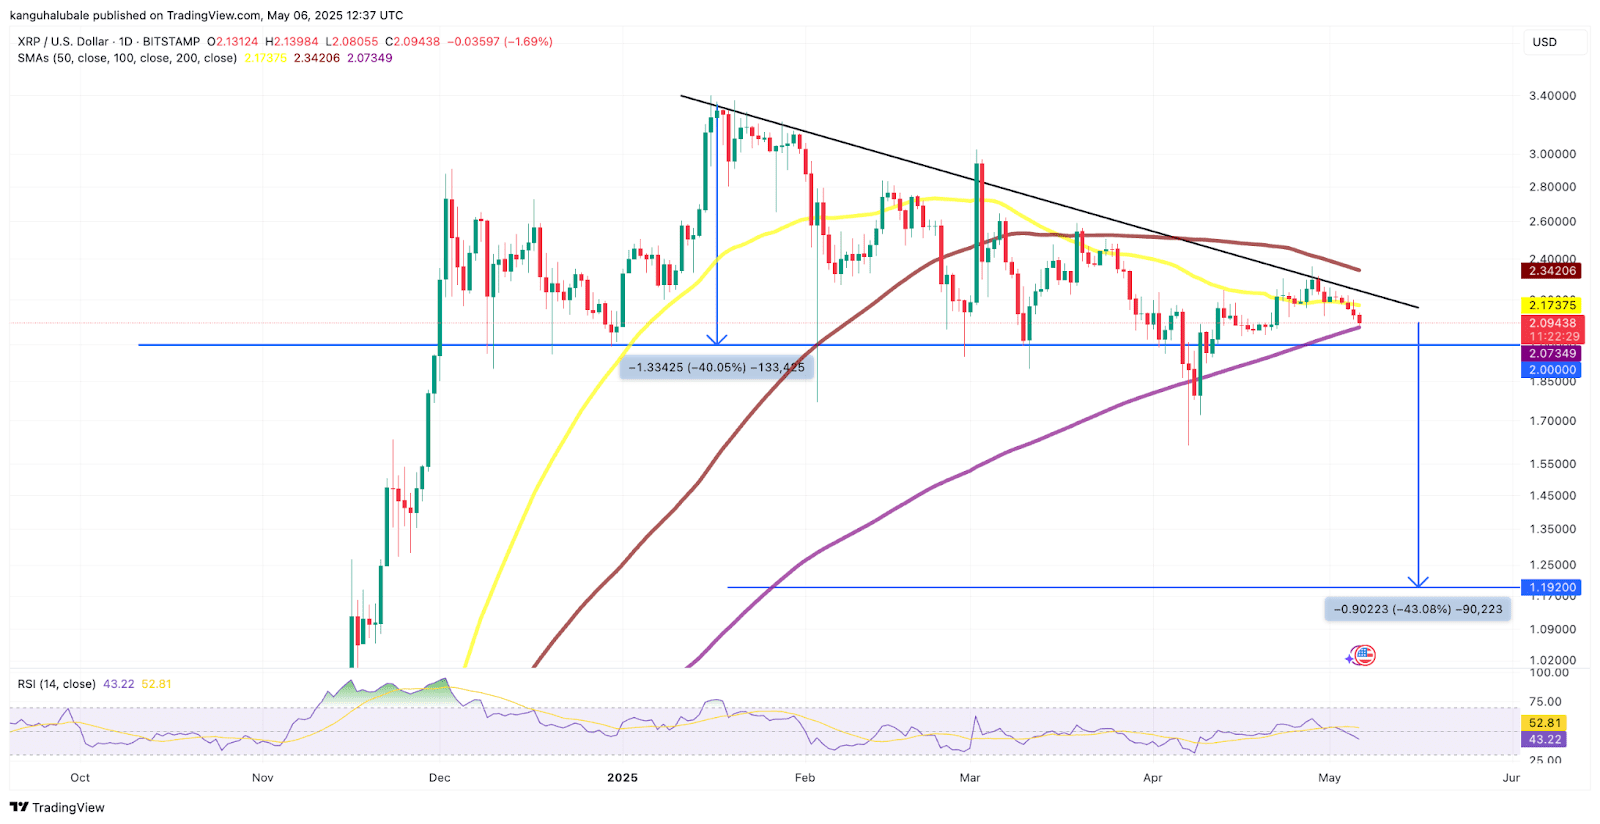
Technical Analysis: A Downtrend Confirmed?
From a technical perspective, XRP’s price action suggests a continuing downtrend. The price is currently confined within a descending triangle pattern, with a multi-month downtrend line acting as resistance and the $2.00 level serving as support.
The Relative Strength Index (RSI) has decreased from 60 to 43 since late April, indicating increasing bearish momentum. If bears manage to push the price below the $2.00 support level, the XRP/USDT pair could potentially decline towards the technical target of the triangle, around $1.92.
However, a break above the resistance line and a sustained close above it could signal a shift in momentum, potentially leading to a retest of the $2.34 resistance level (also the 100-day SMA). If this level is breached, the next target would be $3.00.
Conclusion
In summary, XRP’s price decline today is a result of multiple converging factors. Ripple’s strategic shift, declining open interest, and bearish technical indicators all contribute to the current downward pressure. While the short-term outlook appears bearish, a break above key resistance levels could potentially reverse the trend. Investors should carefully monitor these factors to make informed decisions.
Disclaimer: This article does not contain investment advice or recommendations. Every investment and trading move involves risk, and readers should conduct their own research when making a decision.