Key Takeaways:
- Bitcoin is attempting to solidify $100,000 as a new support level, signaling bullish momentum.
- Ethereum is currently leading the altcoin surge, potentially followed by DeFi tokens.
- Short liquidations in Bitcoin reached significant levels after breaking the $100,000 barrier.
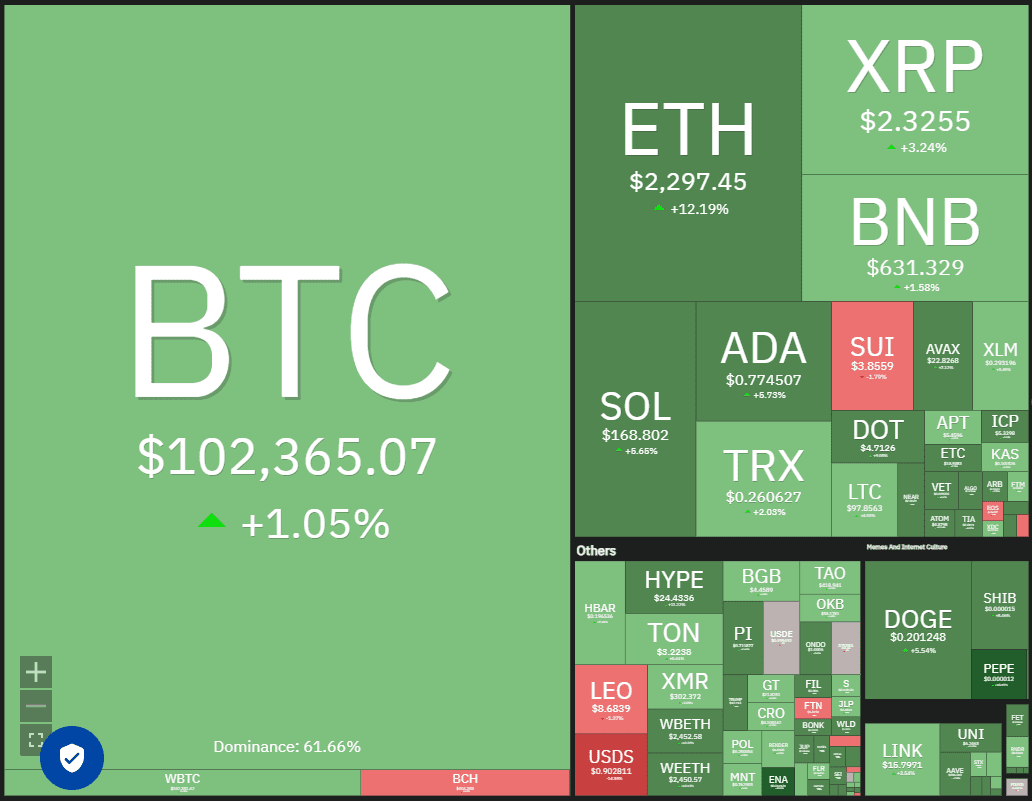
Bitcoin (BTC) experienced a breakthrough on May 8th, surpassing the crucial $100,000 mark. Bulls are now focused on maintaining this level. According to CoinGlass, this surge triggered a substantial $837.80 million in short liquidations within a 24-hour period, marking the largest liquidation event since 2021.
The Bitcoin rally also positively impacted major altcoins, propelling them above their respective resistance levels. Ether (ETH) spearheaded this altcoin surge, jumping approximately 22% on May 8th, leading to a $328 million liquidation of Ether short positions.
While the short-term outlook appears promising, Bitcoin is expected to encounter significant resistance near its all-time high of $109,588. To sustain the bullish momentum, traders need to maintain the price above $100,000 during any pullbacks.
This analysis delves into the potential for Bitcoin to surpass its all-time high and examines the possibility of a short-term rally for altcoins. The following sections analyze the charts of the top 10 cryptocurrencies to provide insights into potential price movements.
Bitcoin (BTC) Price Prediction
Bitcoin’s rally exceeded 6% on May 8th, closing above $100,000, indicating strong buying pressure and control by the bulls.
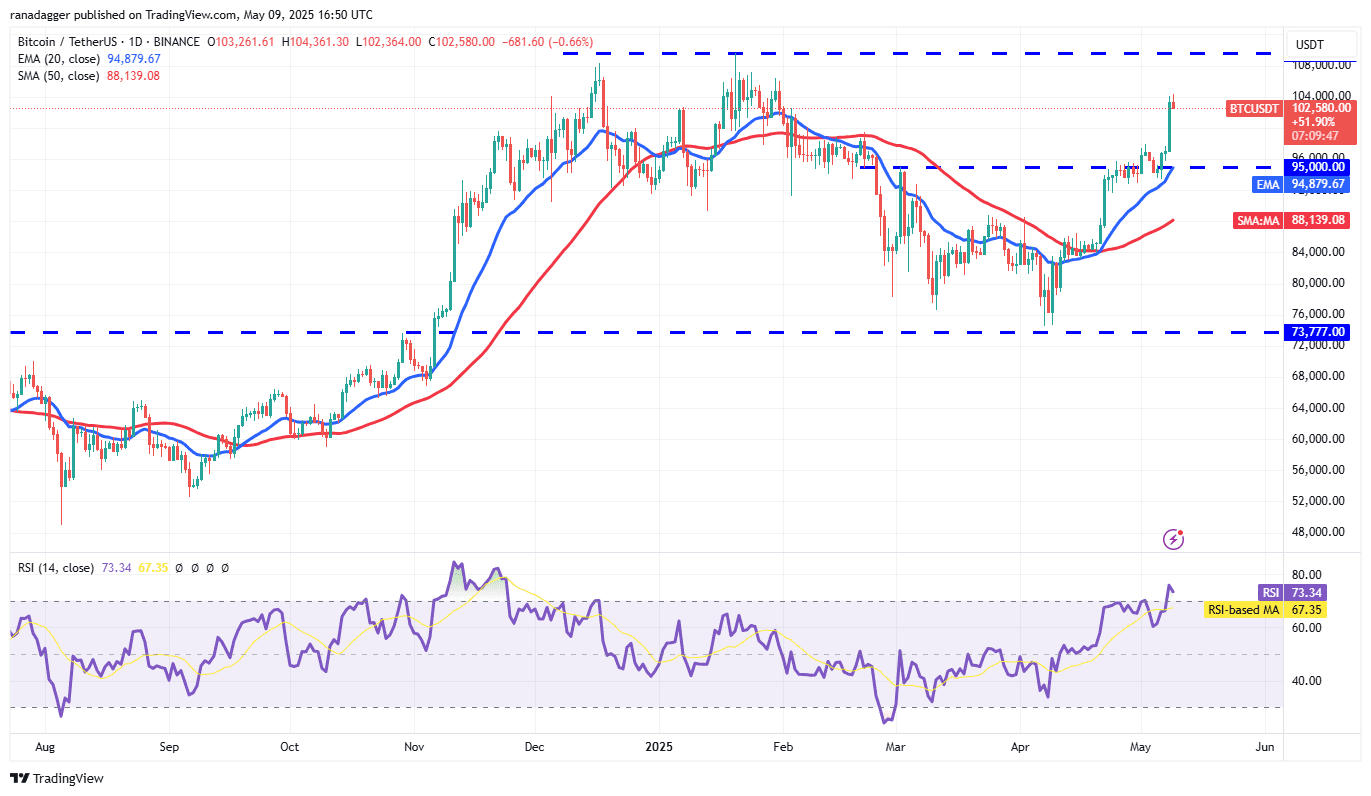
The BTC/USDT pair has the potential to reach the $107,000 – $109,588 range, where strong resistance is anticipated from bears. The Relative Strength Index (RSI) currently indicates overbought conditions, suggesting a possible short-term pullback.
A positive scenario would involve the price declining from the overhead resistance but finding support at the 20-day Exponential Moving Average (EMA) at $94,879, which signals positive sentiment. This would likely be followed by another attempt by bulls to push the price beyond the all-time high.
Conversely, a close below the 20-day EMA would indicate weakness and potential profit-taking at higher levels, possibly leading to a decline towards the 50-day Simple Moving Average (SMA) at $88,139.
Ethereum (ETH) Price Prediction
Ether (ETH) surged above the $2,111 resistance on May 8th, extending its upward movement to almost $2,550 on May 9th.
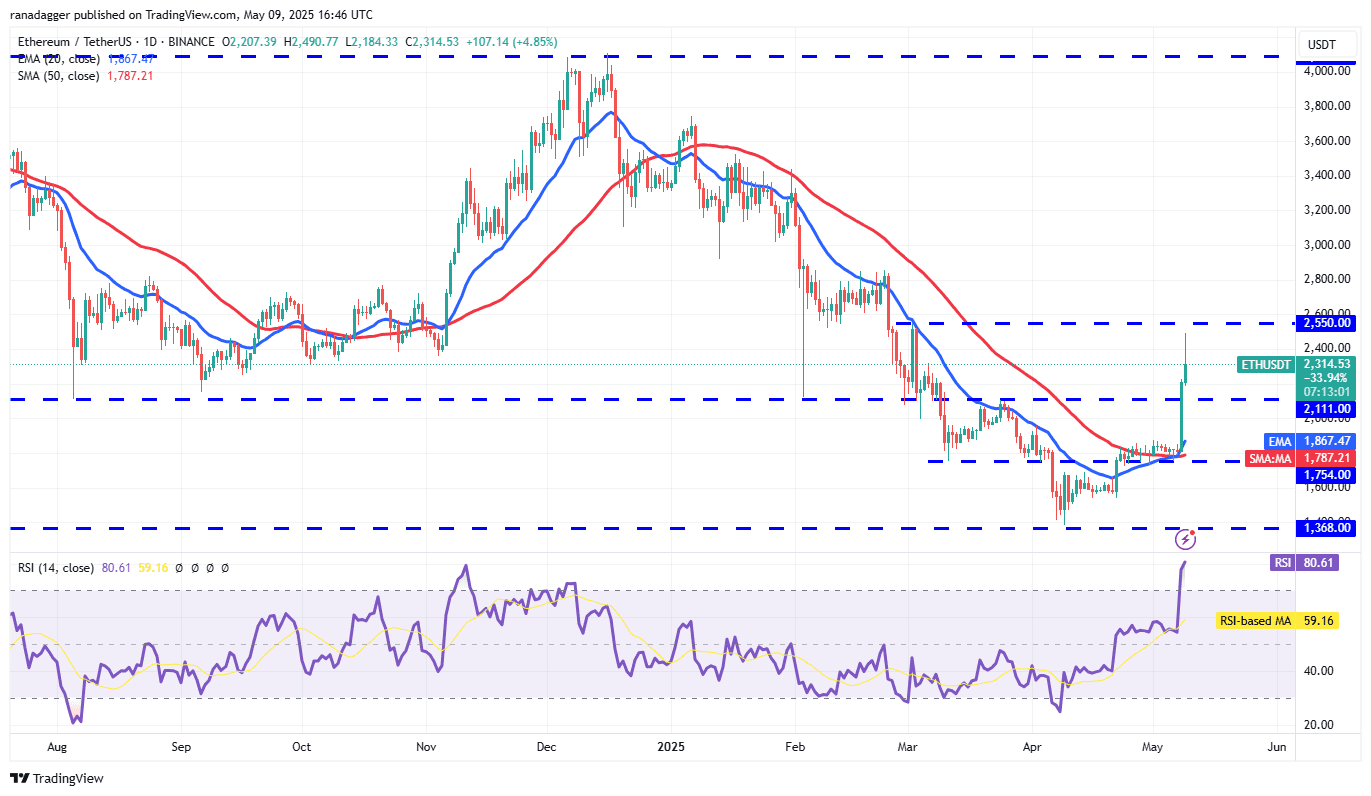
The long wick on the candlestick suggests strong selling pressure near $2,550. If the price pulls back from this level but finds support at $2,111, it indicates that bulls are attempting to convert this level into support, setting the stage for another attempt to push the ETH/USDT pair above $2,550. Success in this attempt could lead to a climb toward $2,850.
To weaken the bullish momentum, sellers need to drive the price below the $2,111 level. This could cause the pair to fall towards the 20-day EMA at $1,867.
XRP Price Prediction
XRP has been pushed by buyers toward the resistance line, a critical level in the near term.
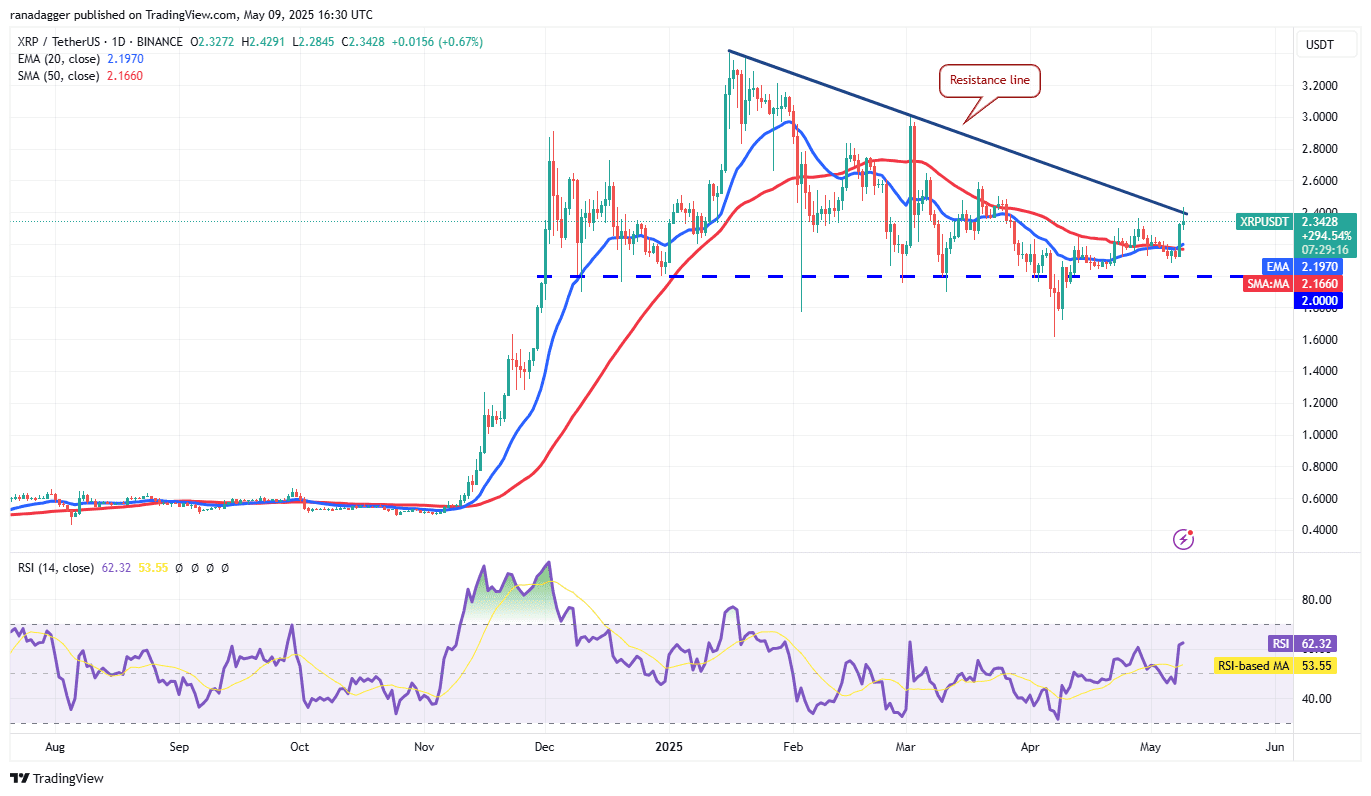
Sellers are likely to defend the resistance line aggressively, as a break and close above it could signal a potential trend reversal. The XRP/USDT pair could then potentially rise to $2.60 and subsequently to $3.
If the price retreats from the resistance line but finds support at the moving averages, it suggests that bulls are buying on dips, setting the stage for another attempt to propel the price above the resistance line. Sellers will need to push the price below the $2 support to regain control.
BNB Price Prediction
BNB demonstrated a strong upward move on May 8th, breaking above the immediate overhead resistance at $620.
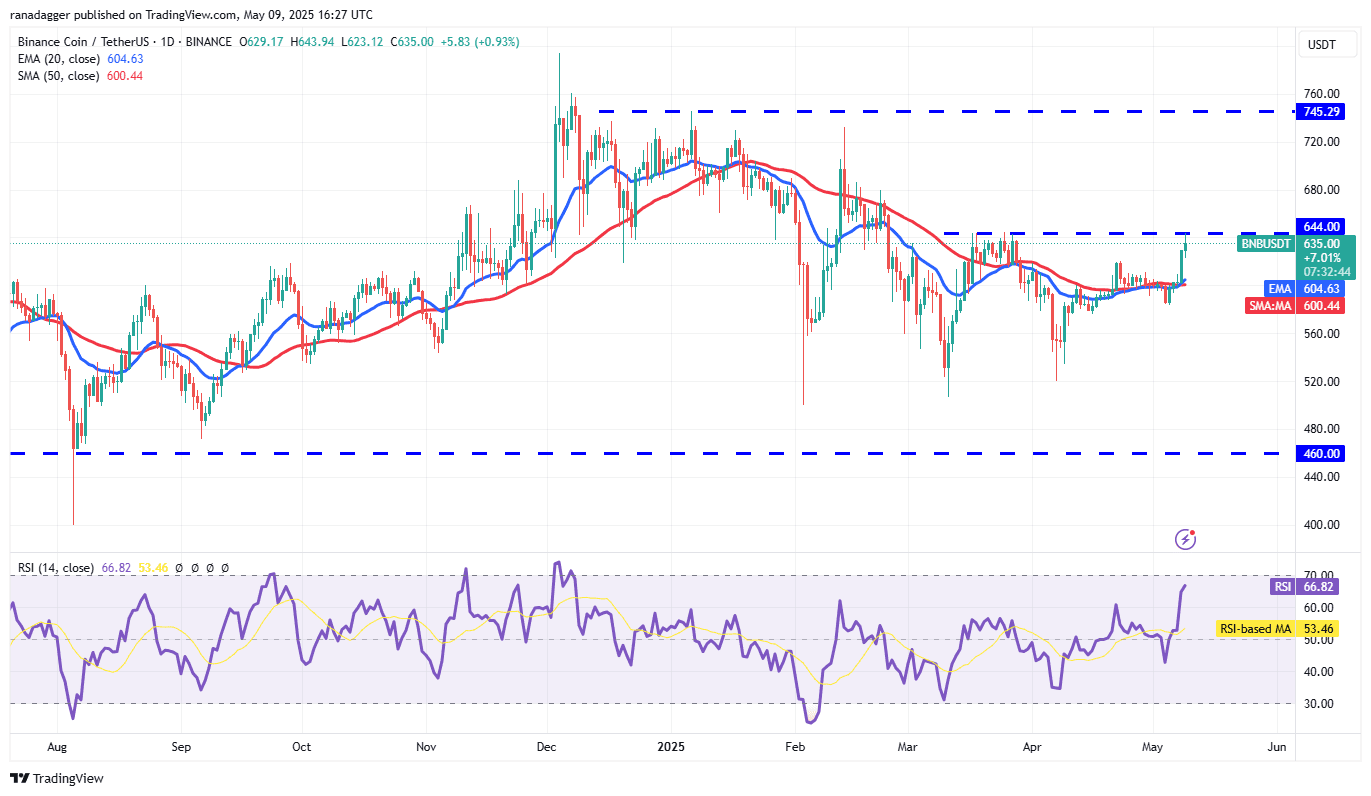
The BNB/USDT pair reached the $644 level on May 9th, which is expected to act as a strong barrier. However, if buyers maintain the pressure and break through the $644 resistance, the pair could surge to $680.
Time is limited for the bears. To halt the uptrend, they must fiercely defend the $644 level and push the price below the moving averages. This could lead to a descent towards $580.
Solana (SOL) Price Prediction
Solana (SOL) successfully broke and closed above the $153 resistance level on May 8, indicating a bullish trend.
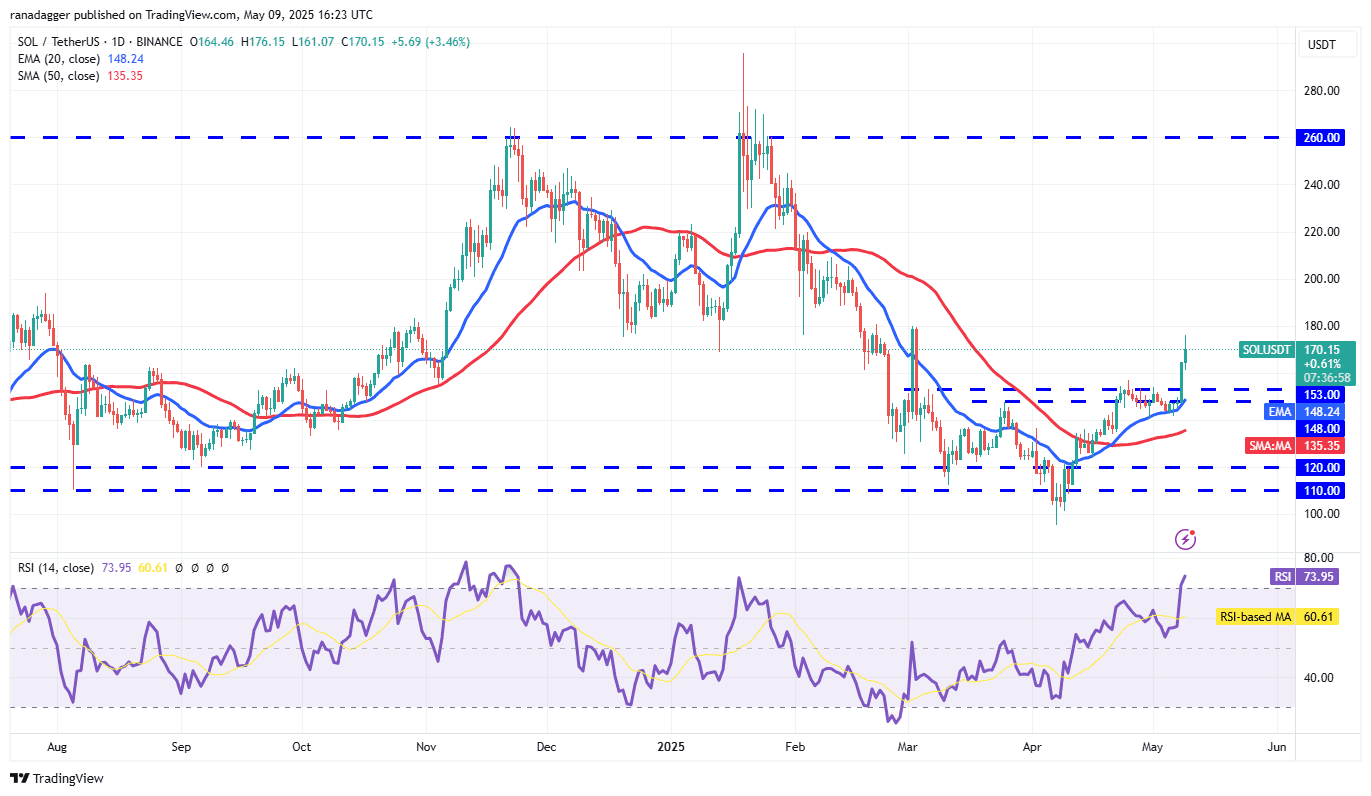
The SOL/USDT pair is now targeting $180, a level expected to present significant resistance. If the price retraces from $180 but finds support at $153, it would signal a bullish trend as buyers attempt to establish a higher low. This scenario would increase the likelihood of a subsequent rally towards $200.
However, the bullish outlook would be invalidated if the price experiences a sharp decline, falling below the $140 support. This would indicate that investors are securing profits at the current levels, potentially leading to further downward pressure.
Dogecoin (DOGE) Price Prediction
Buyers have effectively defended the moving averages, propelling Dogecoin (DOGE) towards the overhead resistance level at $0.21.
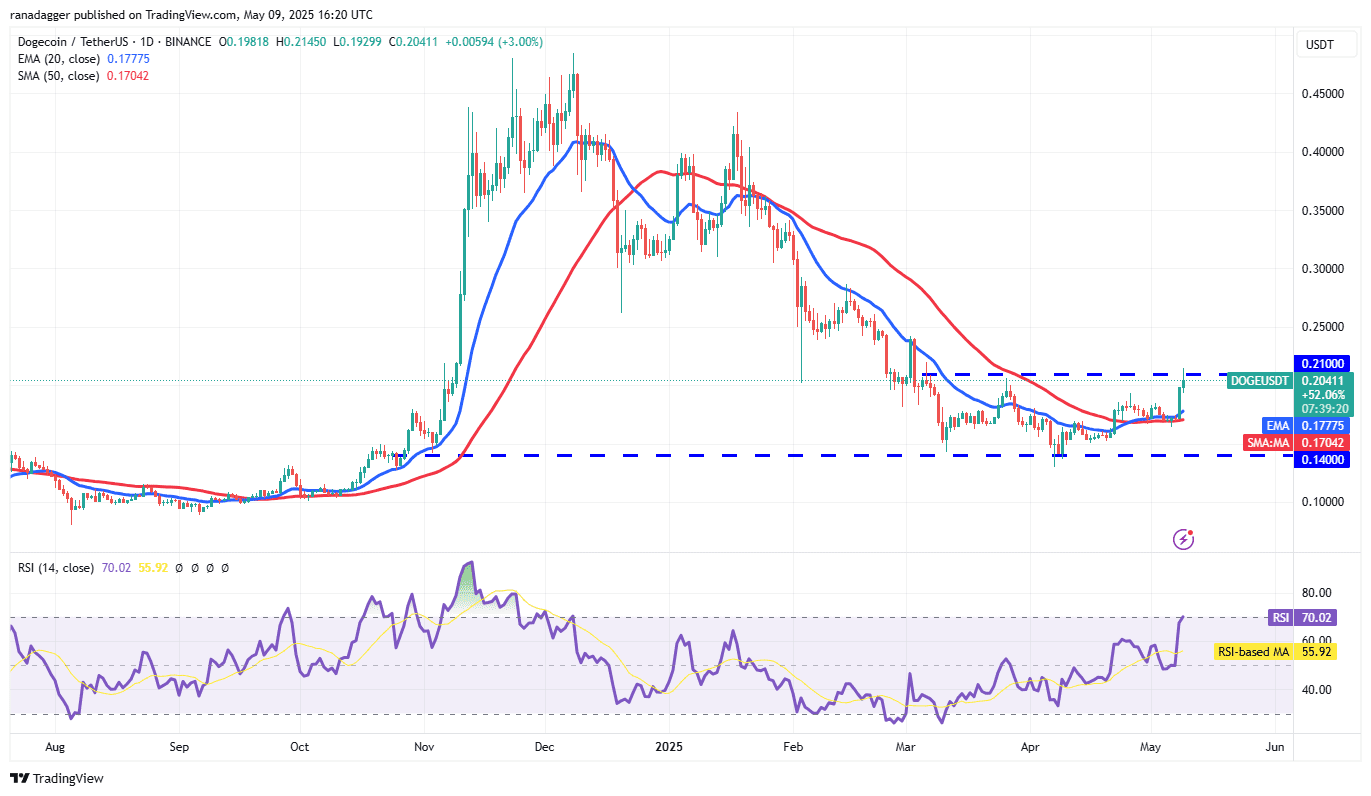
Sellers are anticipated to resist the upward momentum at $0.21. Should the bulls successfully breach this resistance, the DOGE/USDT pair could potentially rally towards $0.25. Conversely, if the price declines from $0.25 but establishes support at $0.21, it would suggest that the bulls have converted this level into a support zone, possibly signaling the end of the current downtrend.
In contrast, a sharp price reversal from $0.21, breaking below the moving averages, would indicate that the pair may continue to oscillate within its current range for an extended period.
Cardano (ADA) Price Prediction
Cardano (ADA) rebounded from the 50-day SMA at $0.67, completing an inverse head-and-shoulders pattern on May 8.
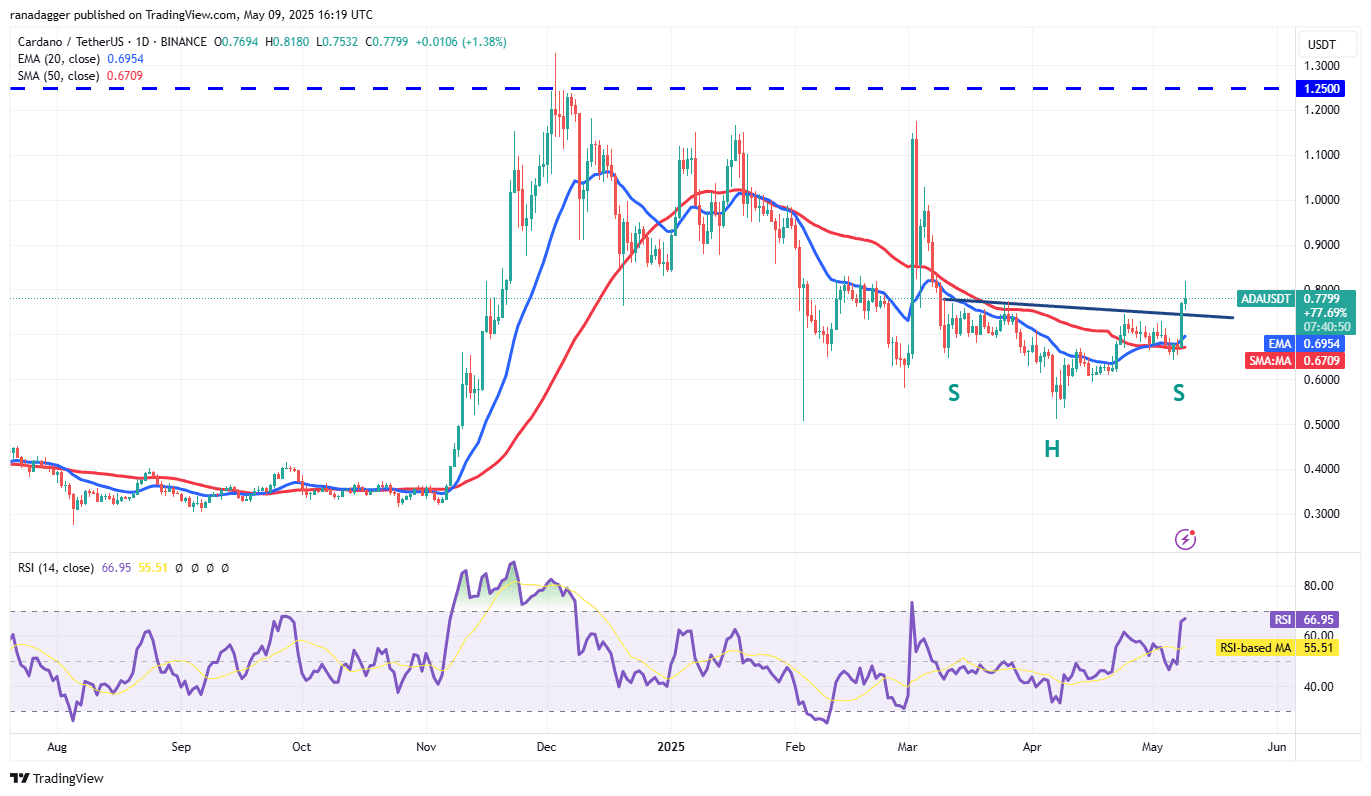
The 20-day EMA has started to trend upwards, and the RSI is in positive territory, signaling an advantage to buyers. If the price remains above the neckline, the ADA/USDT pair could surge towards the pattern target of $1.01. There is resistance at $0.83, but it is likely to be crossed.
If bears want to prevent the upside, they will have to yank the price below the 50-day SMA. That could sink the pair to $0.60 and eventually to $0.50.
Sui (SUI) Price Prediction
Sui (SUI) experienced a sharp rally from the 20-day EMA ($3.29), surpassing the $3.90 overhead resistance on May 8.
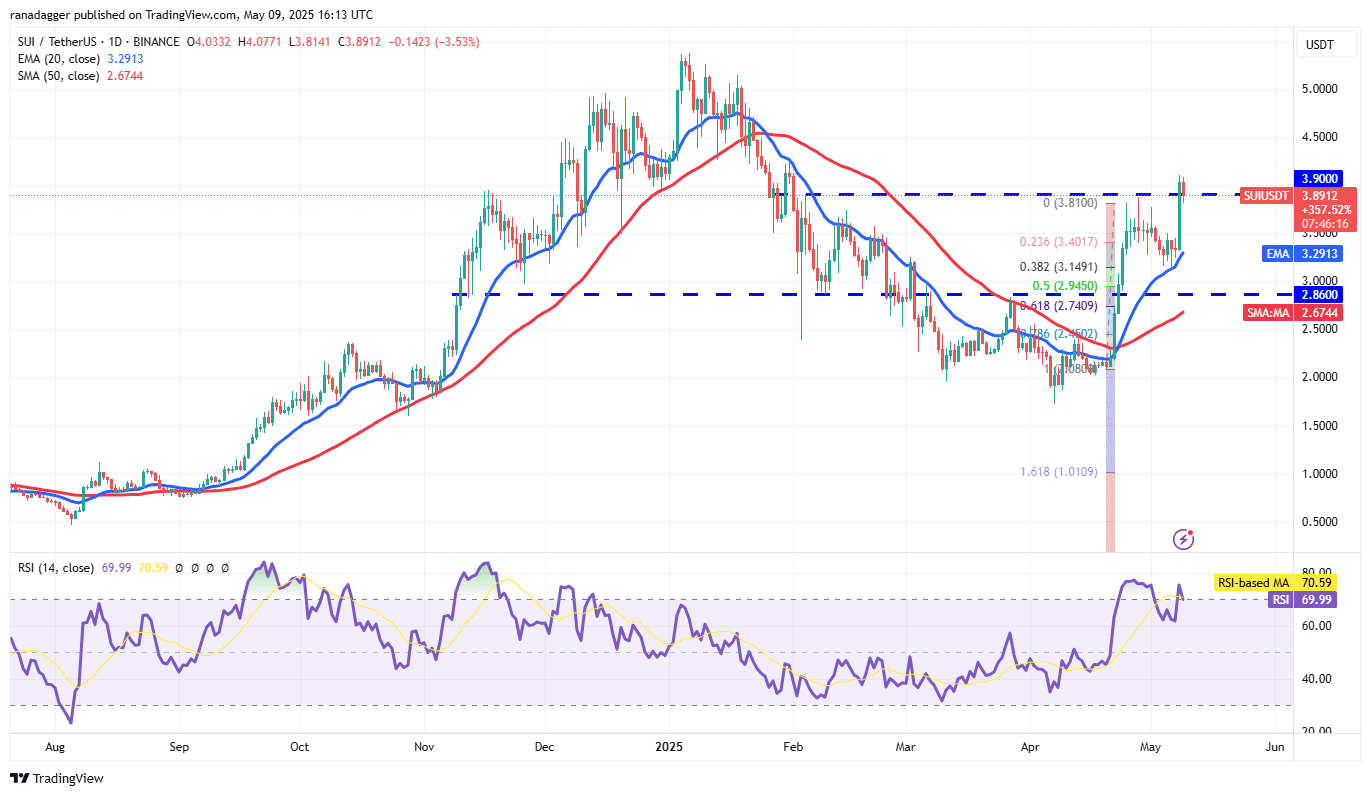
The upward-sloping 20-day EMA and the RSI near the overbought zone indicate bullish momentum. If the price remains above $3.90, the SUI/USDT pair could rally to $4.25 and eventually to $5.
Alternatively, if the price declines and closes below $3.90, it suggests that bears are trying to make a comeback. The pair could then slump to the 20-day EMA, which is likely to act as solid support.
Chainlink (LINK) Price Prediction
Chainlink (LINK) rebounded strongly from the 50-day SMA ($13.72) on May 8 and completed an inverse head-and-shoulders pattern.
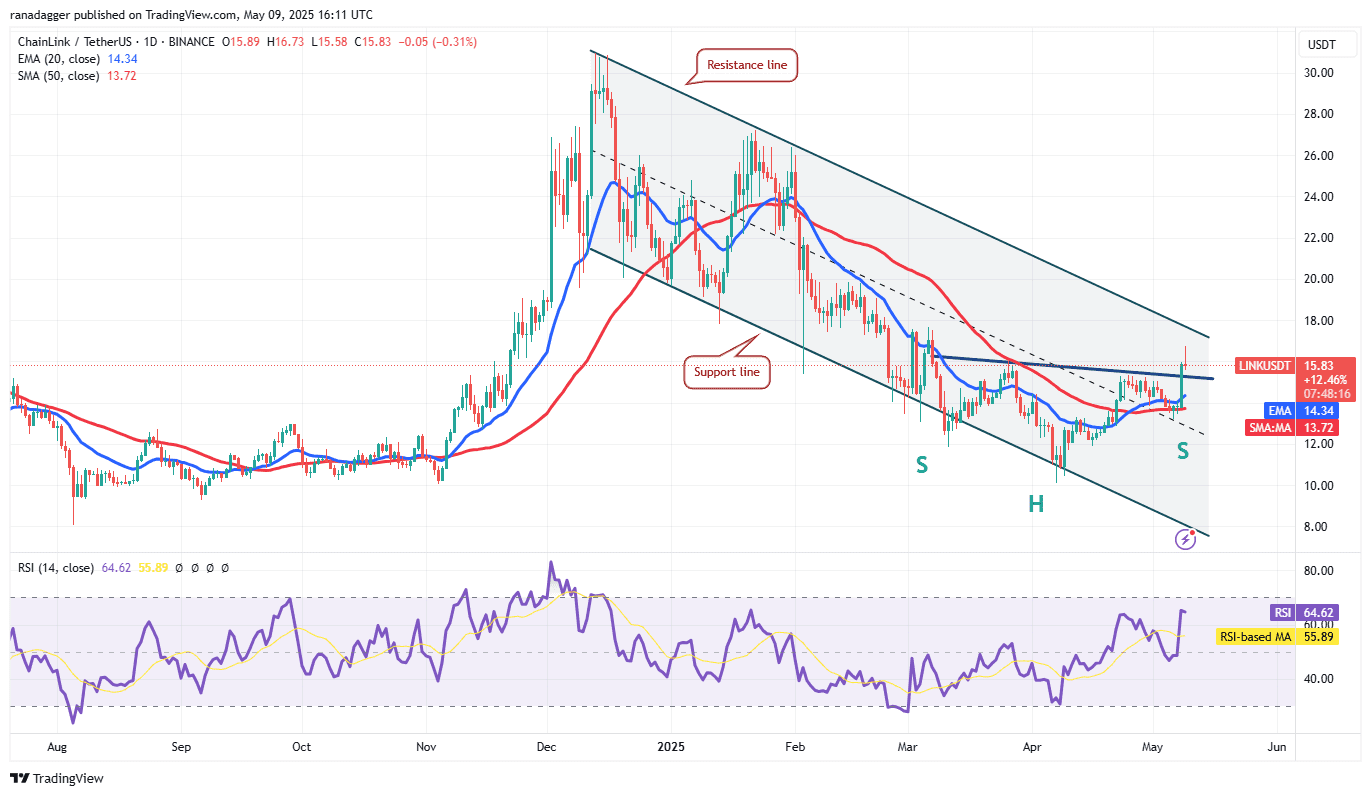
Sellers are attempting to pull the price back below the neckline, but if the bulls successfully hold the level, the LINK/USDT pair could break above the resistance line and rally toward the pattern target of $21.30.
This optimistic view will be negated if the price turns down sharply and breaks below the moving averages. That opens the doors for a fall to $12, indicating that the pair may remain inside the channel for a while longer.
Avalanche (AVAX) Price Prediction
Avalanche (AVAX) rebounded off the moving averages on May 8 and reached the overhead resistance of $23.50 on May 9.
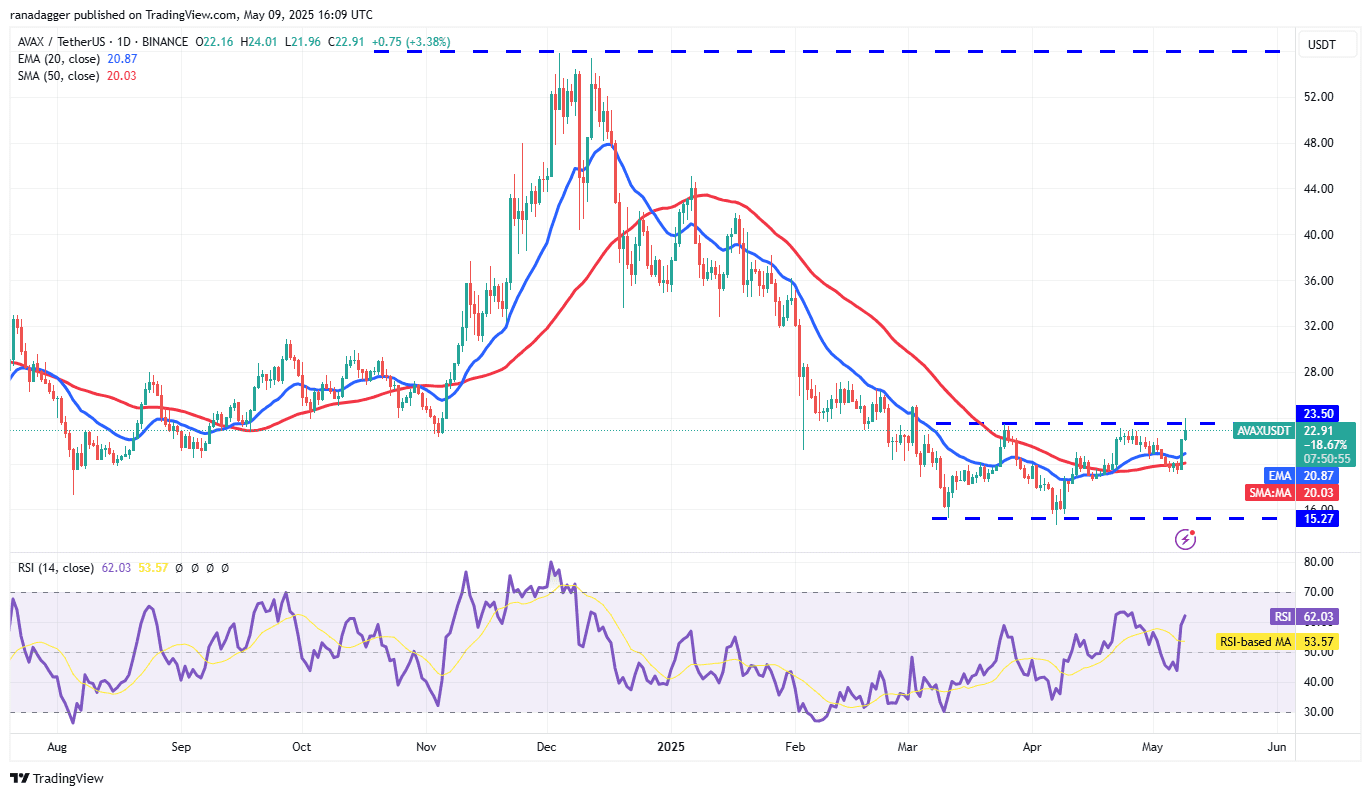
Sellers are expected to defend the $23.50 level with all their might because a break and close above the resistance could clear the path for a potential rise to $28.78 and, after that, to $31.73.
On the contrary, if the price turns down sharply from $23.50 and breaks below the moving averages, it suggests that the AVAX/USDT pair may extend its stay inside the range for a few more days.
Disclaimer: This analysis is for informational purposes only and does not constitute financial advice. Trading cryptocurrencies involves significant risk. Conduct thorough research and consult a financial advisor before making any investment decisions.