Bitcoin (BTC) is starting the week strong, hitting multi-month highs as traders brace for potential volatility fueled by US CPI data and ongoing US-China trade discussions. This article highlights five crucial aspects influencing Bitcoin’s price and market sentiment this week.
Key Takeaways for Bitcoin Traders This Week:
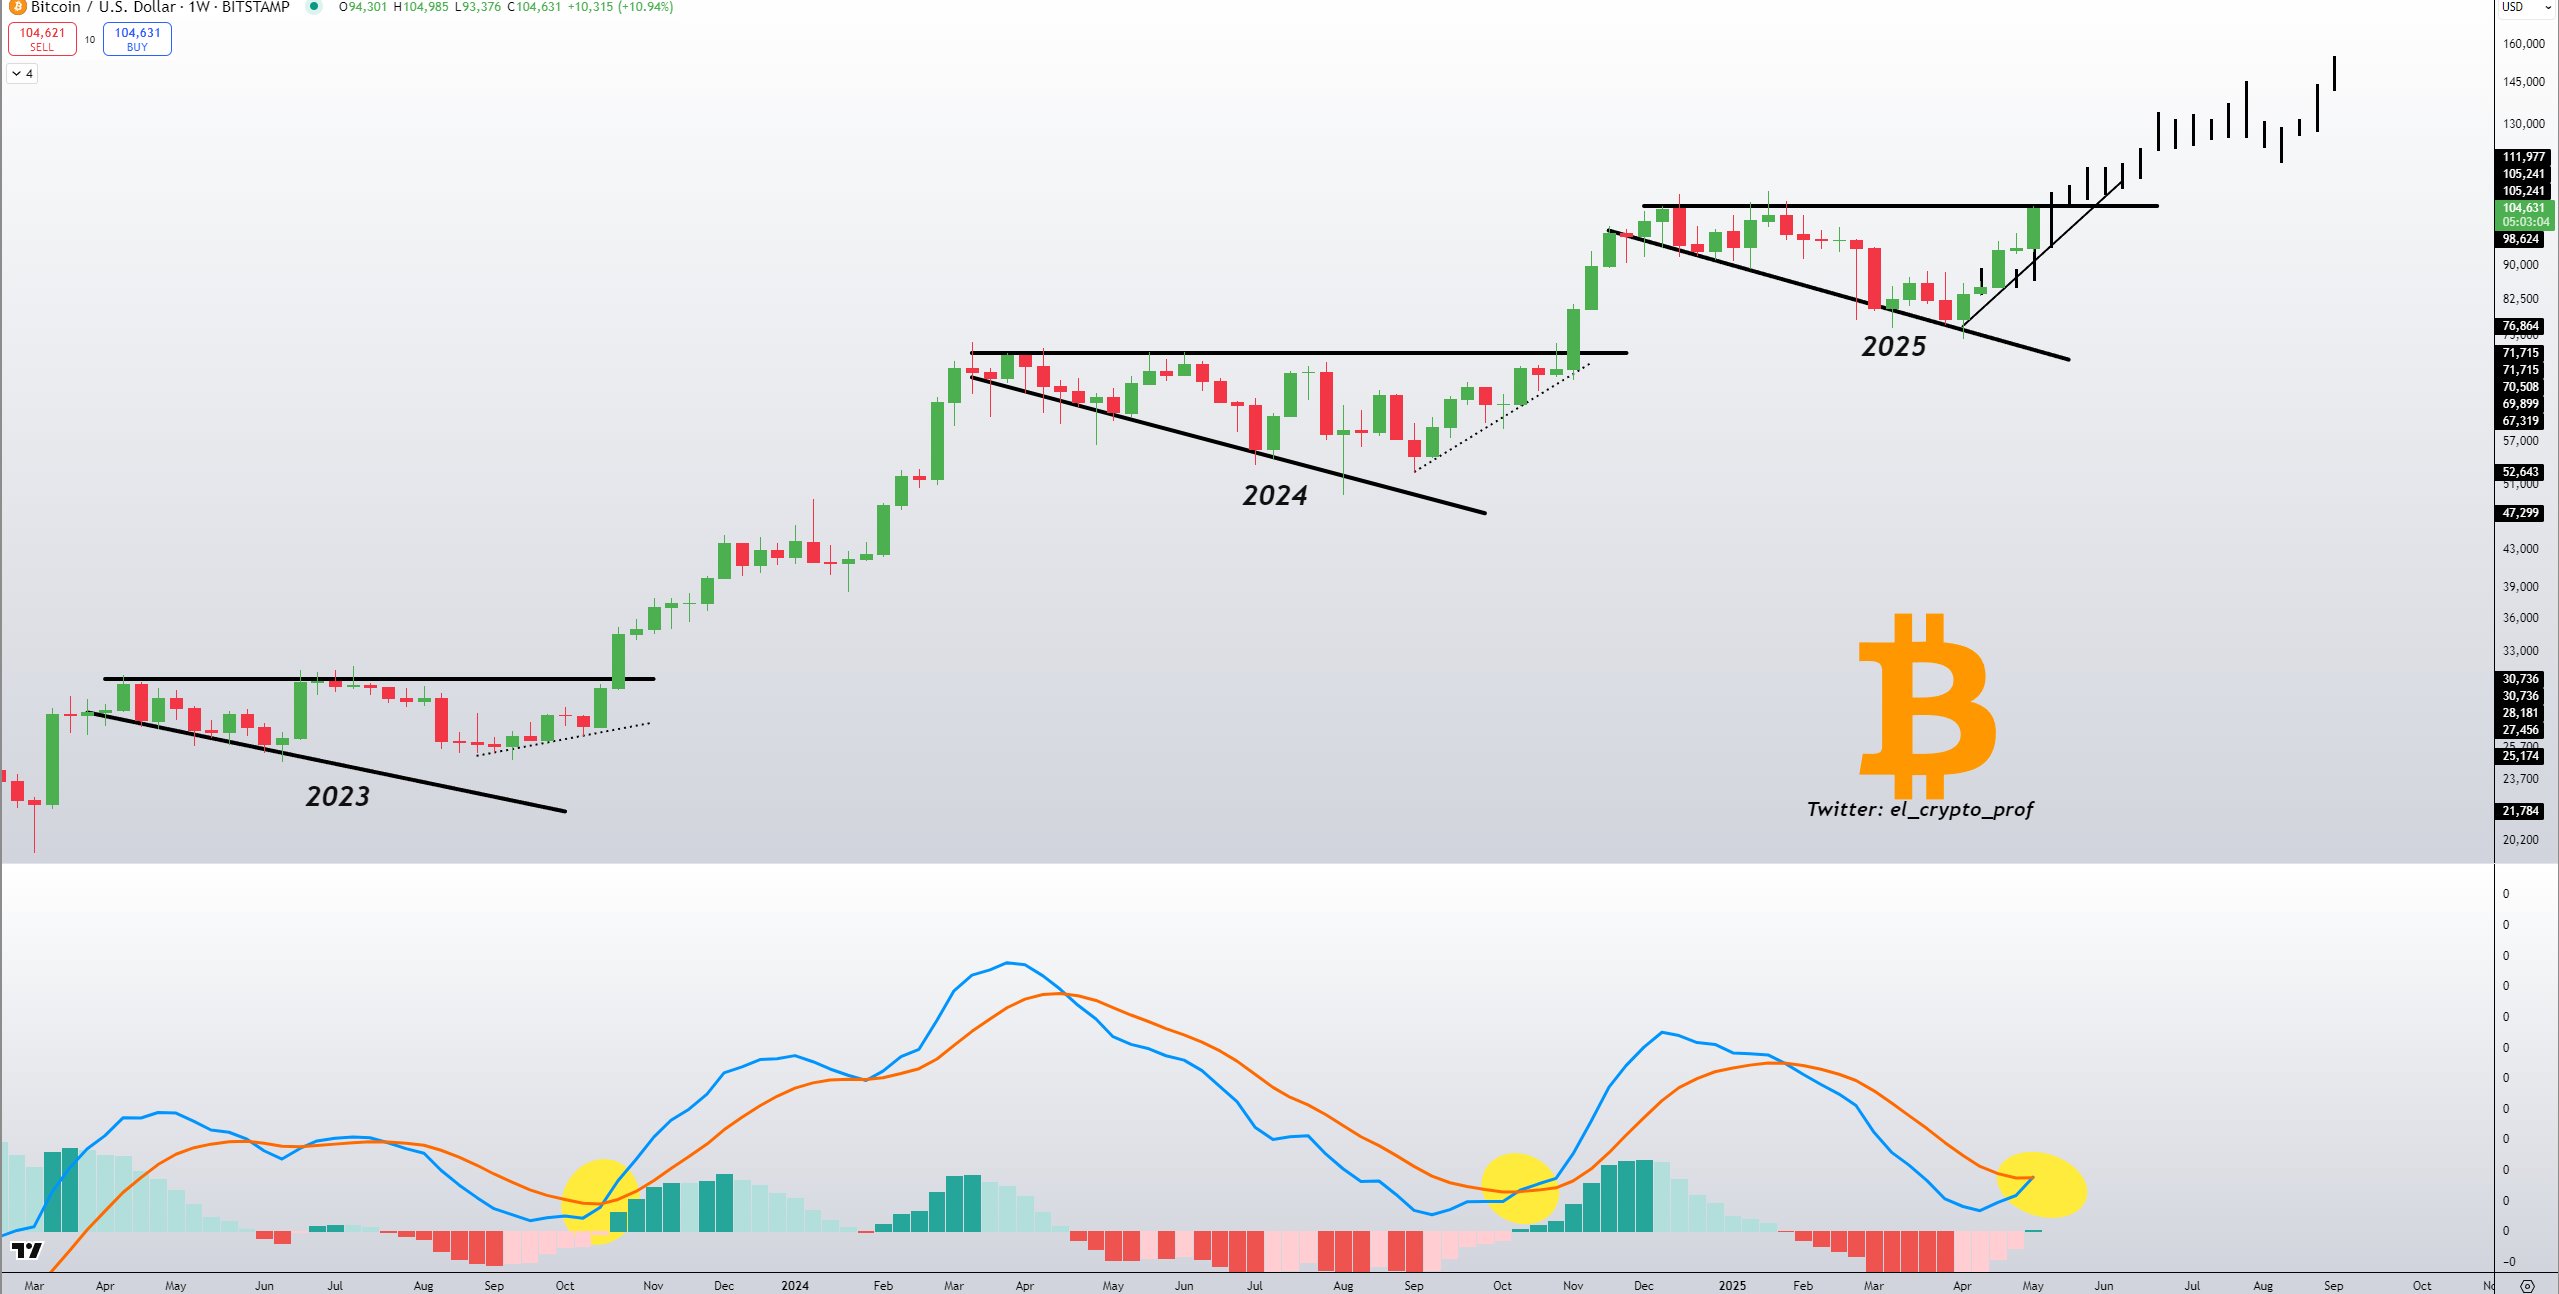
- Bullish MACD Crossover: A significant bullish signal has emerged with a key crossover on the weekly Moving Average Convergence Divergence (MACD) indicator, mirroring a pattern last seen in October 2024, potentially signaling further upward momentum.
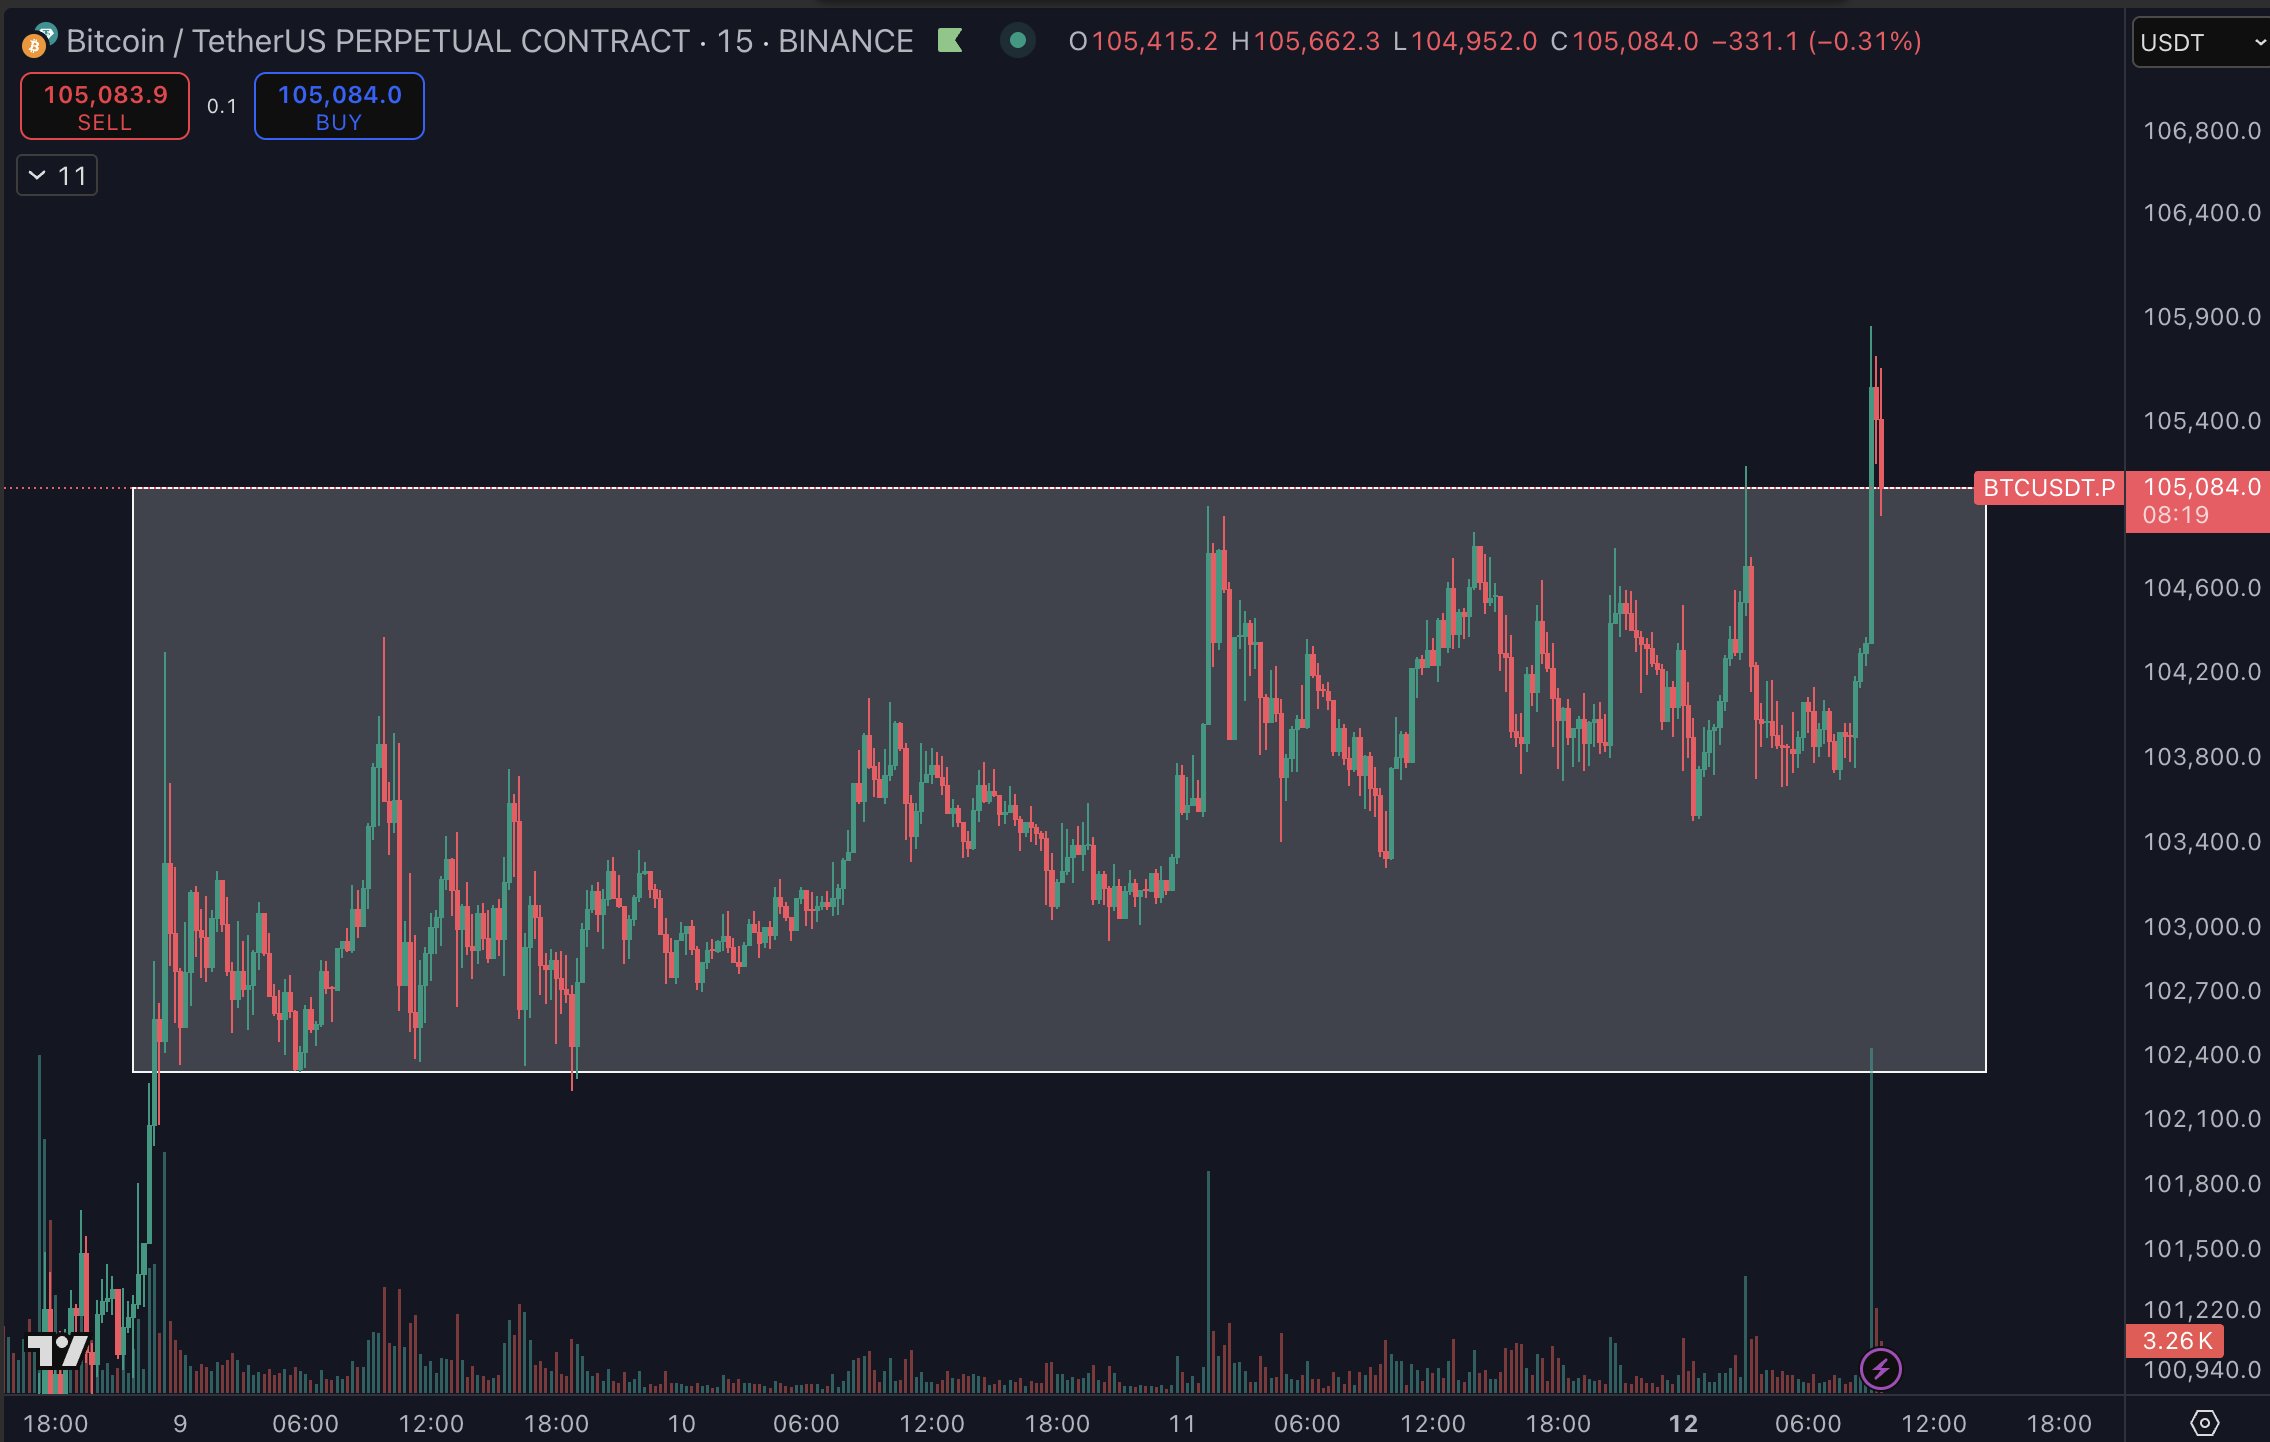
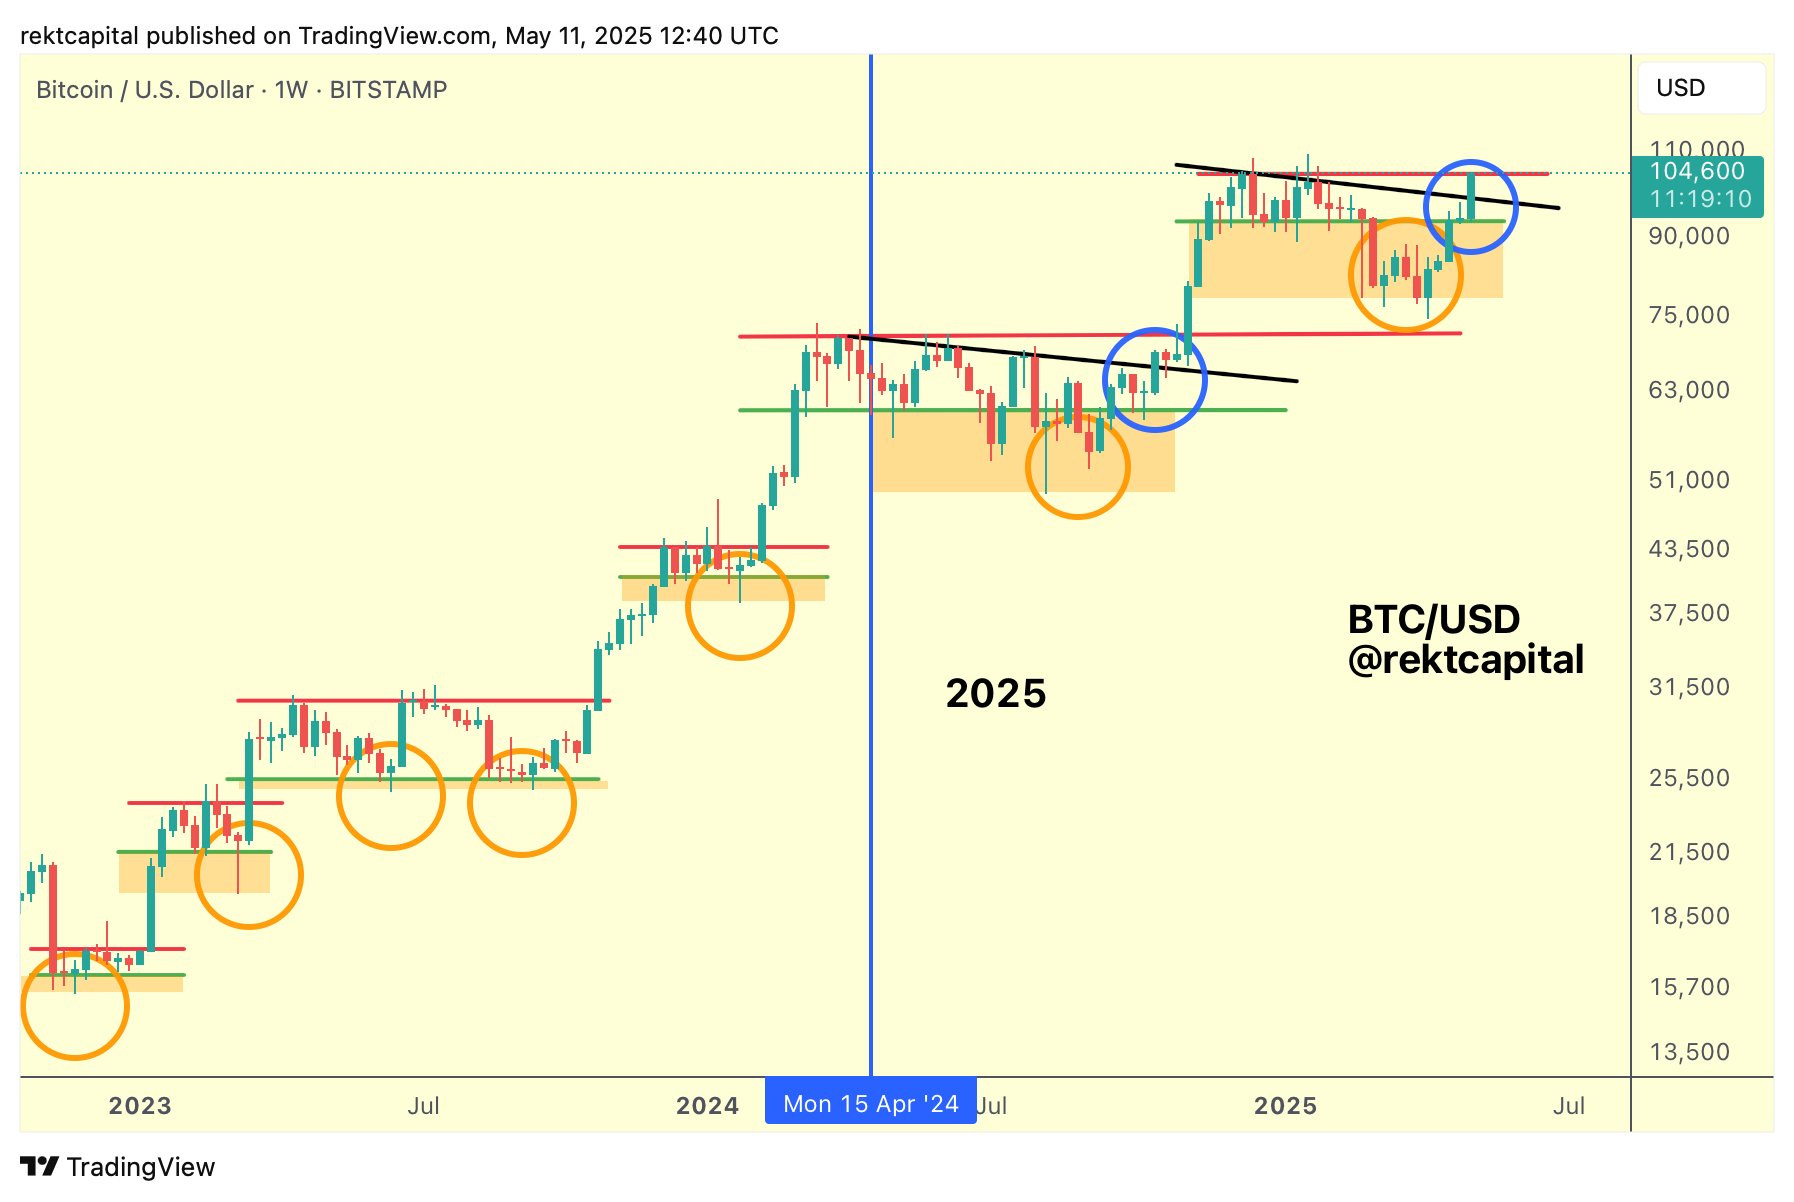
- Resistance at $104,500: Bitcoin faced rejection at the $104,500 level, a critical point to surpass for a fresh breakout and price discovery. Failure to hold above this level could lead to a retest of lower support levels.
- CPI and US-China Trade Deal: Market volatility is expected due to upcoming US Consumer Price Index (CPI) data and ongoing developments surrounding a potential US-China trade deal. Any announcements or updates related to these events could trigger rapid price swings.
- Supply in Loss Below 2%: The percentage of Bitcoin supply in loss has dipped below 2%, a rare occurrence typically observed during late-stage bull runs. This suggests strong holding sentiment among long-term investors.
- Retail Interest Still Low: Despite recent gains, mainstream retail interest in Bitcoin remains relatively low, indicating that the current rally is primarily driven by institutional investors and experienced traders.
Diving Deeper into Bitcoin’s Recent Performance:
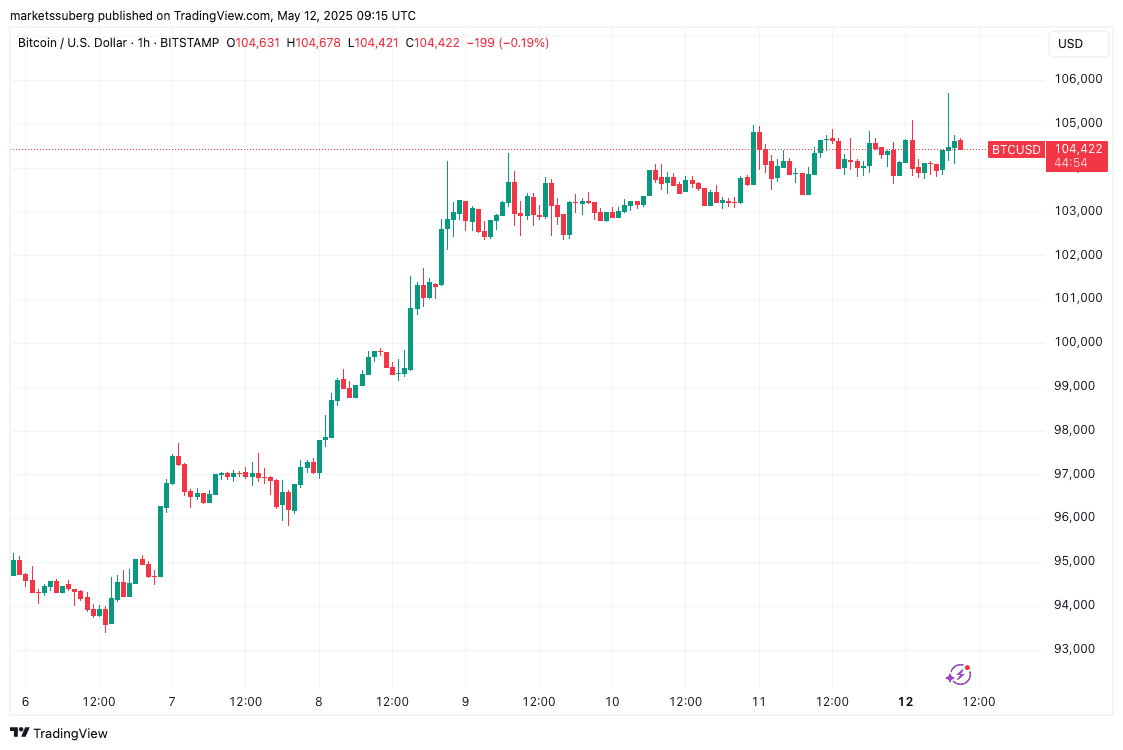
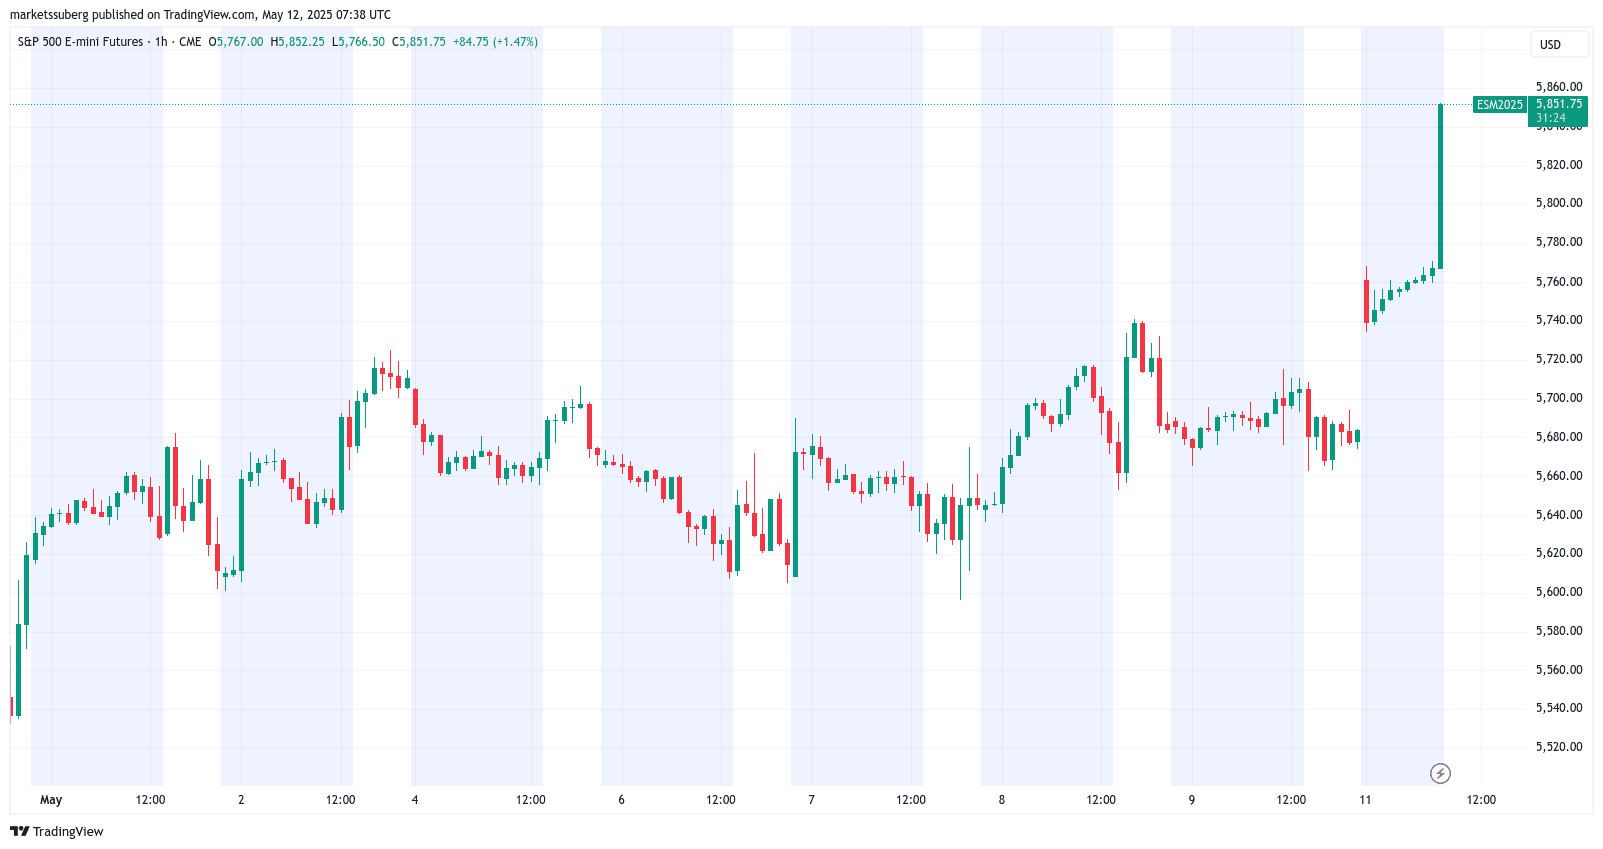
Bitcoin’s recent price action has been characterized by rapid upward movements, followed by periods of consolidation. The hourly chart displays volatility spurred by news surrounding potential US trade tariffs, leading to both upward and downward “long wick” candles.
On Monday, Bitcoin reached a high of $105,706 on Bitstamp.
Traders have observed “aware” price action preceding major announcements, indicating potential insider information influencing market movements. As one trader noted, such activity could originate from various sources, given the significant implications of events like the US-China trade deal.
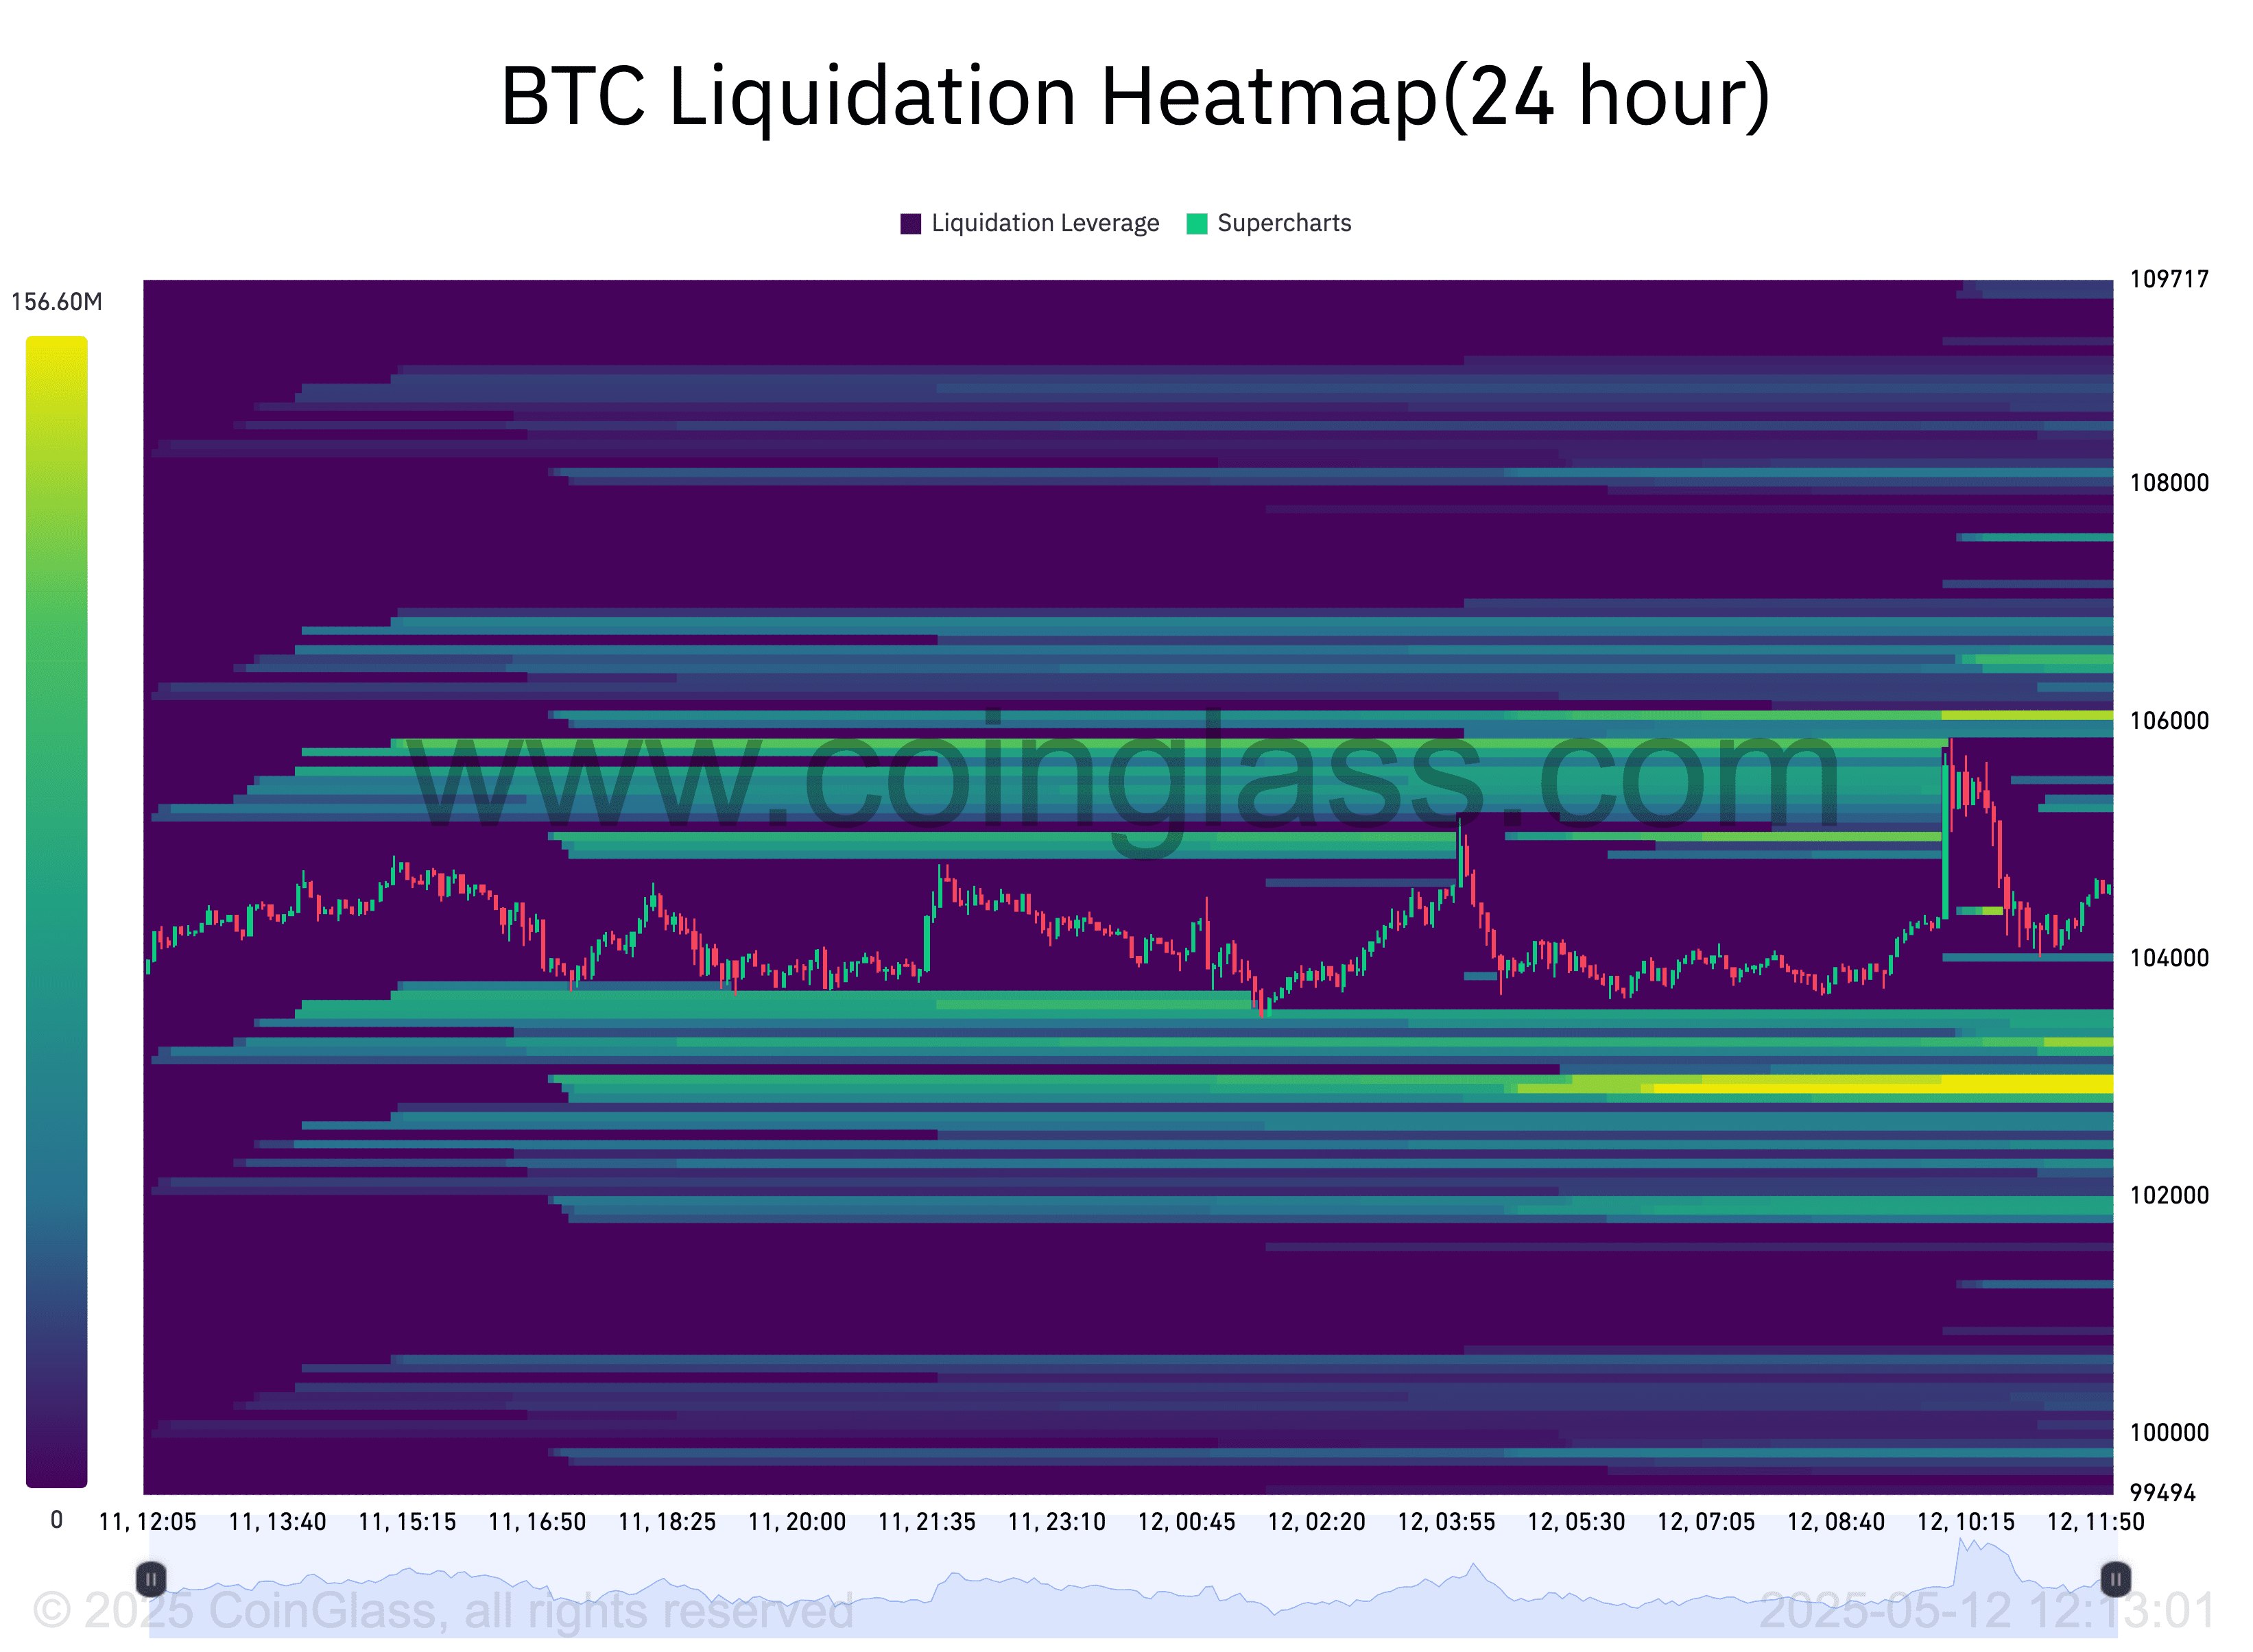
Further volatility is anticipated, with sharp price fluctuations expected in both directions. Exchange order book liquidity suggests the $106,000 level is a crucial resistance point to overcome.
MACD: A Bullish Indicator
The bullish cross on the weekly MACD indicator is viewed as a significant signal. The last time such a crossover occurred was in October 2024.
Resistance and Price Discovery
Despite reaching multi-month highs, Bitcoin failed to overcome a key support line, hindering a potential breakout. The weekly candle closed around $104,100, just shy of the level needed to trigger price discovery.

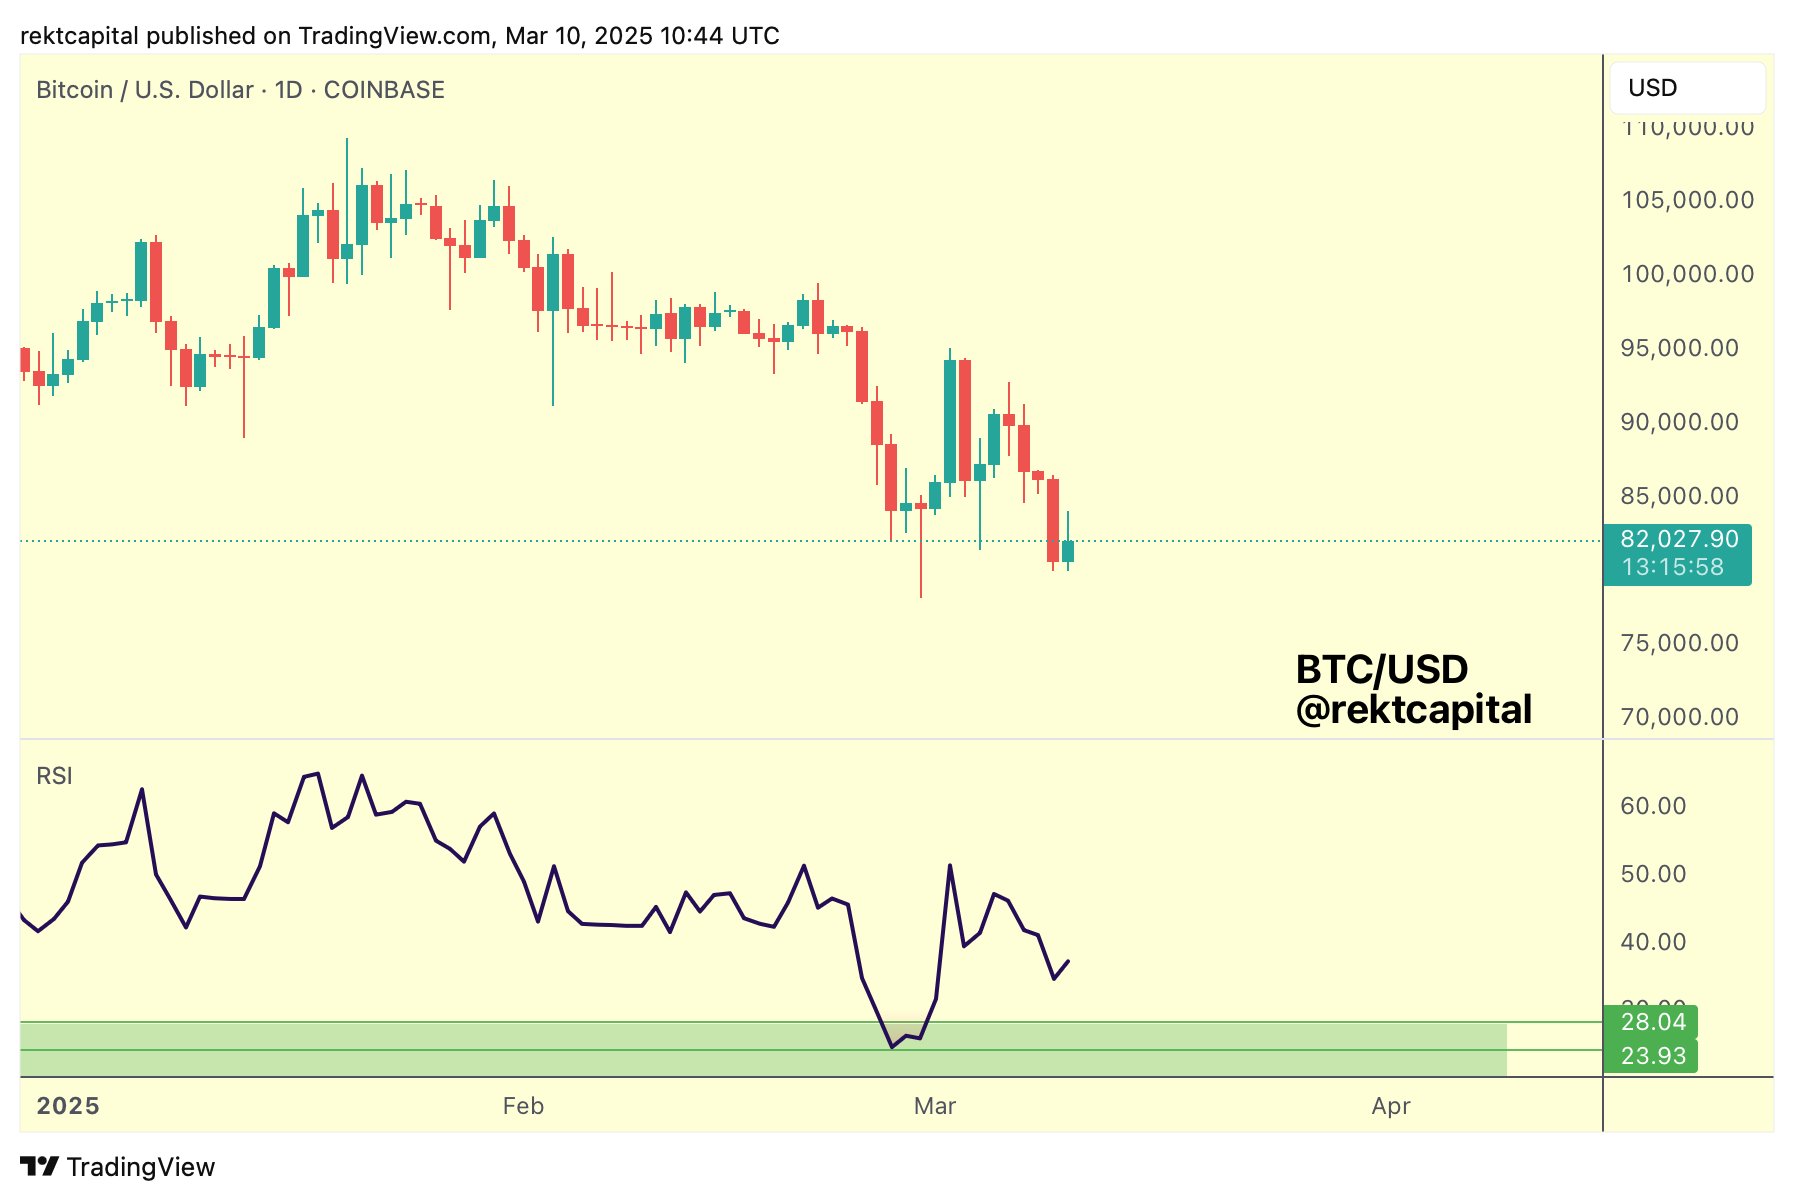
A rejection at $104,500 was confirmed, prompting analysts to monitor for lower lows in price action and higher lows on the Relative Strength Index (RSI) to identify potential bullish divergence.
Previously, there were indications that a retest of all-time highs was possible. Now, Bitcoin has returned to a trading range recently reclaimed, with bullish gains of 9.9% during the week.
Macroeconomic Factors: CPI and Trade Deals
The upcoming week is crucial for risk-asset traders due to the release of key inflation data, including the Consumer Price Index (CPI) and Producer Price Index (PPI) for April.
Markets are also closely monitoring developments surrounding US trade policy, particularly any news regarding a potential deal with China. This uncertainty contributes to market volatility.
Retail earnings reports could also play a significant role in shaping market performance. However, despite easing trade tensions, risk assets currently lack a strong bullish catalyst due to the Federal Reserve’s hawkish policy stance.
The Fed decided to leave interest rates unchanged at its recent meeting, with markets gradually pricing out a rate cut before July.
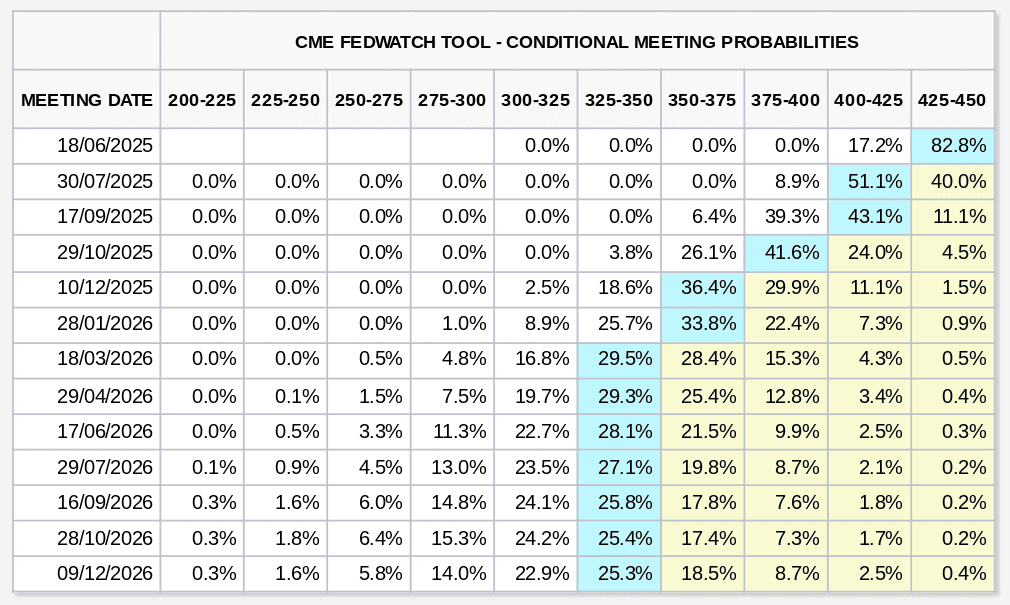
Current data from CME Group’s FedWatch Tool indicates a low probability of a rate cut in June, with the July meeting showing a slightly higher probability.
Supply Dynamics and Investor Sentiment
Over 98% of the Bitcoin supply is currently held in profit, a rare occurrence. This raises the question of whether investors will engage in “smart distribution” at current levels.
Historically, when Bitcoin’s supply in loss drops to between 0-2%, it often coincides with late-stage bull runs.
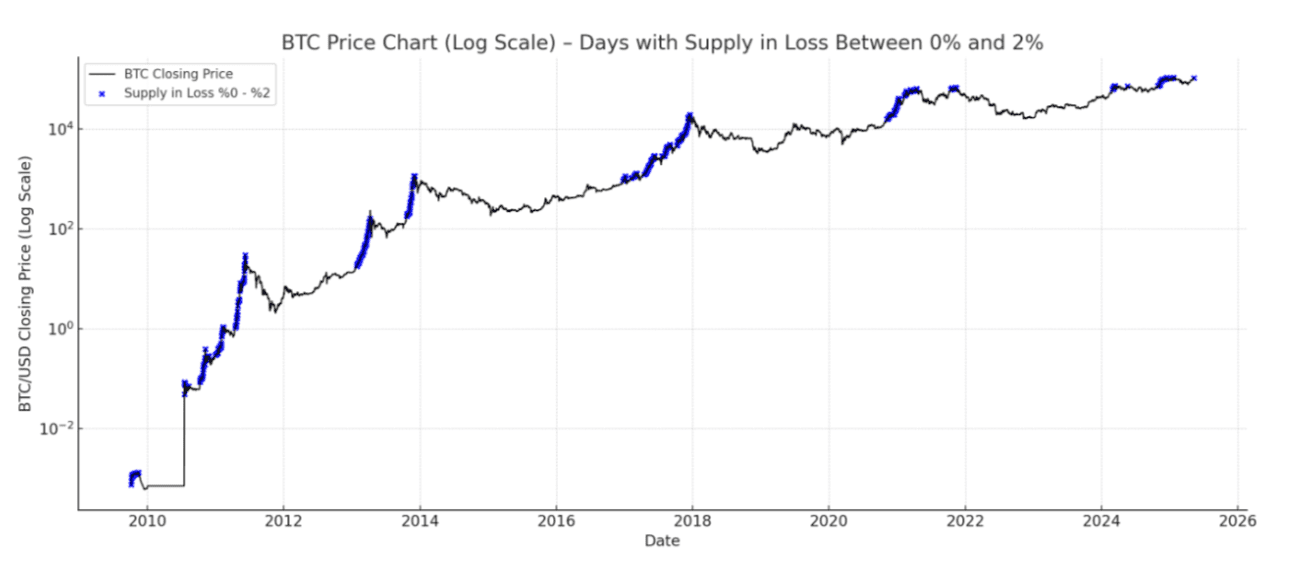
Long-term holders may view this as an opportunity to reduce their exposure, while newcomers may interpret this strength as a signal to enter the market.
Lack of Mainstream Interest
The market is currently less “greedy” at $104,000 than it was when Bitcoin traded lower, suggesting more sustainable price growth.
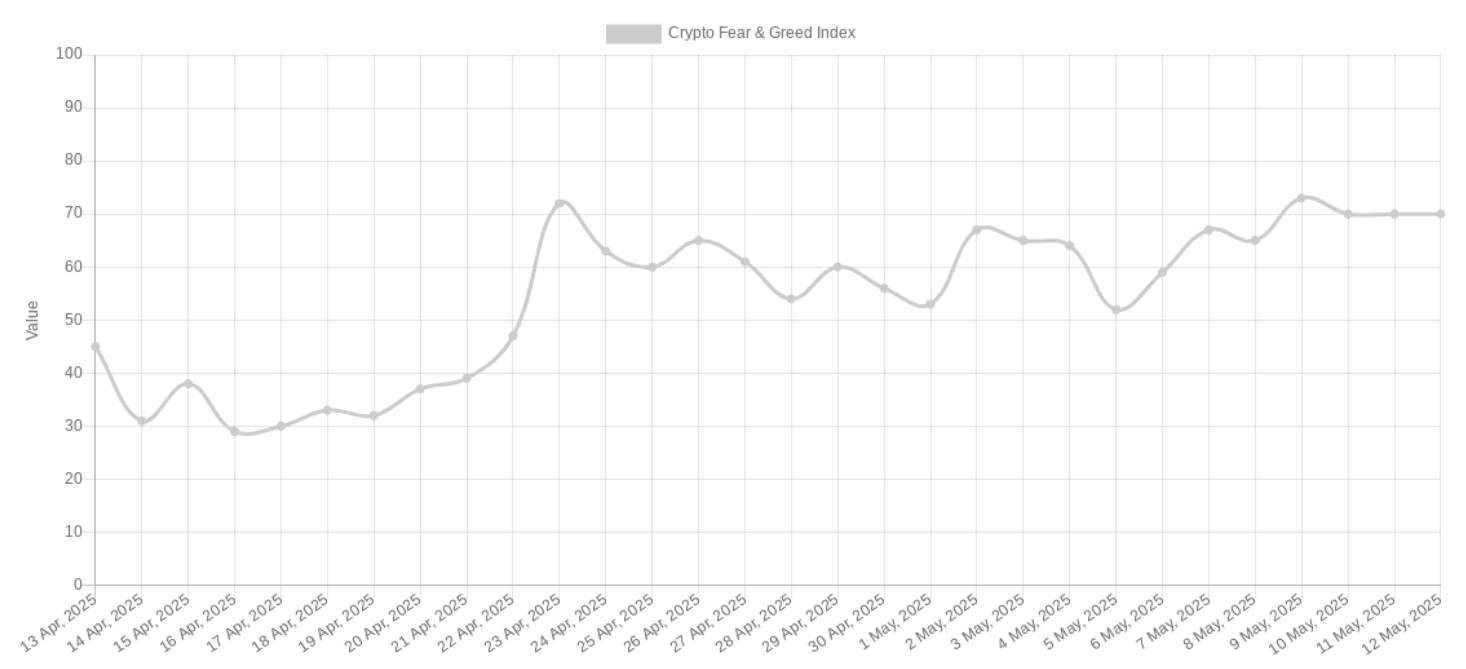
The Crypto Fear & Greed Index measured 70/100 on May 12, lower than the 72/100 recorded on April 23. This could potentially signal more sustainable price growth as investors resist the urge to act erratically.
Google Trends data also indicates that Bitcoin is not attracting significant mainstream retail interest.
Despite the price exceeding $100,000, Google searches for “Bitcoin” are near a 5-year low, suggesting retail investors have not yet fully re-entered the market since 2020.
This article does not contain investment advice or recommendations. Every investment and trading move involves risk, and readers should conduct their own research when making a decision.