XRP (Ripple) has recently shown strong upward momentum, prompting investors to consider its potential future price trajectory. This analysis delves into the factors driving XRP’s price, examining key technical indicators, liquidation levels, and chart patterns to provide insights into potential price targets.
Key Takeaways:
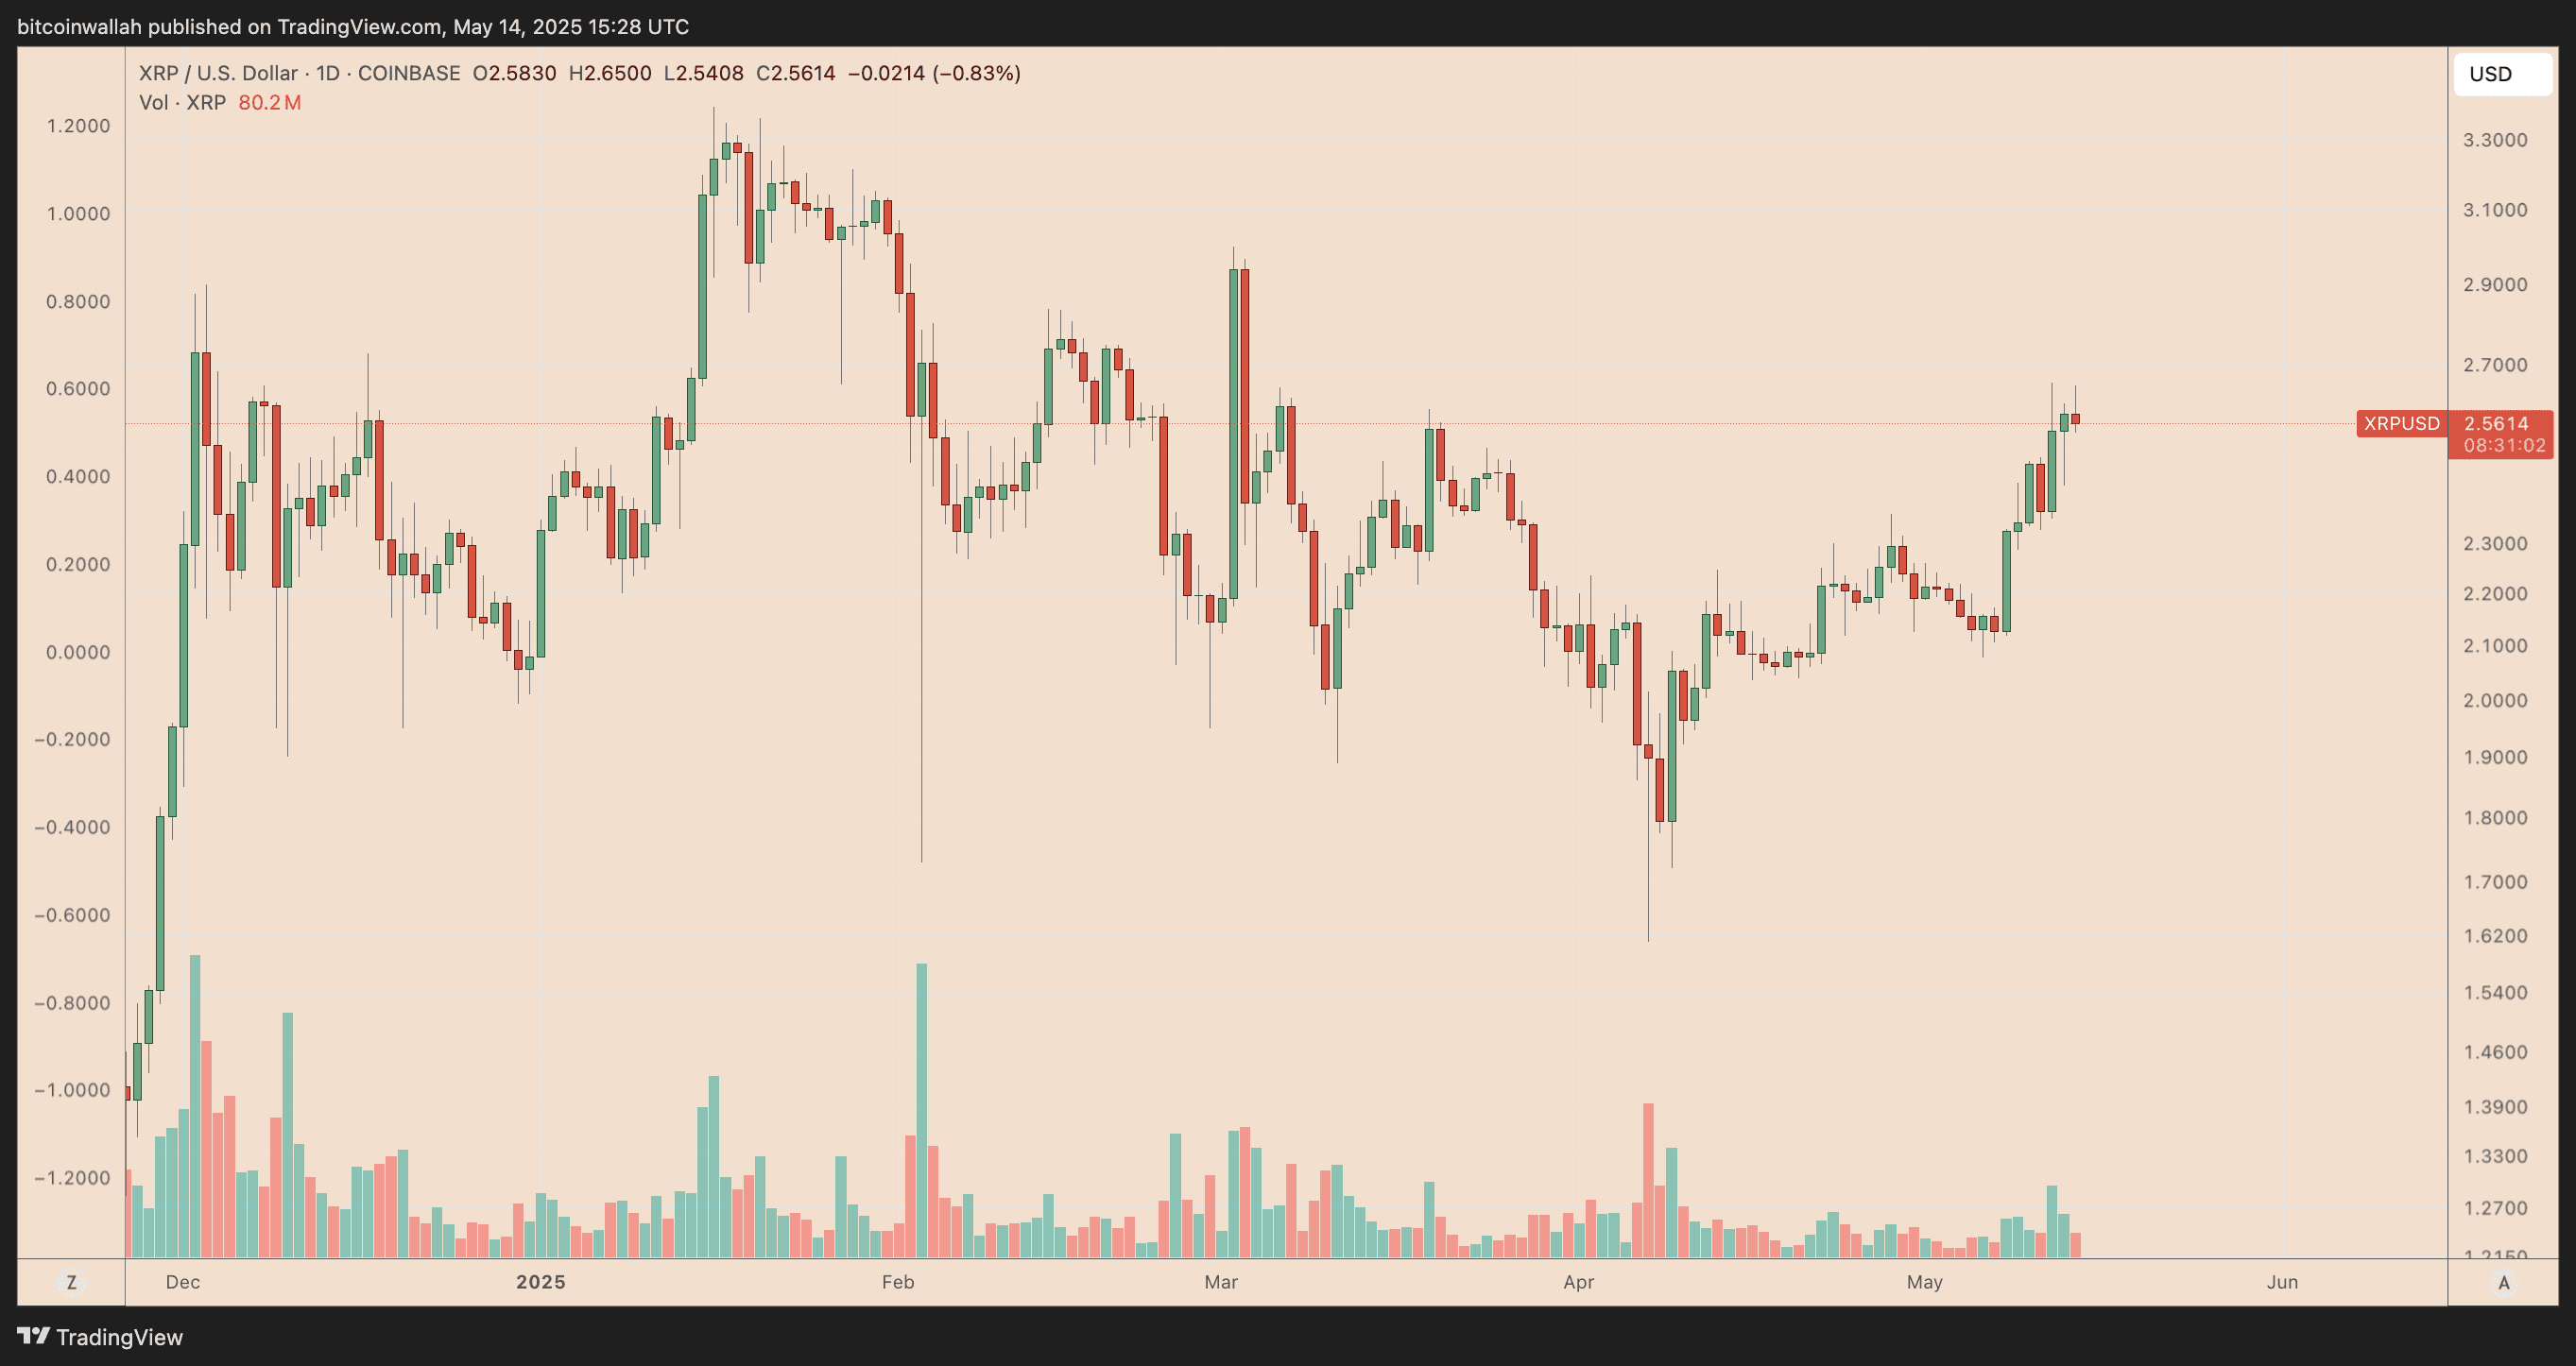
- Recent Surge: XRP has increased by 65% in a month, signaling strong bullish momentum.
- Technical Breakouts: Technical analysis suggests a potential 45% rally, targeting $3.69.
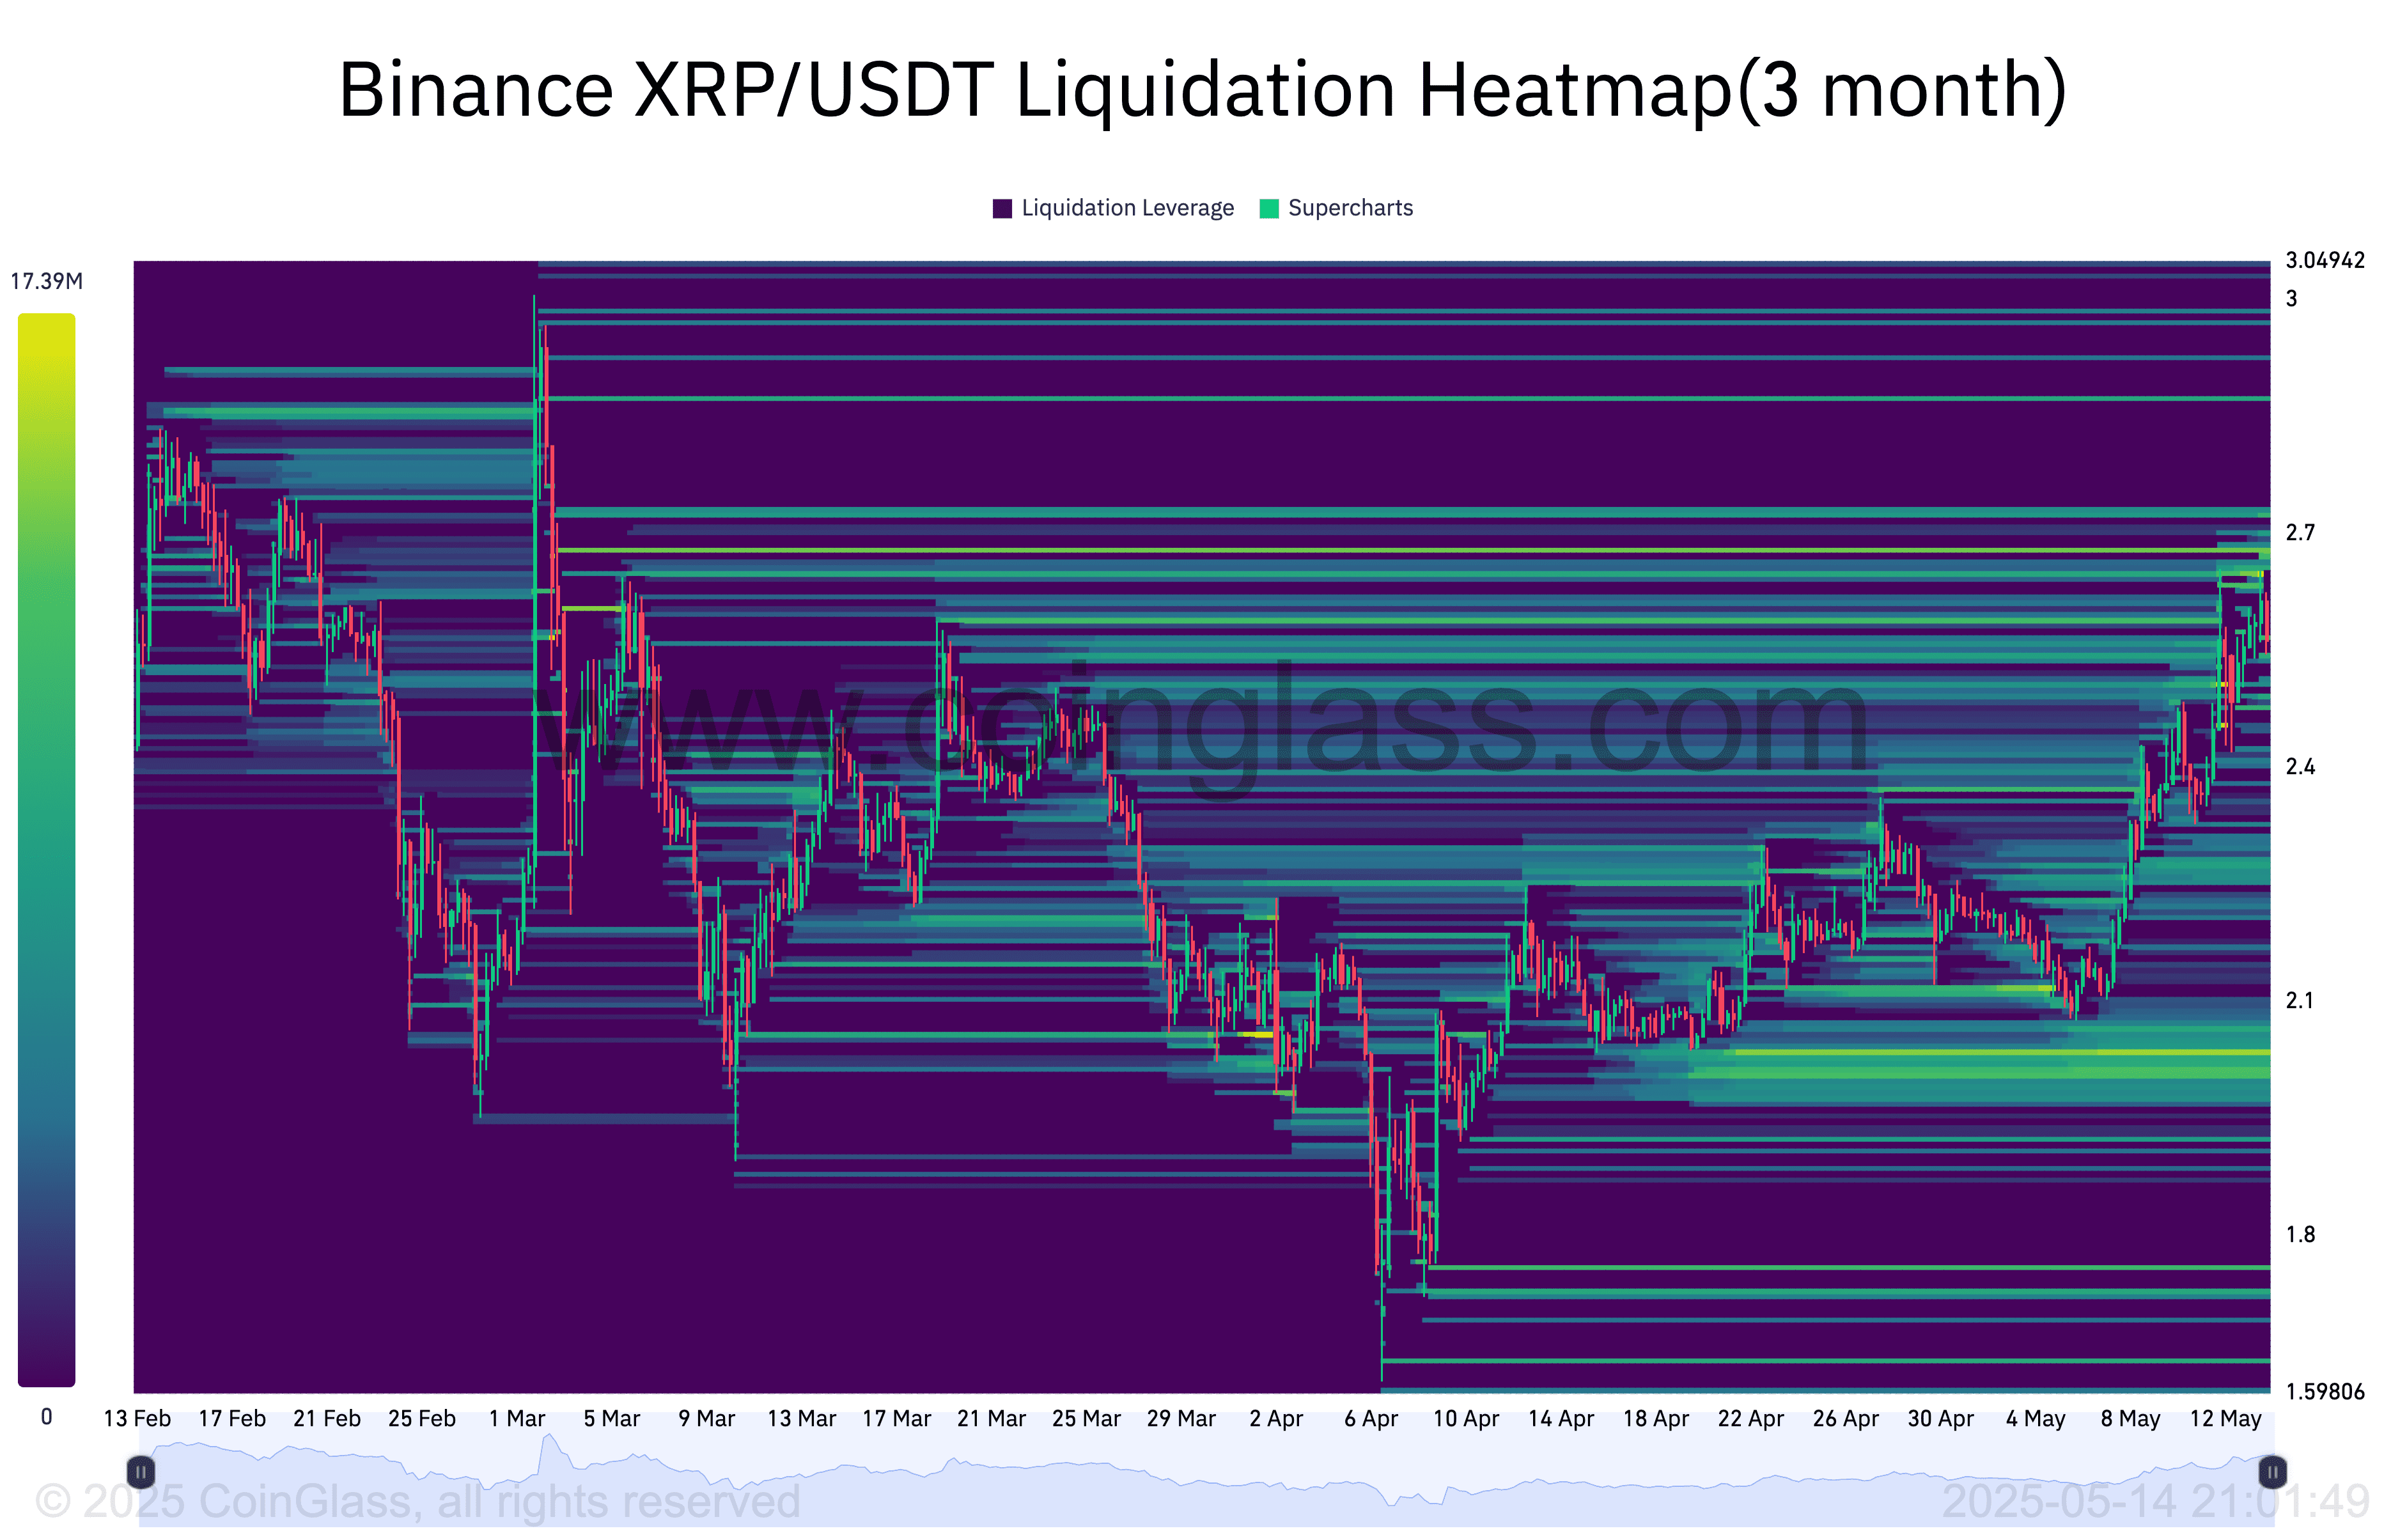
- Liquidation Levels: Liquidation heatmap reveals $2.68 as a key resistance; breaking above could lead to $2.87.
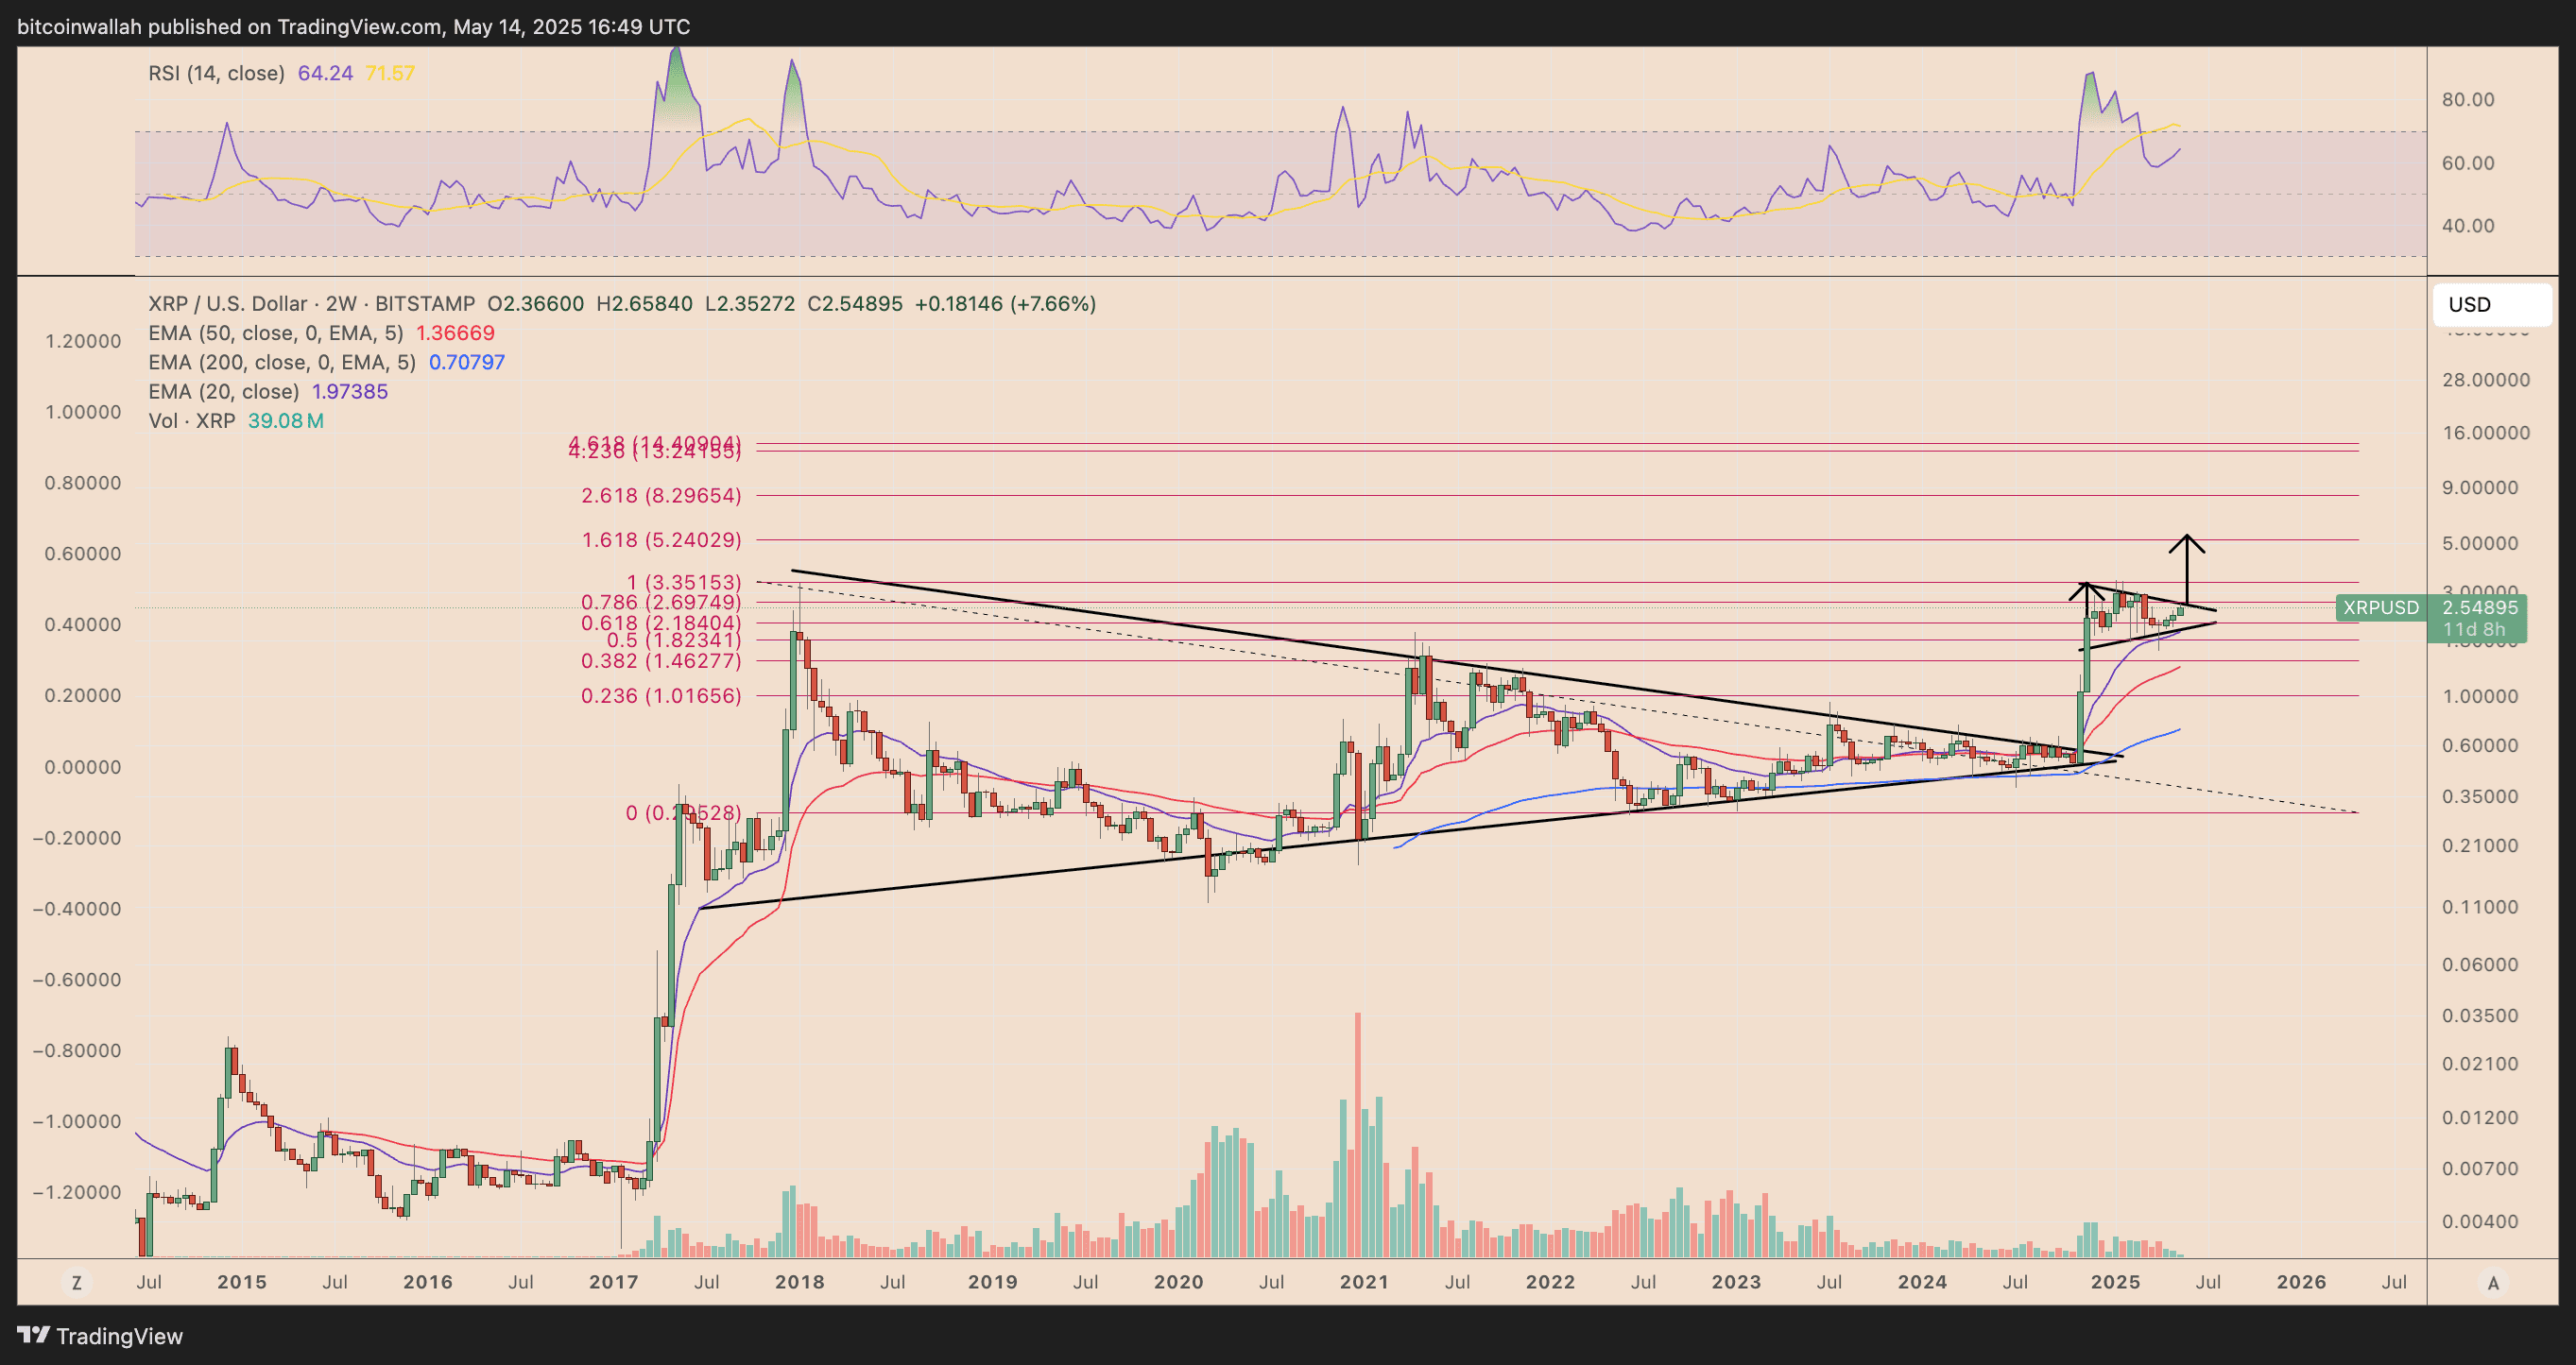
- Long-Term Targets: Symmetrical triangle patterns indicate potential targets of $5.24 and $17, based on Fibonacci projections.
Analyzing XRP’s Recent Performance
XRP’s recent rally, from a low of $1.61 to $2.65, has been attributed to several factors, including increased whale accumulation and easing trade tensions. These factors have contributed to positive market sentiment, driving demand for XRP.
Technical Analysis: Potential for a 45% Rally
XRP has broken out of a falling wedge pattern, a bullish indicator suggesting further upside. This breakout targets a potential price of $3.69 by June, representing a 45% increase from current levels.
The breakout is supported by XRP’s 20-3D and 50-3D exponential moving averages (EMAs), indicating strong bullish momentum. However, a failure to maintain support above the wedge’s upper trendline and these EMAs could invalidate the bullish outlook, leading to a potential decline towards $1.75.
Liquidation Heatmap: Identifying Key Resistance Levels
Liquidation heatmaps provide valuable insights into potential price movements by identifying areas where large liquidation events may occur. These levels often act as magnets, influencing price direction based on the liquidity concentration.
The Binance XRP/USDT liquidation heatmap highlights $2.68 as a significant resistance level, with approximately $17.33 million in potential liquidations. XRP recently tested this level, and a decisive break above it could trigger a short squeeze, potentially pushing the price towards the next major liquidity zone at $2.87.
Symmetrical Triangle Pattern: Long-Term Price Targets
XRP is forming a symmetrical triangle on the 2-week chart, which could signal a broader bullish trend in the coming months. Symmetrical triangle breakouts often lead to price increases equivalent to the pattern’s maximum height.
Applying this technical rule, XRP’s potential upside target is around $5.24, aligning with the 1.618 Fibonacci retracement level. Furthermore, analyzing a multi-year symmetrical triangle that began its breakout in November 2024 suggests an even higher target of over $17.
Factors Influencing XRP’s Price
Beyond technical analysis, various factors can influence XRP’s price, including:
- Regulatory Developments: Regulatory clarity surrounding cryptocurrencies, particularly XRP, can significantly impact investor sentiment.
- Adoption and Partnerships: Increased adoption of XRP by financial institutions and strategic partnerships can drive demand.
- Market Sentiment: Overall market sentiment towards cryptocurrencies and macroeconomic factors can influence XRP’s price.
Conclusion:
XRP’s recent surge and technical indicators suggest potential for further gains. While technical analysis provides valuable insights, it’s crucial to consider external factors and conduct thorough research before making any investment decisions. The potential targets outlined in this analysis should be viewed as possibilities rather than guarantees, as the cryptocurrency market remains volatile.
Disclaimer: This analysis is for informational purposes only and does not constitute financial advice. Cryptocurrency investments carry inherent risks, and individuals should conduct their own research and consult with a qualified financial advisor before investing.