Solana (SOL) is showing signs of a potential price rally, fueled by increased network activity and positive on-chain metrics. Recent technical analysis reveals a ‘megaphone’ chart pattern, suggesting a possible price target of $210. This analysis is supported by a significant increase in Solana’s realized capitalization and a high volume of transactions on the network.
Key Takeaways
- Megaphone Chart Pattern: Solana has formed a megaphone pattern on the 4-hour chart, indicating increasing volatility and a potential breakout.
- Price Target: A confirmed breakout above the $180 resistance level could propel SOL towards the pattern’s target of $210.
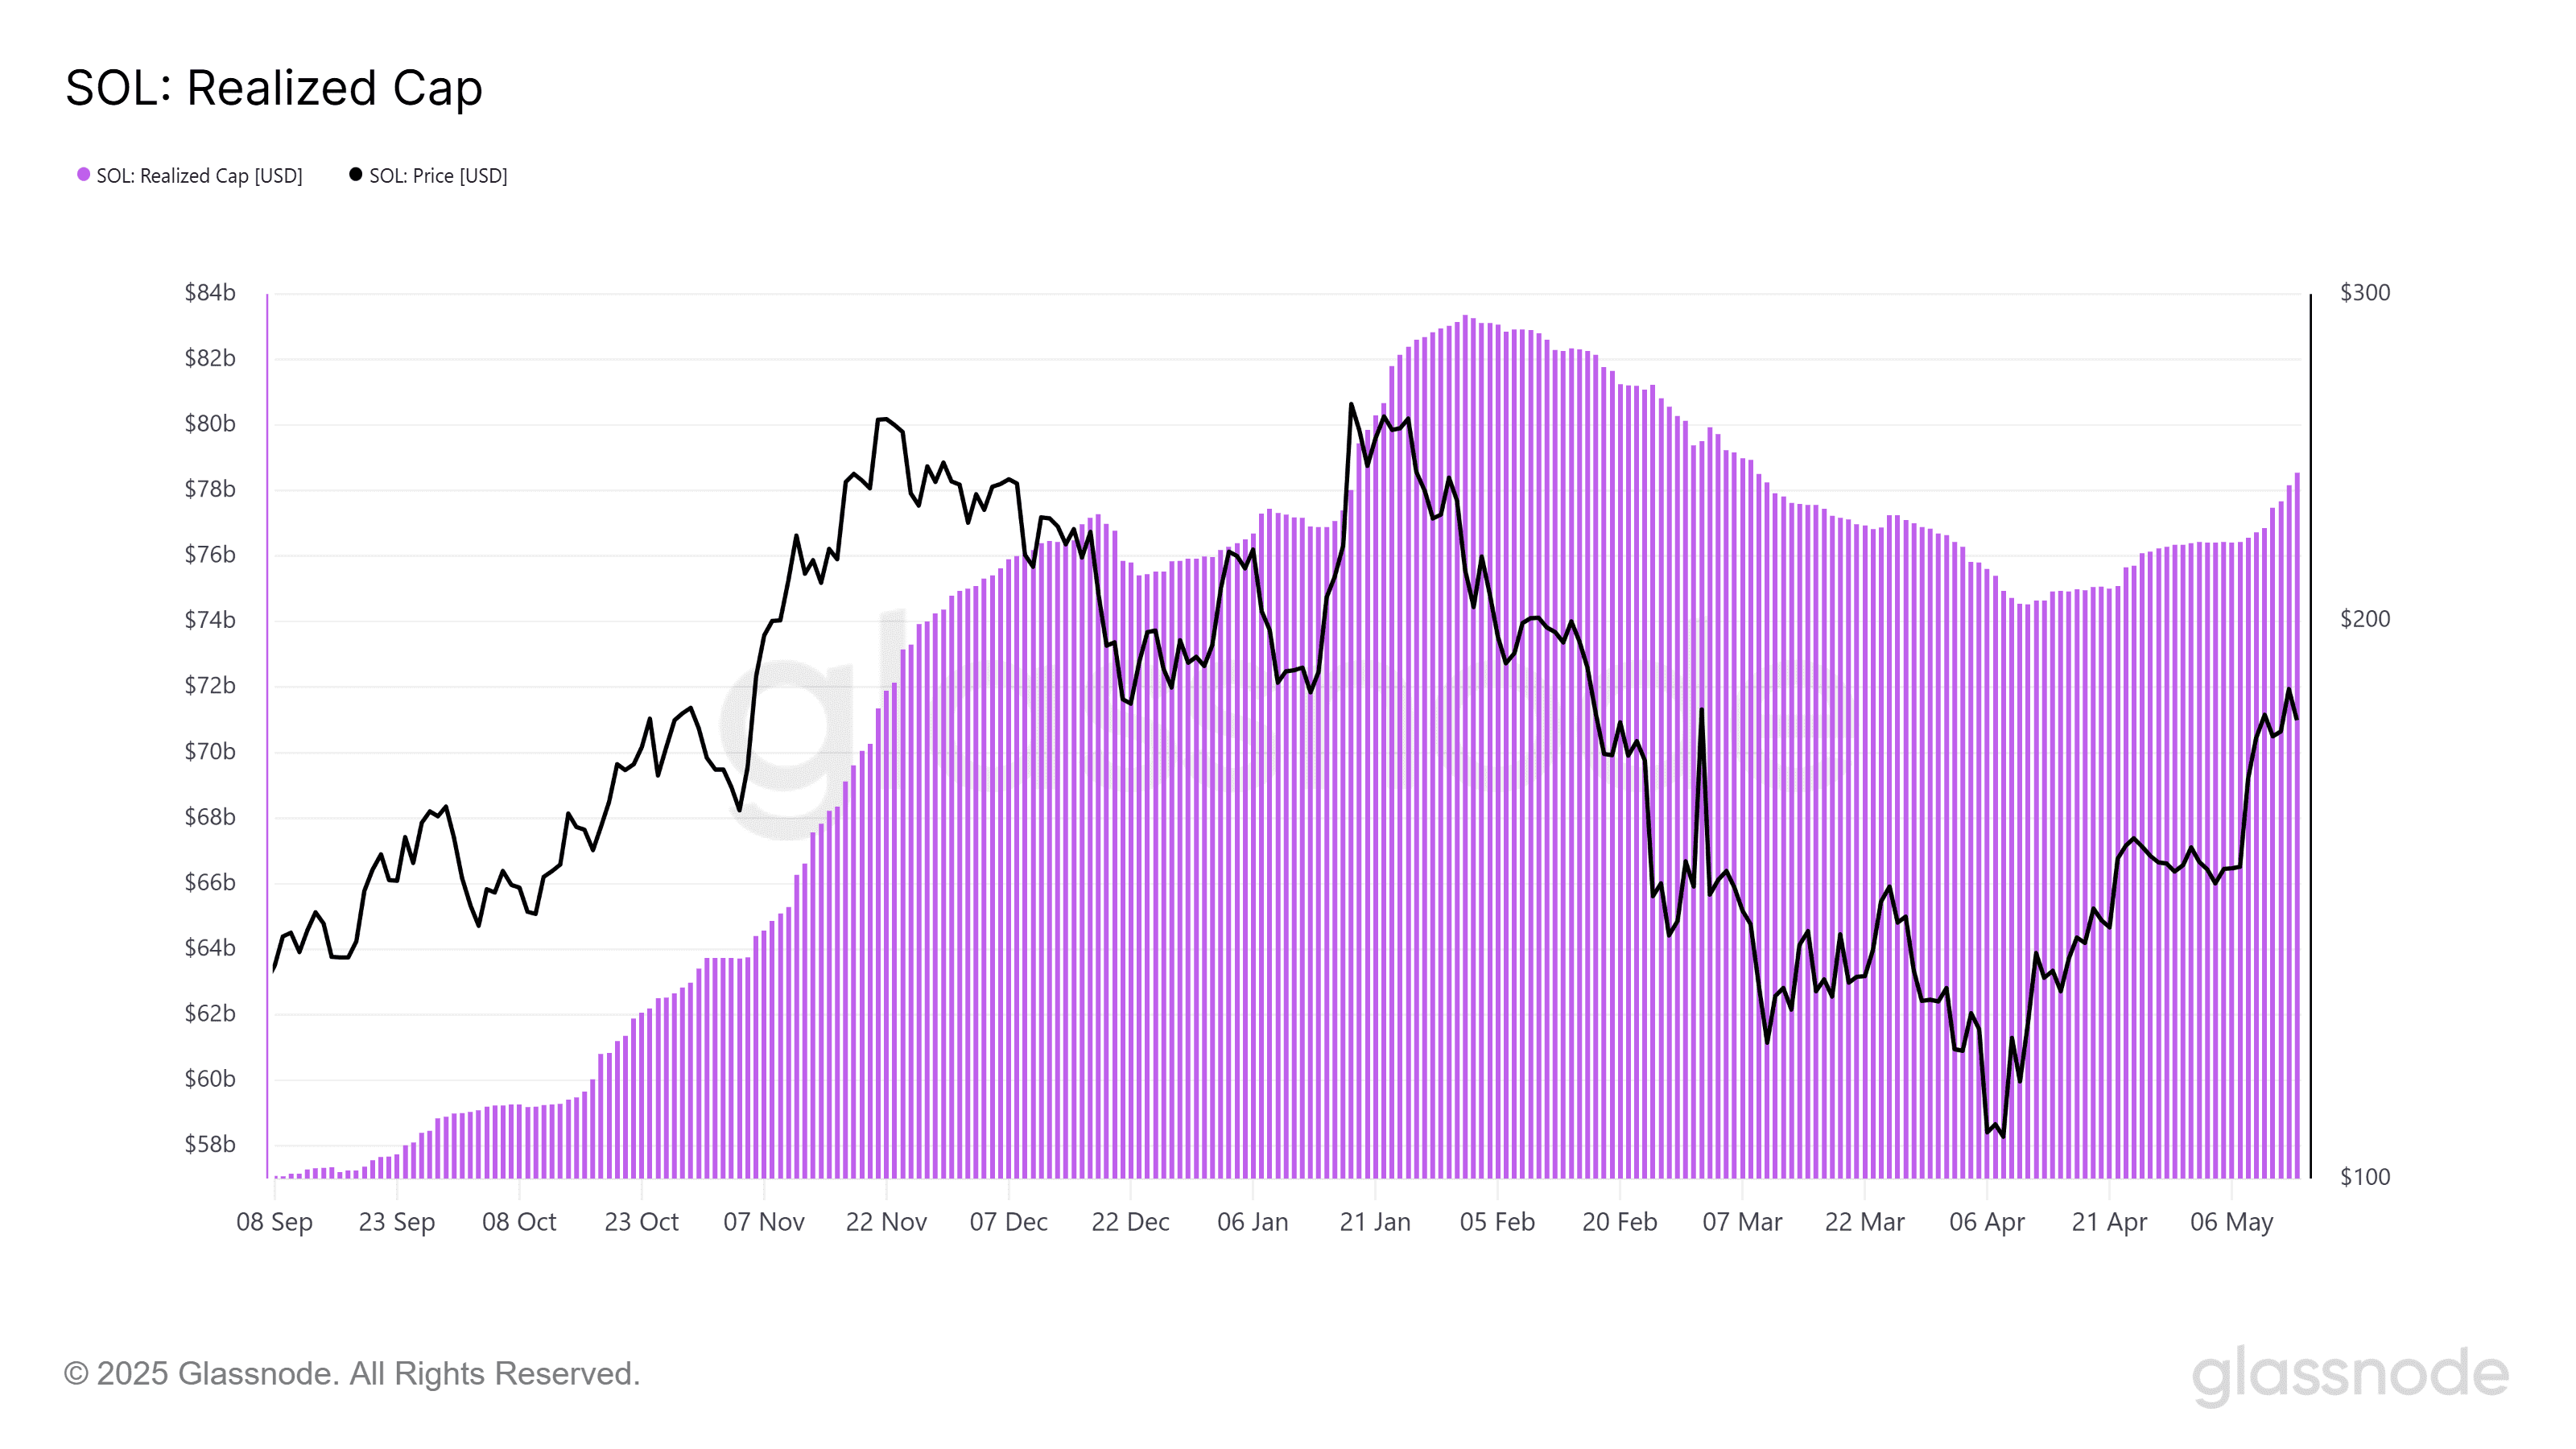
- Realized Cap Growth: Solana’s realized capitalization has increased by $4 billion, reflecting renewed investor interest.
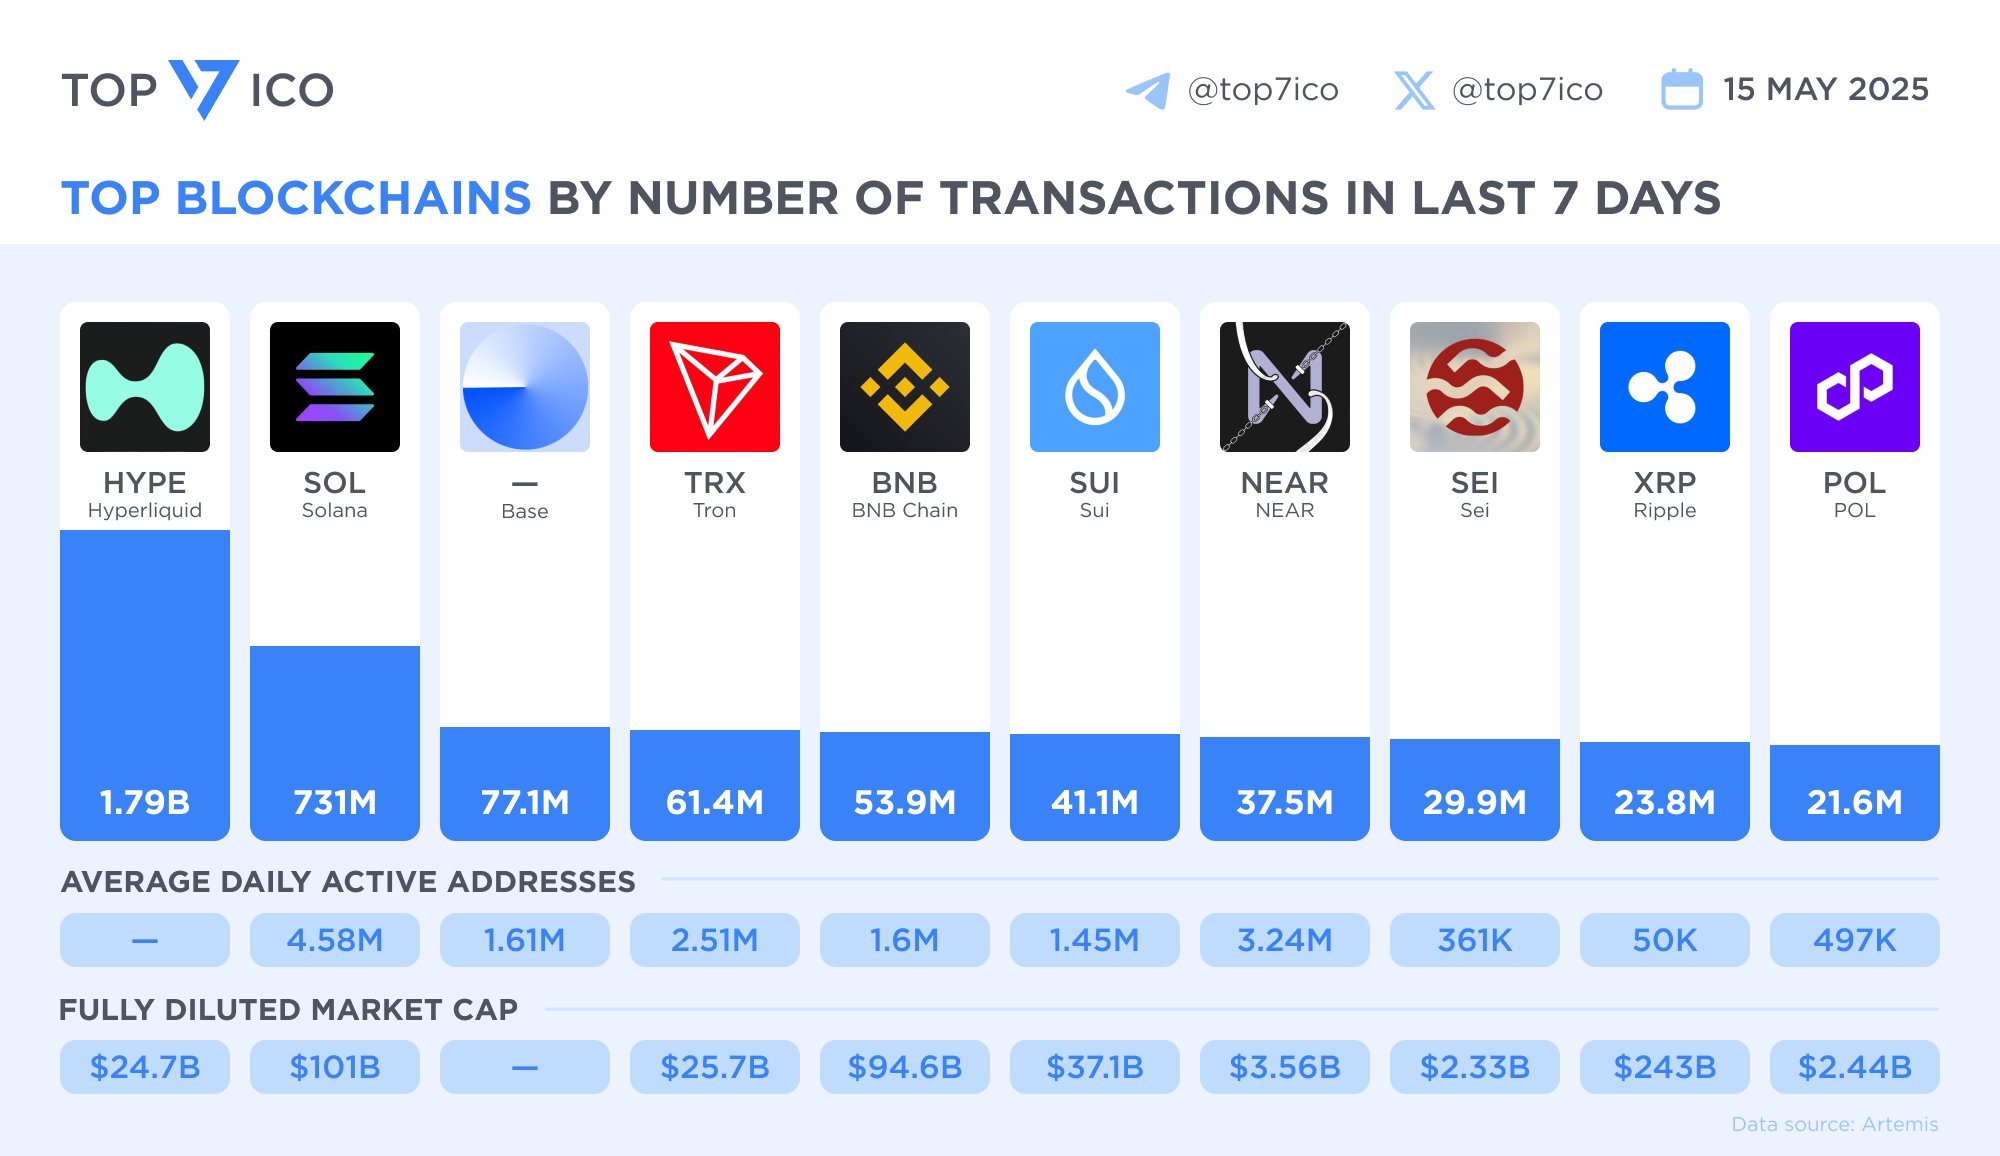
- Transaction Volume: Solana processed an impressive 731 million transactions in the past week, highlighting its network activity.
Technical Analysis: The Megaphone Pattern
The ‘megaphone’ pattern is a technical analysis formation characterized by widening price swings, creating a cone-like shape on the chart. This pattern often signals increasing market uncertainty and volatility. In Solana’s case, the megaphone pattern suggests that price swings could become more pronounced, potentially leading to a significant breakout.
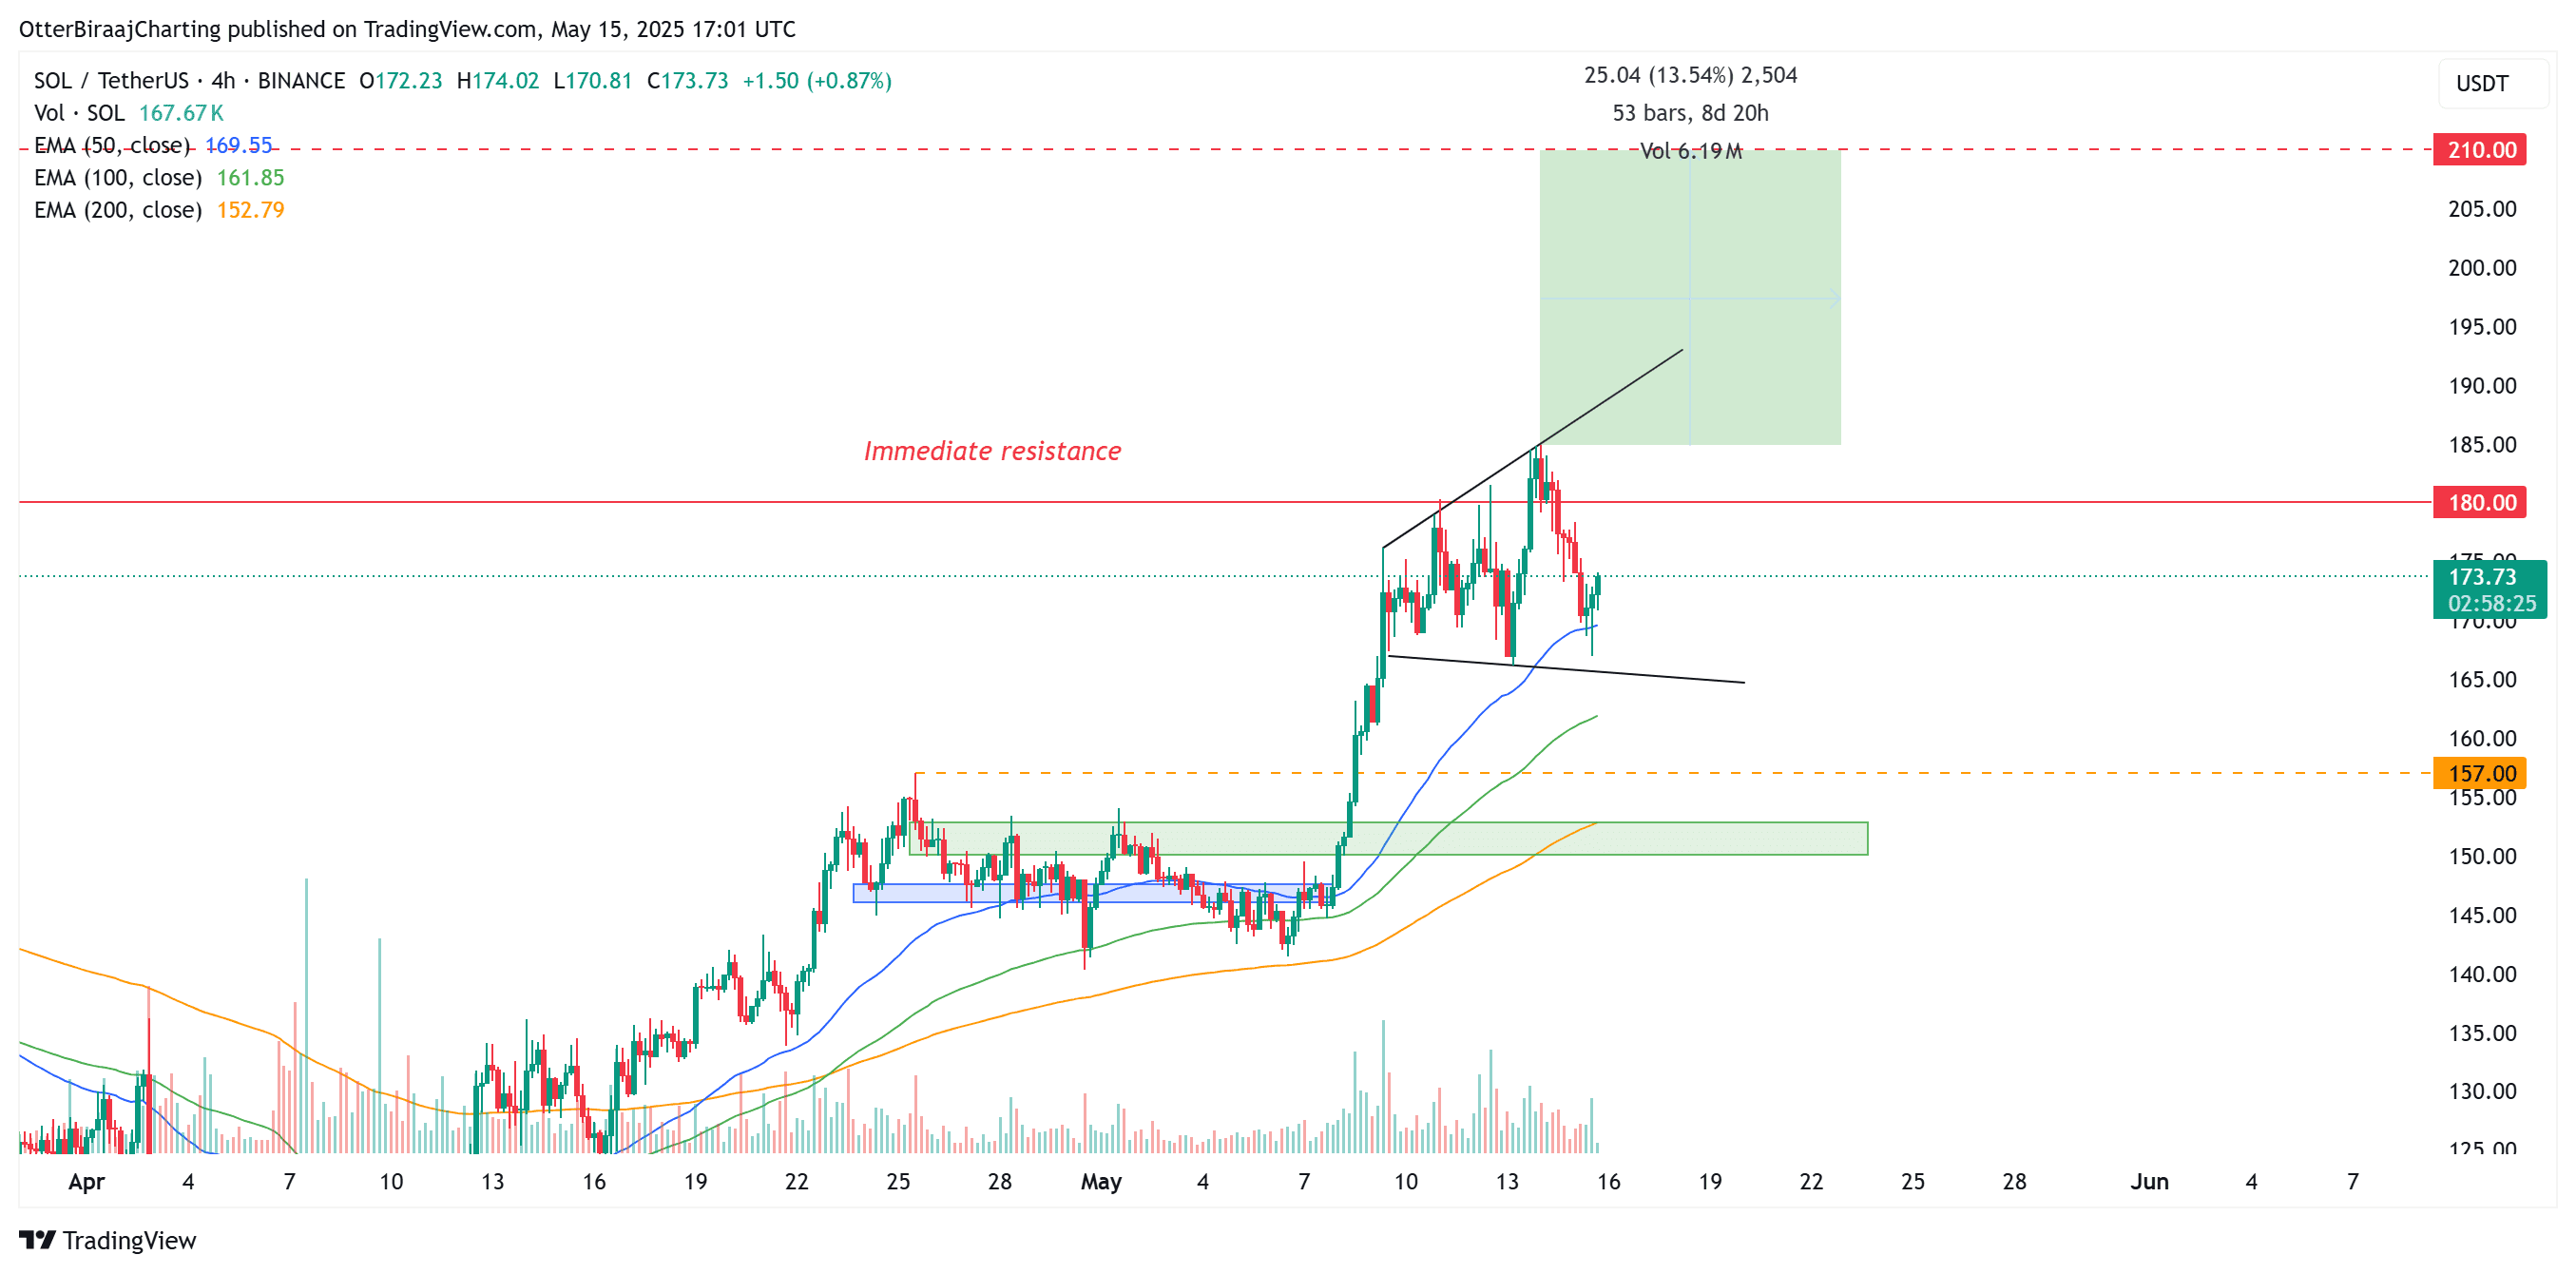
Currently, Solana is testing key resistance at $180. A successful break above this level, confirmed by strong trading volume, could trigger the upward movement towards the $210 target. This target is calculated by measuring the widest part of the megaphone pattern and projecting it upwards from the breakout point.
However, traders should be aware that the megaphone pattern can also be bearish. Failure to break above $180 could lead to a pullback towards the 100-day exponential moving average (EMA) at $161 or the pattern’s lower support near $150. Volume confirmation is crucial; low volume could indicate a false breakout, leading to a reversal.
On-Chain Metrics: Supporting the Bullish Case
Beyond the technical analysis, Solana’s on-chain metrics paint a positive picture. Glassnode has reported a 4% to 5% rise in 30-day capital inflows, signaling renewed demand for SOL. The realized cap, which reflects the last transacted value of coins, has increased by $4 billion to $78.5 billion on May 14, further demonstrating Solana’s growing momentum.
Solana’s strong performance is further validated by its high transaction volume. Over the past week, Solana processed 731 million transactions, trailing only Hyperliquid. This significantly outperforms other blockchains like Base, highlighting Solana’s existing advantage and popularity.
Factors Driving Solana’s Growth
Several factors contribute to Solana’s recent growth:
- Growing DeFi Ecosystem: Solana’s decentralized finance (DeFi) ecosystem has been expanding rapidly, attracting new users and capital.
- Scalability and Speed: Solana’s high transaction throughput and low fees make it an attractive platform for developers and users.
- NFT Market Activity: Solana has also seen significant activity in the non-fungible token (NFT) market, further boosting its network activity.
- Innovative Projects: Continued development and launch of innovative projects on the Solana blockchain continue to draw users and attention.
Conclusion
Solana’s technical indicators and on-chain metrics suggest a potential price rally towards $210. The ‘megaphone’ chart pattern, combined with increased realized capitalization and high transaction volume, indicates strong bullish momentum. However, traders should exercise caution and monitor volume confirmation when considering a breakout above the $180 resistance level. Keep in mind that cryptocurrency investments come with risk; it’s advisable to conduct your own research before investing.