Key Points:
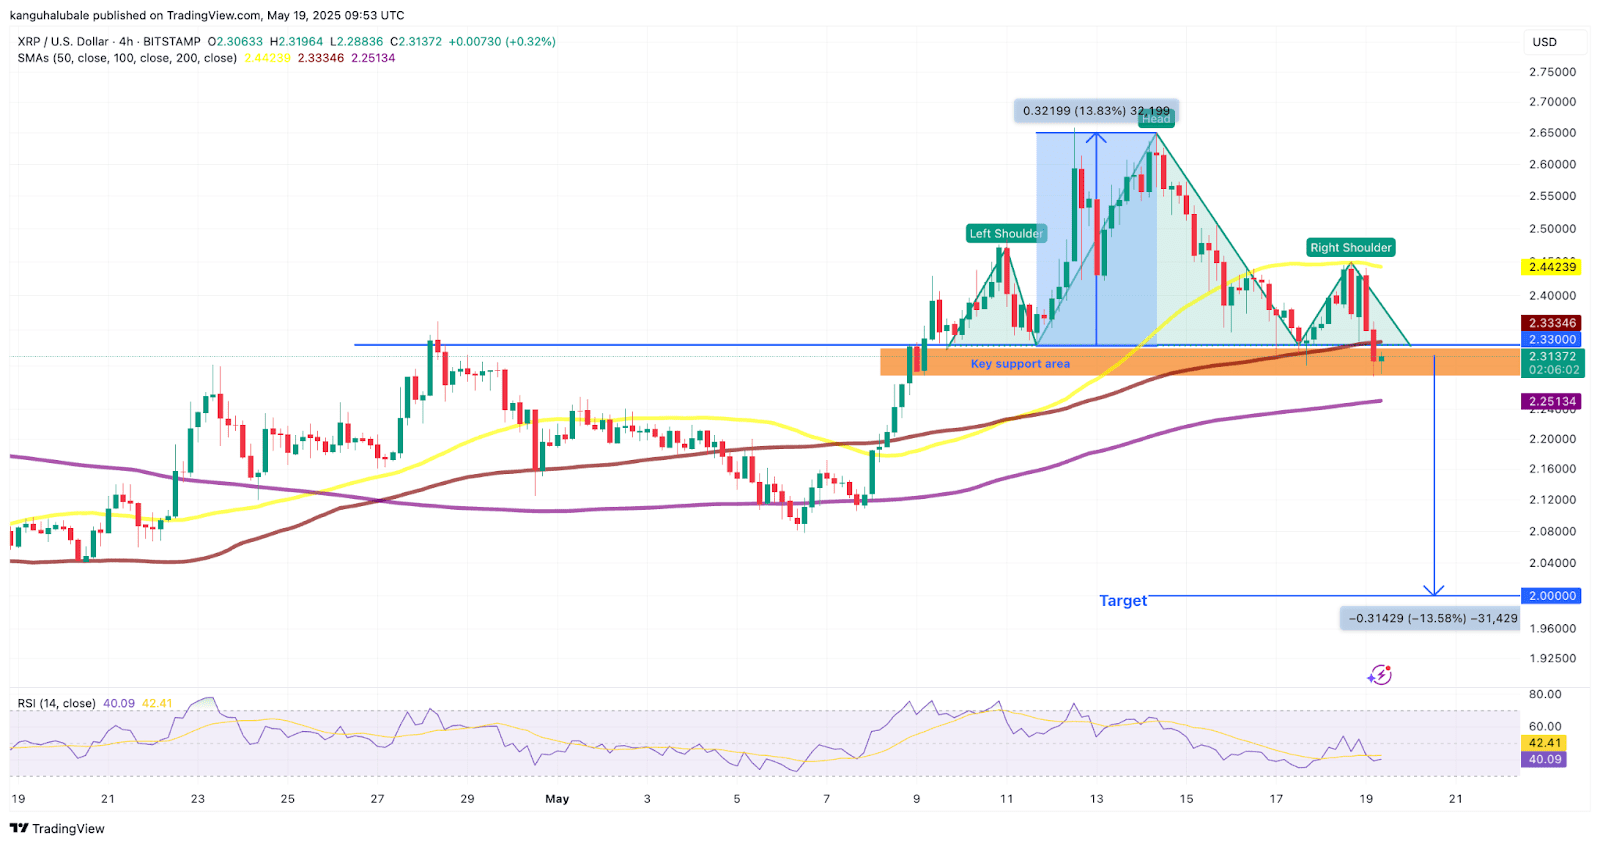
- XRP’s price is exhibiting a head and shoulders (H&S) pattern, a bearish indicator suggesting a potential downward trend.
- The H&S pattern suggests a possible price target of $2.00 if the downward trend continues.
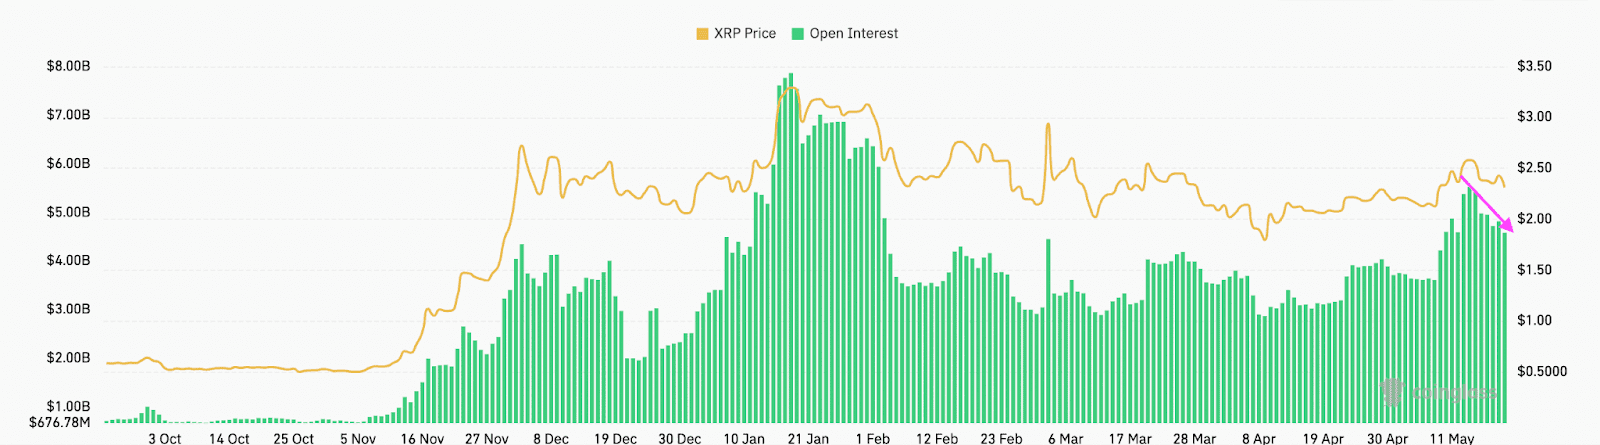
- Declining open interest in XRP futures signals weakening trader confidence, contributing to the bearish outlook.
XRP (Ripple) is currently facing downward pressure, with technical analysis pointing to a potential price drop to around $2. This analysis considers the formation of a head and shoulders pattern, a decline in open interest, and key support levels to watch.
Head and Shoulders Pattern: A Bearish Signal
The head and shoulders (H&S) pattern is a classic technical analysis formation that often indicates a trend reversal from bullish to bearish. It’s characterized by three peaks: a higher peak (the head) flanked by two lower peaks (the shoulders). The ‘neckline’ connects the lows between the shoulders. A break below the neckline typically confirms the pattern and signals a potential price decline.
In XRP’s case, an H&S pattern has formed on the four-hour chart, with the neckline around $2.33. The price broke below this neckline, validating the pattern and suggesting a potential move lower.
Potential Price Target: If the price remains below the neckline, the H&S pattern projects a potential price target of $2.00. This is calculated by measuring the distance between the head and the neckline and then subtracting that distance from the neckline breakout point.
Declining Open Interest: Weakening Trader Confidence
Open interest (OI) represents the total number of outstanding futures contracts for an asset. A decline in OI suggests that fewer traders are holding positions, indicating weakening confidence and liquidity. In the case of XRP, the open interest has decreased, signaling a potential lack of strong buying support.
Impact on Price: A decline in open interest often accompanies a price decrease, as it suggests that traders are closing positions and reducing their exposure to the asset. This can further exacerbate the downward pressure on the price.
Key Support Levels to Watch
While the H&S pattern suggests a potential drop to $2.00, there are key support levels that could provide some buffer. These levels include:
- $2.25: The 200-day simple moving average (SMA) currently sits around $2.25 and could act as a level of support.
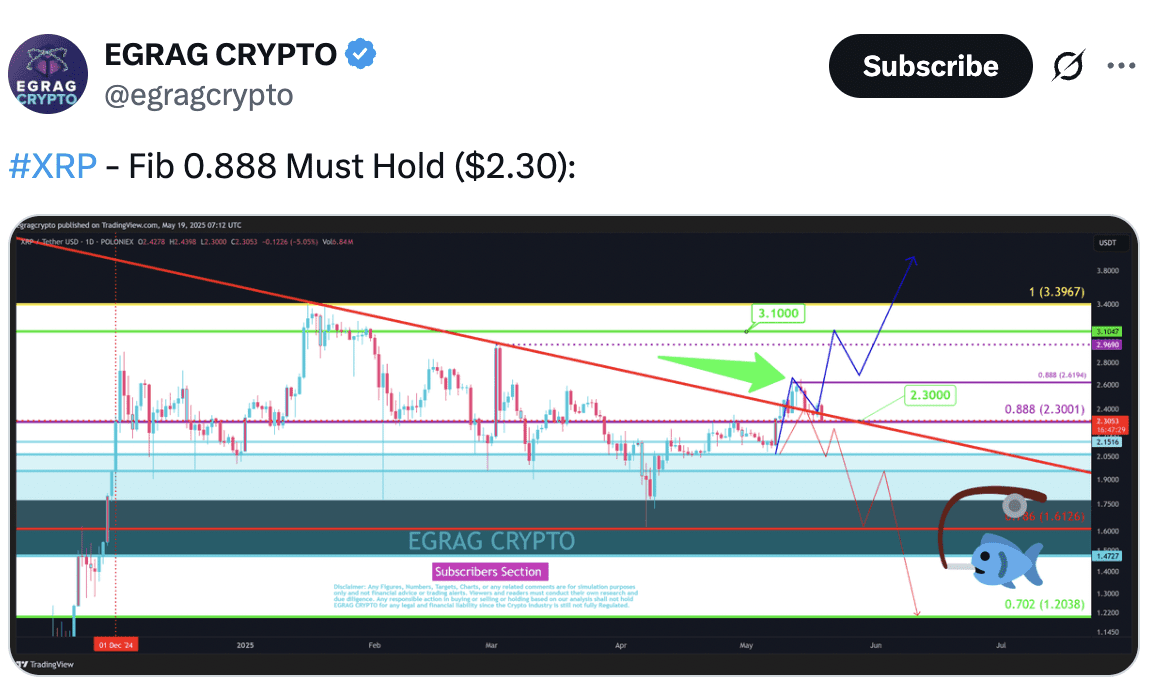
- $2.15: According to analyst Egrag Crypto, $2.15 could be an initial support level if the price breaks below $2.30.
- $2.00: The target of the head and shoulders pattern and a key psychological support level.
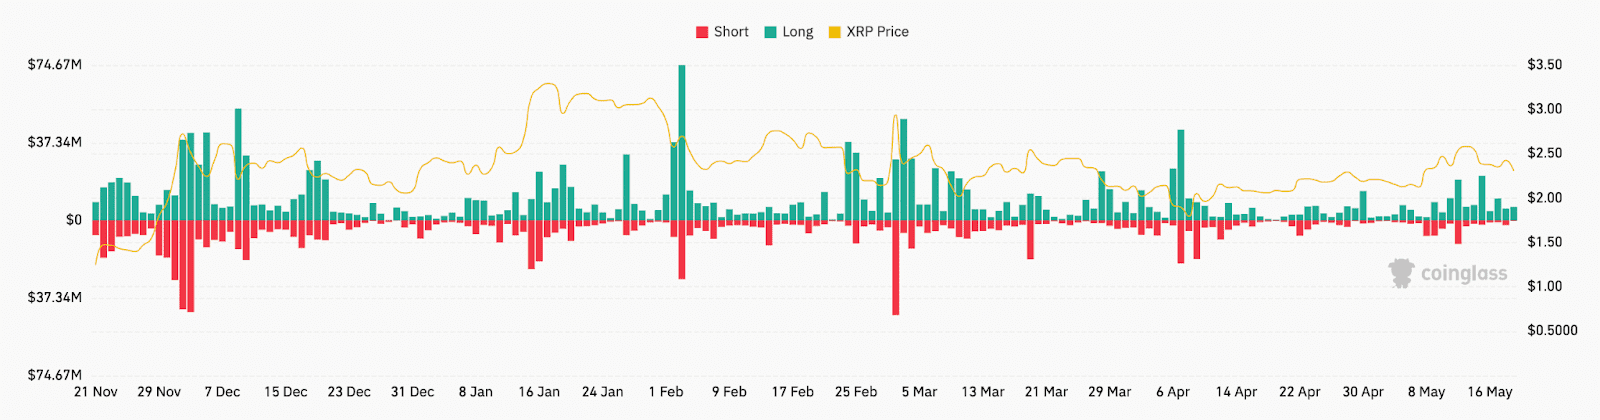
XRP Liquidations and Trading Volume
Recent data shows a significant number of long positions in XRP being liquidated, indicating increased selling pressure and potential further price decline. Concurrently, the trading volume has surged alongside the price drop, suggesting intensified bearish momentum as traders reposition themselves in anticipation of XRP’s next movement.
Analyst Perspectives: Popular analyst Egrag Crypto emphasizes the importance of XRP holding the $2.30 support level to avoid a significant breakdown. However, a breach of this level could trigger a sell-off, potentially leading to further declines.
Conclusion
XRP is currently exhibiting bearish signals, primarily due to the completion of a head and shoulders pattern and declining open interest. While key support levels may provide some stability, the overall outlook suggests a potential price decline to around $2.00. Traders should monitor these levels closely and exercise caution.
Disclaimer: This analysis is for informational purposes only and should not be considered financial advice. Cryptocurrency trading involves risk, and you should conduct your own research before making any investment decisions.