Key Points:
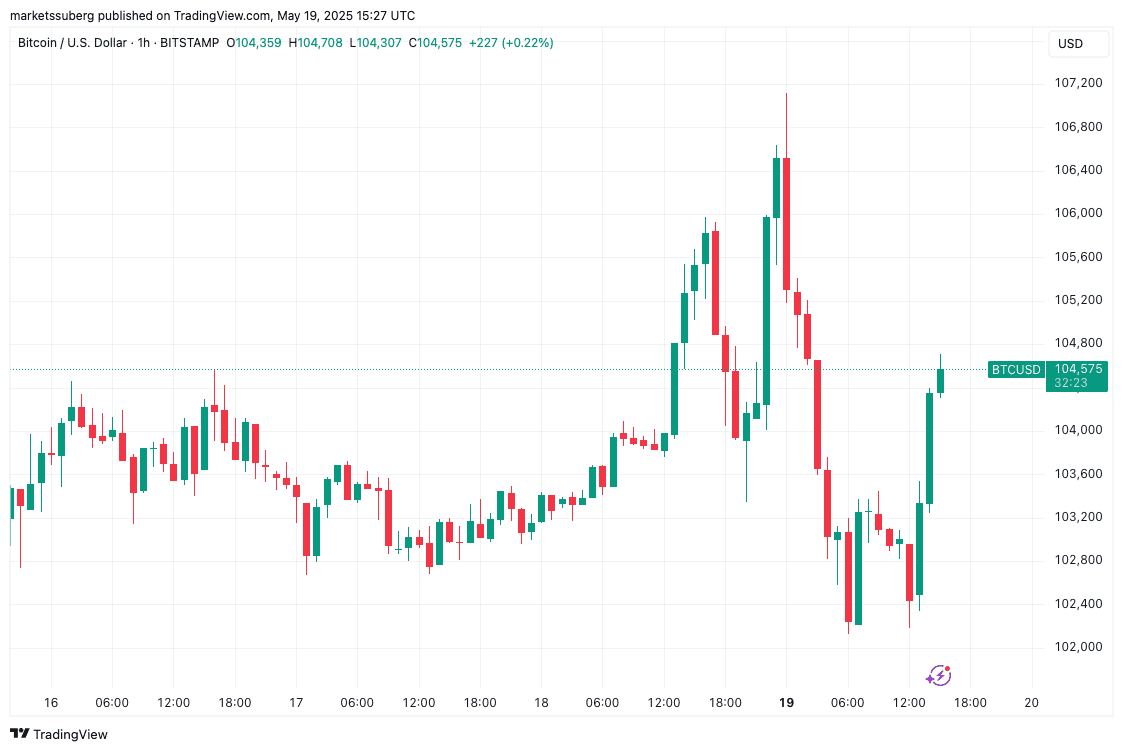
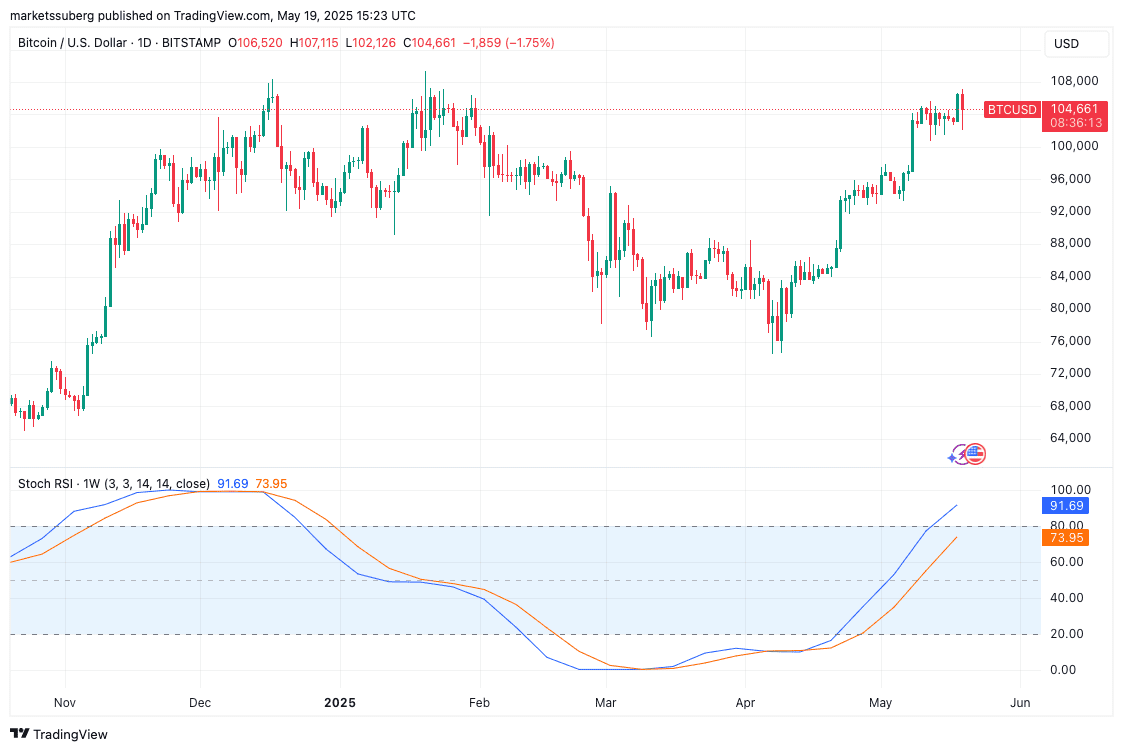
- BTC price rebounded to around $104,500 after a dip, but volatility persists.
- Traders are split on whether Bitcoin is nearing the end of its bull market or poised for new all-time highs.
- Key levels to watch include $102,000, $106,000, and $106,600.
Bitcoin (BTC) is experiencing a period of uncertainty, with price fluctuations leading to diverse opinions among traders. After a recent dip, BTC rebounded to around $104,500, but the overall direction remains unclear.
Key Price Levels to Watch
Several key price levels are attracting attention from traders and analysts:
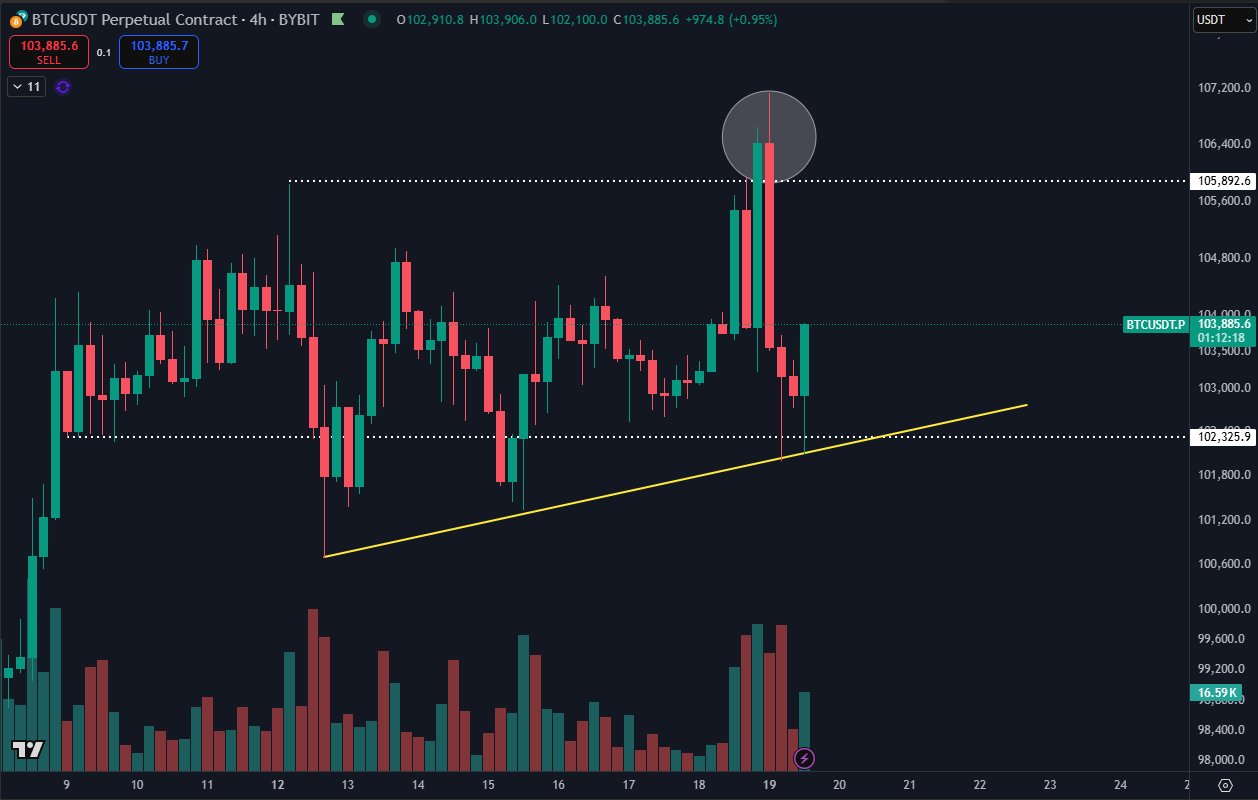
- $102,000: Identified as the local range low.
- $106,000: Considered the local range high and a level of significant resistance.
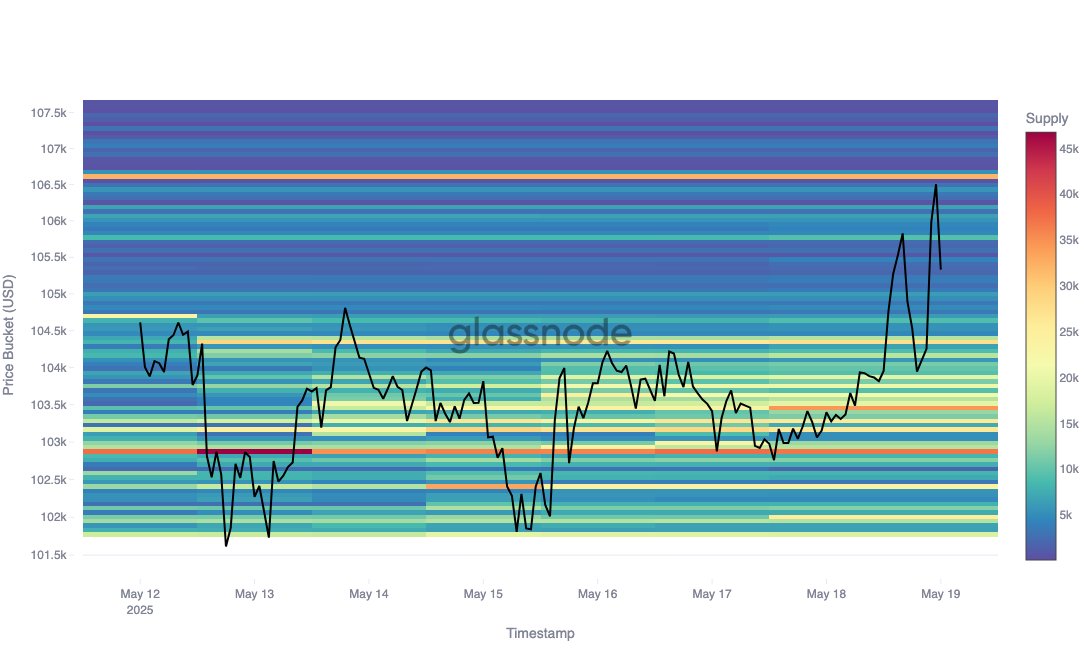
- $106,600: A level where a substantial amount of BTC is held, creating a potential resistance point. Glassnode noted that 31K BTC were held at this cost basis.
Analyst Perspectives
Market participants hold varying beliefs regarding the future of Bitcoin’s price.
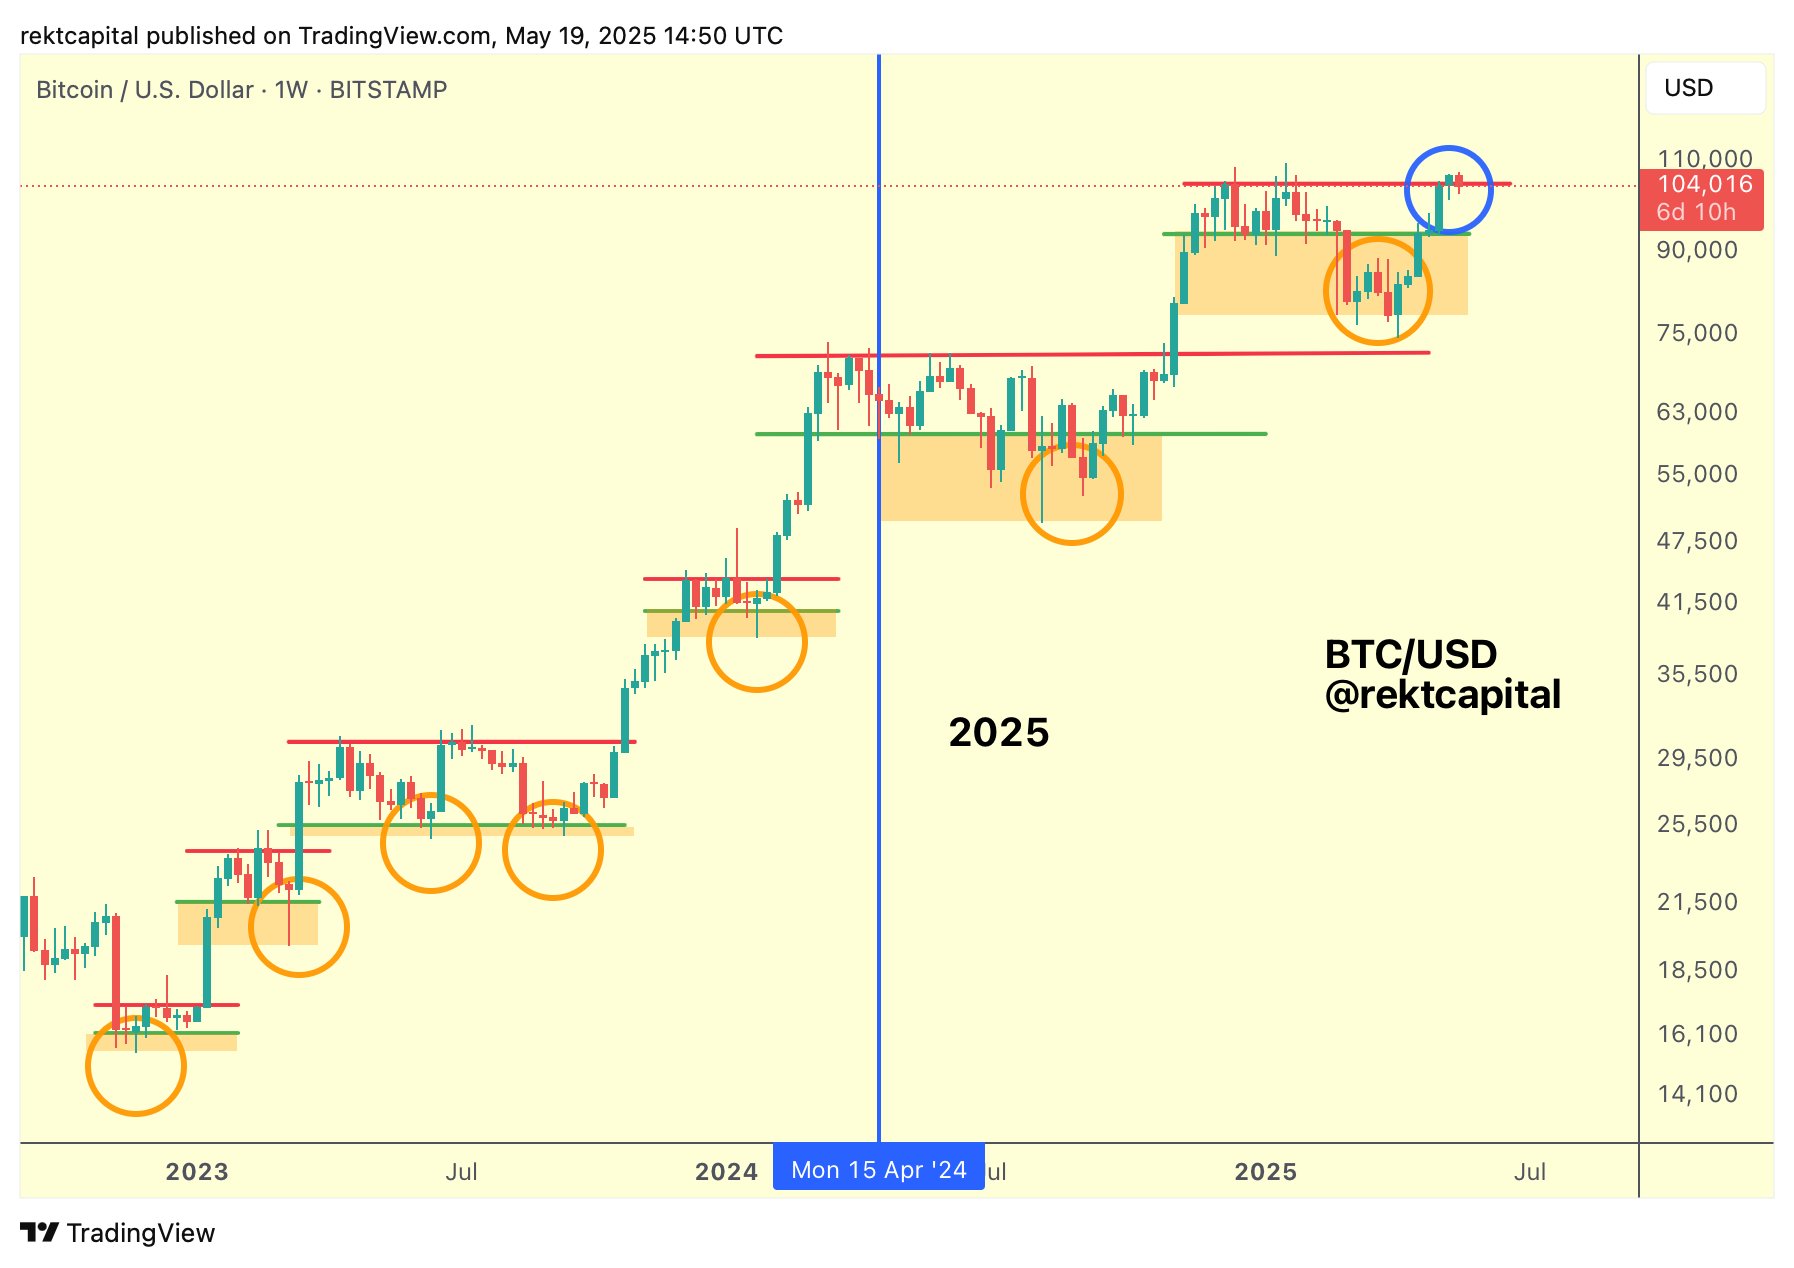
- Rekt Capital: Expressed optimism, suggesting that holding ~$104,400 as support is crucial for a post-breakout retest.
- Daan Crypto Trades: Highlighted $102,000 and $106,000 as key levels to monitor for potential breakouts or breakdowns.
- Glassnode: Pointed out the $106,600 level as a significant resistance due to the concentration of BTC holdings at that price.
- Roman: Warned of bearish signals, including resistance rejection, bearish divergences, and low volume, suggesting the bull run might be nearing its end.
Bearish Indicators
Roman emphasized several bearish indicators on the weekly timeframe:
- Rejection at resistance levels.
- Bearish divergences.
- Low trading volume during price pumps.
- Overbought stochastic RSI.
Potential Price Targets
Despite the bearish signals, some analysts have suggested potential upward price targets, while others anticipate a retracement:
- $116,000: A short-term target suggested by some traders.
- $90,000: A potential retracement level to watch.
Conclusion
Bitcoin’s current price action is characterized by volatility and uncertainty. Traders should closely monitor the key levels outlined above and consider the diverse perspectives of analysts to make informed decisions. Whether the bull market continues to new all-time highs or corrects downwards remains to be seen.
Disclaimer: This article does not contain investment advice or recommendations. Every investment and trading move involves risk, and readers should conduct their own research when making a decision.