Key Takeaways:
- Identifying Bitcoin market cycle tops is challenging, but technical and behavioral indicators can provide valuable insights.
- Indicators like the MVRV-Z Score, Pi Cycle Top, trade volume analysis, Puell Multiple, and exchange inflows have historically been reliable in predicting Bitcoin price peaks.
Bitcoin (BTC) market cycles typically conclude with a dramatic final rally followed by a sharp correction and a bear market. Recognizing potential cycle tops is crucial for traders and investors aiming to maximize profits and avoid significant losses.
Understanding Bitcoin Cycle Top Indicators
Several technical and on-chain indicators have proven useful in signaling when Bitcoin approaches its peak. These include:
-
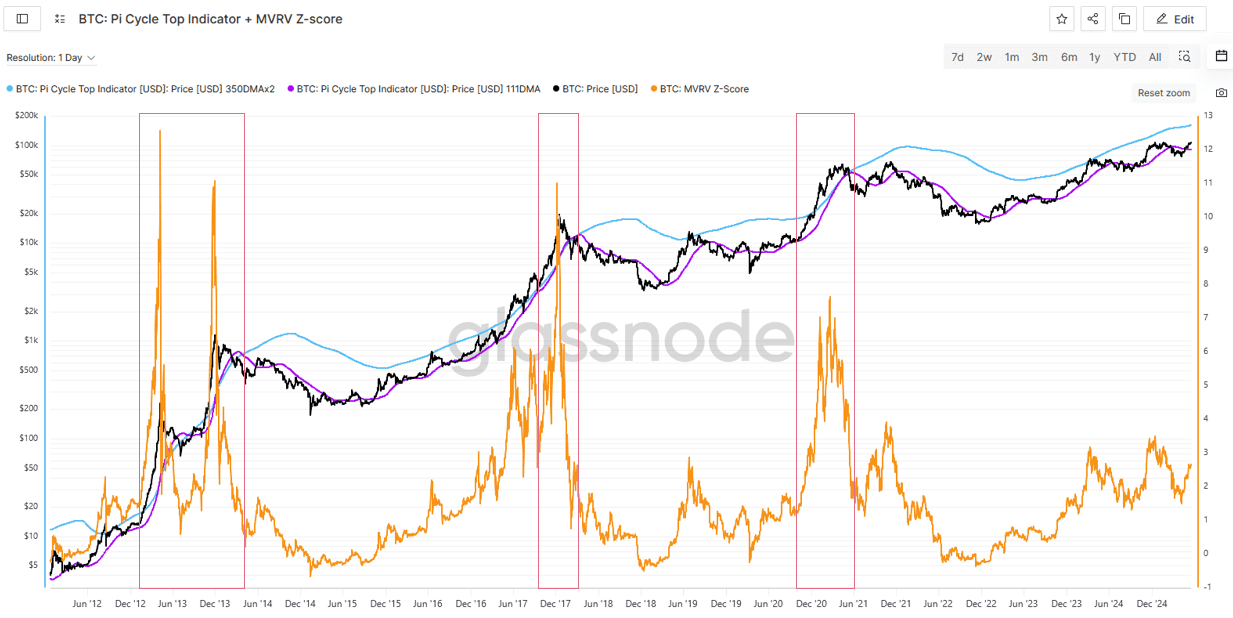
MVRV-Z Score:
-
What it is: The MVRV-Z Score compares Bitcoin’s market value to its realized value, adjusted for volatility. It essentially measures how overvalued or undervalued Bitcoin is relative to its historical cost basis.
-
How it helps: A high MVRV-Z Score suggests Bitcoin is significantly overvalued, indicating a potential market top. Historically, a high Z-score has preceded downward trends in Bitcoin prices.
-
-
Pi Cycle Top Indicator:
-
What it is: This indicator uses moving averages to track Bitcoin’s price dynamics. It focuses on the relationship between the 111-day Simple Moving Average (SMA) and the 350-day SMA multiplied by two.
-
How it helps: When the 111-day SMA crosses above twice the 350-day SMA (350-SMAx2), it signals that the market is overheating. This crossover suggests a potential market top, as the short-term trend catches up to the long-term trend.

-
-
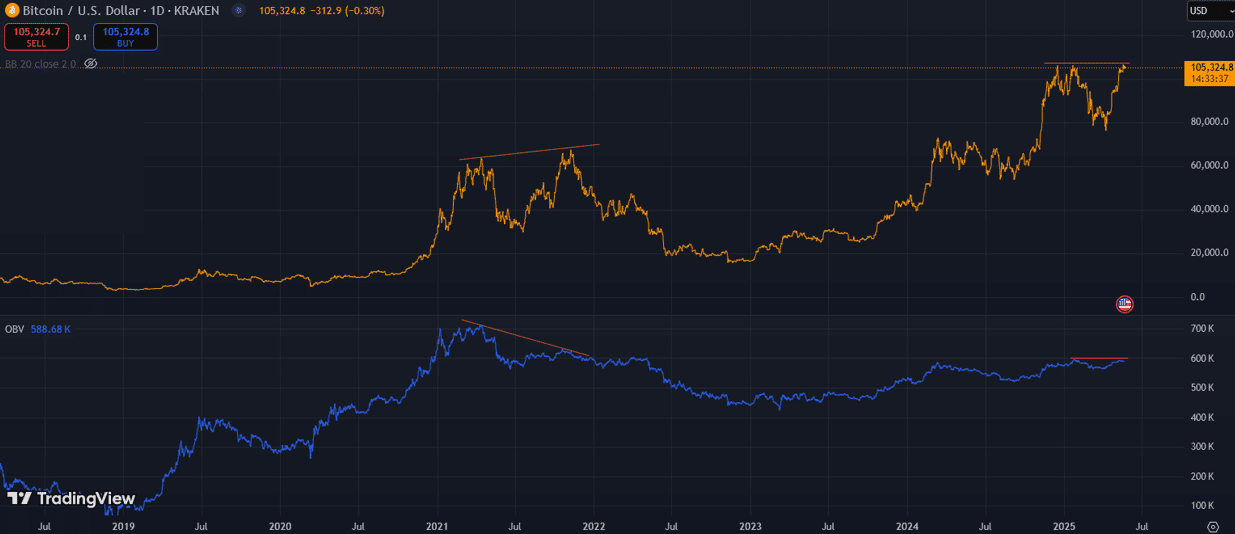
Trade Volume Analysis:
-
What it is: Analyzing trading volumes during price increases can reveal underlying market strength or weakness. On-Balance Volume (OBV) is a key metric to track cumulative volume flow.
-
How it helps: Lower trading volumes during price increases can signal weakening momentum, potentially indicating a reversal. A divergence between OBV and price action can be an early warning sign of a market top. For instance, the second leg of the 2021 bull run saw Bitcoin hitting new highs while trading volumes decreased, indicating waning momentum.
-
-
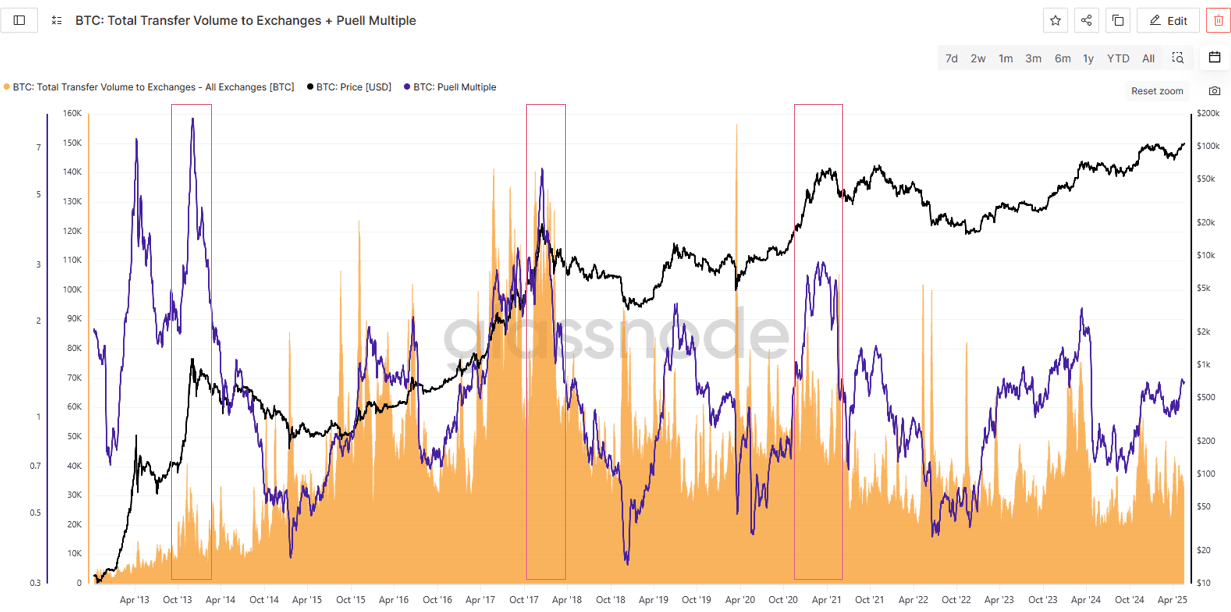
Puell Multiple:
-
What it is: The Puell Multiple assesses miners’ revenue relative to its 365-day moving average. It helps gauge miners’ profitability and potential selling pressure.
-
How it helps: High Puell Multiple readings suggest miners may start selling aggressively, often observed near market tops. This selling pressure can contribute to a market downturn.
-
-
Exchange Inflows:
-
What it is: Monitoring Bitcoin inflows into exchanges provides insights into investor behavior, especially distribution patterns.
-
How it helps: Large inflows to exchanges typically indicate distribution, as investors prepare to sell their holdings. An increase in Bitcoin deposits to exchanges can be a sign of profit-taking and potential market weakness.
-
Additional Considerations
-
Whale Accumulation: Tracking Bitcoin whale accumulation can provide insights into market sentiment. An increase in addresses holding large amounts of Bitcoin can indicate preparations for a potential rally.
-
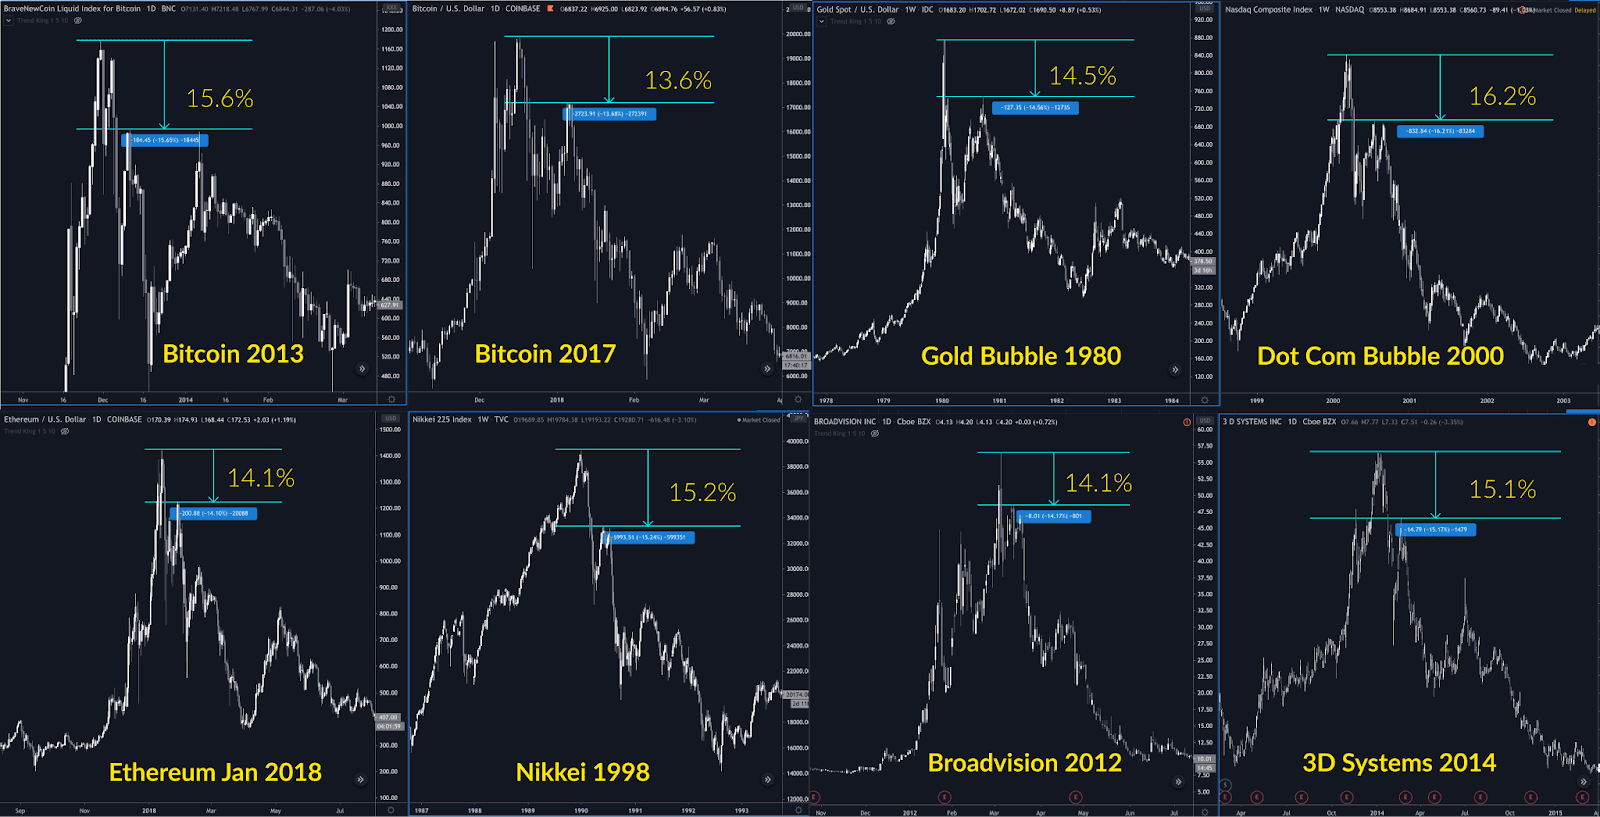
15% Rule: Crypto market analyst Cole Garner suggests monitoring Bitcoin’s price activity relative to its all-time high. A sharp correction of around 15% below the all-time high can signal a potential exit point, as institutional investors may have sell orders around this level.
Conclusion
While no single indicator can guarantee the precise timing of a market top, combining multiple signals can provide a more reliable assessment. Monitoring indicators such as the MVRV-Z Score, Pi Cycle Top, trade volume trends, Puell Multiple, and exchange inflows can help traders and investors make informed decisions and lock in profits before the market turns bearish.
Understanding these indicators and incorporating them into your trading strategy can significantly improve your ability to navigate Bitcoin’s volatile market cycles.