Key points:
-
US President Donald Trump shifts focus from Elon Musk to Fed Chair Jerome Powell, advocating for significant interest-rate cuts.
-
Bitcoin extends its rebound despite robust US employment figures, navigating the Trump-Musk narrative.
-
Liquidity concerns intensify, raising the specter of a potential BTC price “cascade.”
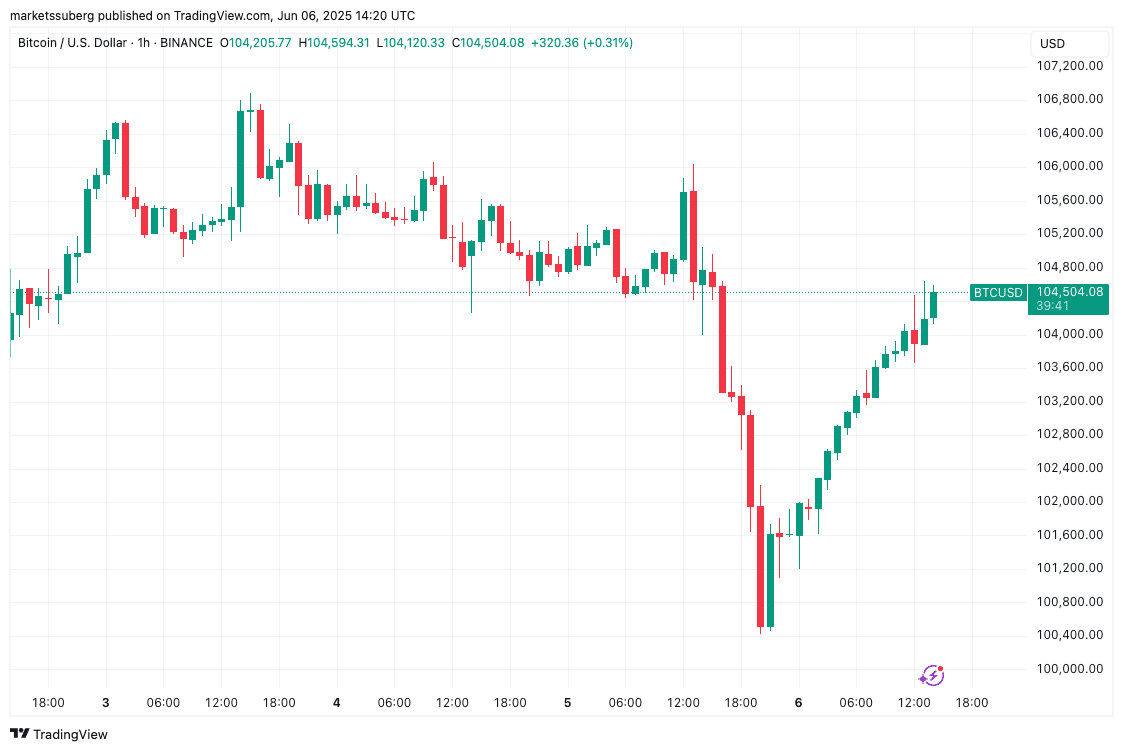
Bitcoin (BTC) surpassed $104,000 at the June 6 Wall Street opening, juxtaposed against strong US labor market data and renewed calls for interest-rate reductions.
Bitcoin edges higher as Trump moves to Fed
Data showed BTC/USD up 2.5% on the day.
After recovering from losses spurred by the Trump-Musk exchange, markets are now digesting inflation cues as Trump directs his attention toward the Federal Reserve.
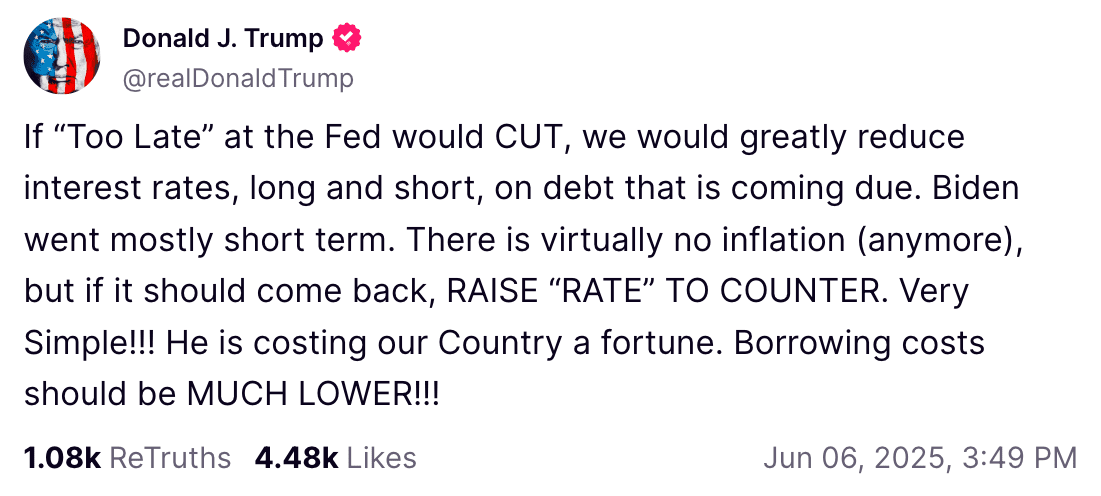
“‘Too Late’ at the Fed is a disaster!” he wrote in a recent post on Truth Social.
Trump has a history of criticizing Fed policy and Chair Jerome Powell, frequently pushing for interest-rate cuts in 2025, a move that typically favors risk assets like crypto.
“Europe has had 10 rate cuts, we have had none. Despite him, our Country is doing great,” he added, referring to Powell.
“Go for a full point, Rocket Fuel!”
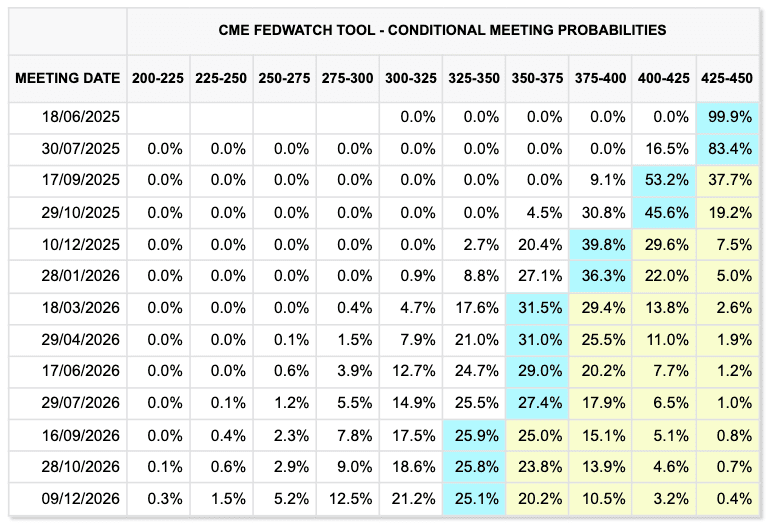
Markets currently foresee limited chances of rate cuts before the Fed’s September meeting, according to data from CME Group’s FedWatch Tool, effectively pricing out Trump’s desired full point cut.
Recent nonfarm payrolls data appears to reinforce the Fed’s current stance, indicating a robust labor market and lessening the urgency for rate reductions.
An official release from the US Bureau of Labor Statistics (BLS) confirmed that “total nonfarm payroll employment increased by 139,000 in May, and the unemployment rate was unchanged at 4.2 percent.”
Analysis warns of Bitcoin “liquidity trap”
Turning to BTC price action, popular trader TheKingfisher is analyzing order book liquidity for insights into market direction.
Earlier reports highlighted potential downside price targets for the short term, with analysts suggesting BTC/USD could dip below $100,000.
“This $BTC liquidation map (optical_opti timeframe) reveals a massive cluster of long liquidations between ~99k and 102k,” part of a recent X post read.
“That’s a huge magnetic zone below current price. In contrast, short liquidations above ~104.5k are minimal.”
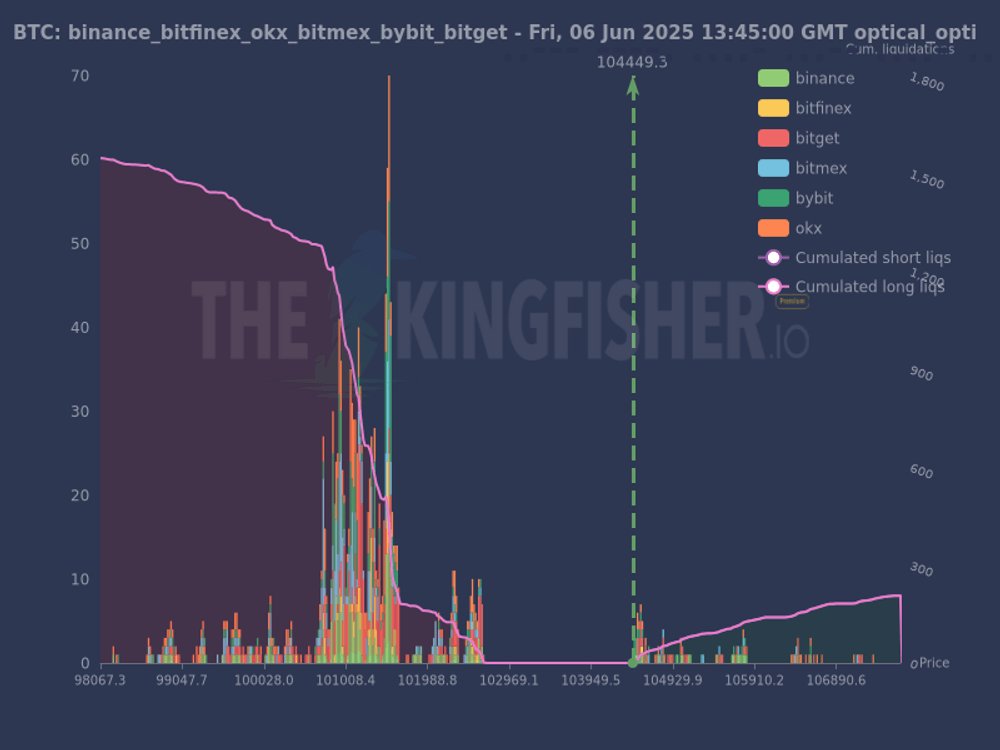
TheKingfisher suggests that the resulting “strong imbalance” between bid and ask liquidity elevates the risk of a downward liquidity cascade.
“Normies see support; we see a liquidation trap,” the post concluded.
This article does not contain investment advice or recommendations. Every investment and trading move involves risk, and readers should conduct their own research when making a decision.