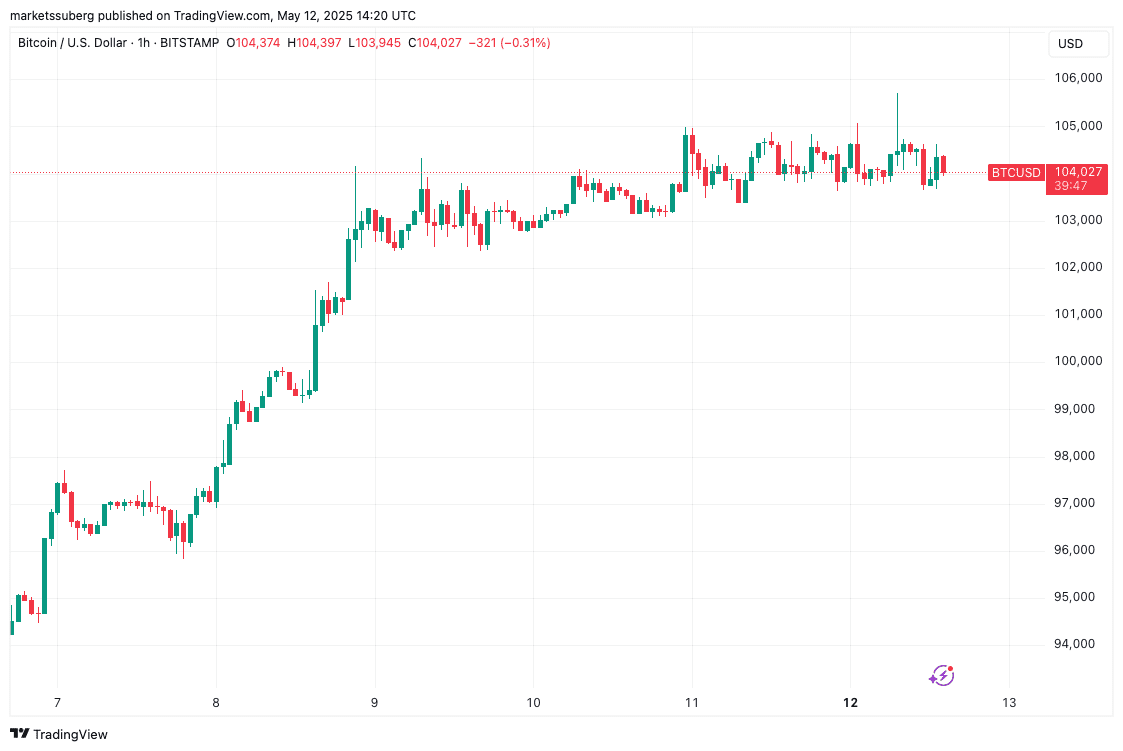
Bitcoin (BTC) is currently consolidating around $104,000 following a surge that brought it to its highest levels since late January. This price action coincides with news of a US-China trade deal, impacting traditional markets and the US dollar.
US-China Trade Deal: A Catalyst for Market Movement
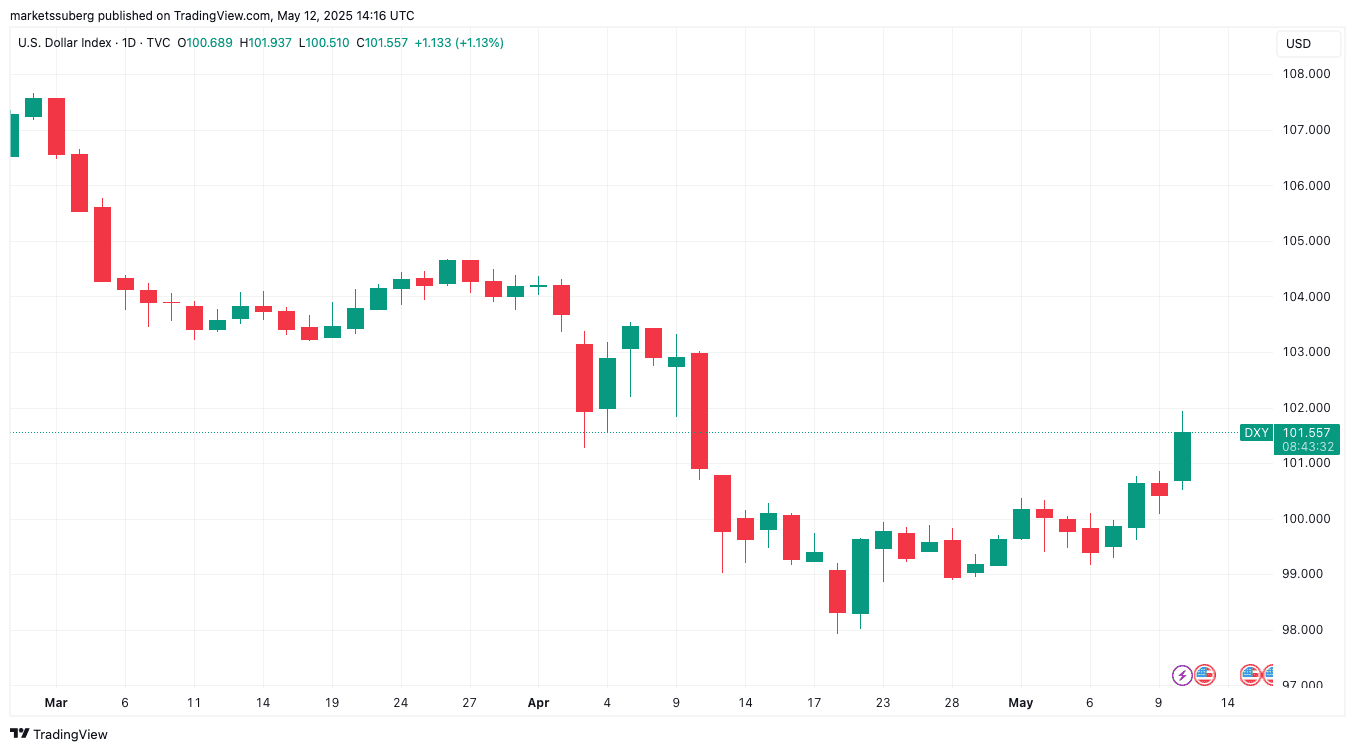
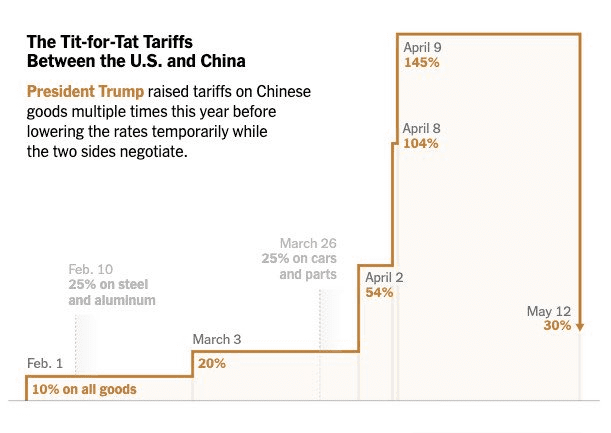
The United States and China have reached an agreement to reduce trade tariffs, sending positive ripples through the stock market. The S&P 500 and Nasdaq Composite Index both experienced gains of approximately 3% following the announcement. This development also strengthened the US dollar, with the US dollar index (DXY) reaching a one-month high.
While the trade deal has generally boosted market sentiment, Bitcoin’s reaction has been more measured. It appears to be finding a middle ground between major assets, as gold experienced a decline, nearing month-to-date lows at $3,208 per ounce.
Key Takeaways from the US-China Trade Deal Impact:
- Stocks surged (S&P 500, Nasdaq Composite up ~3%)
- US Dollar strengthened (DXY hit one-month high)
- Gold declined
- Bitcoin consolidated around $104,000
Short-Term Bitcoin Price Analysis: Liquidity and Potential Targets
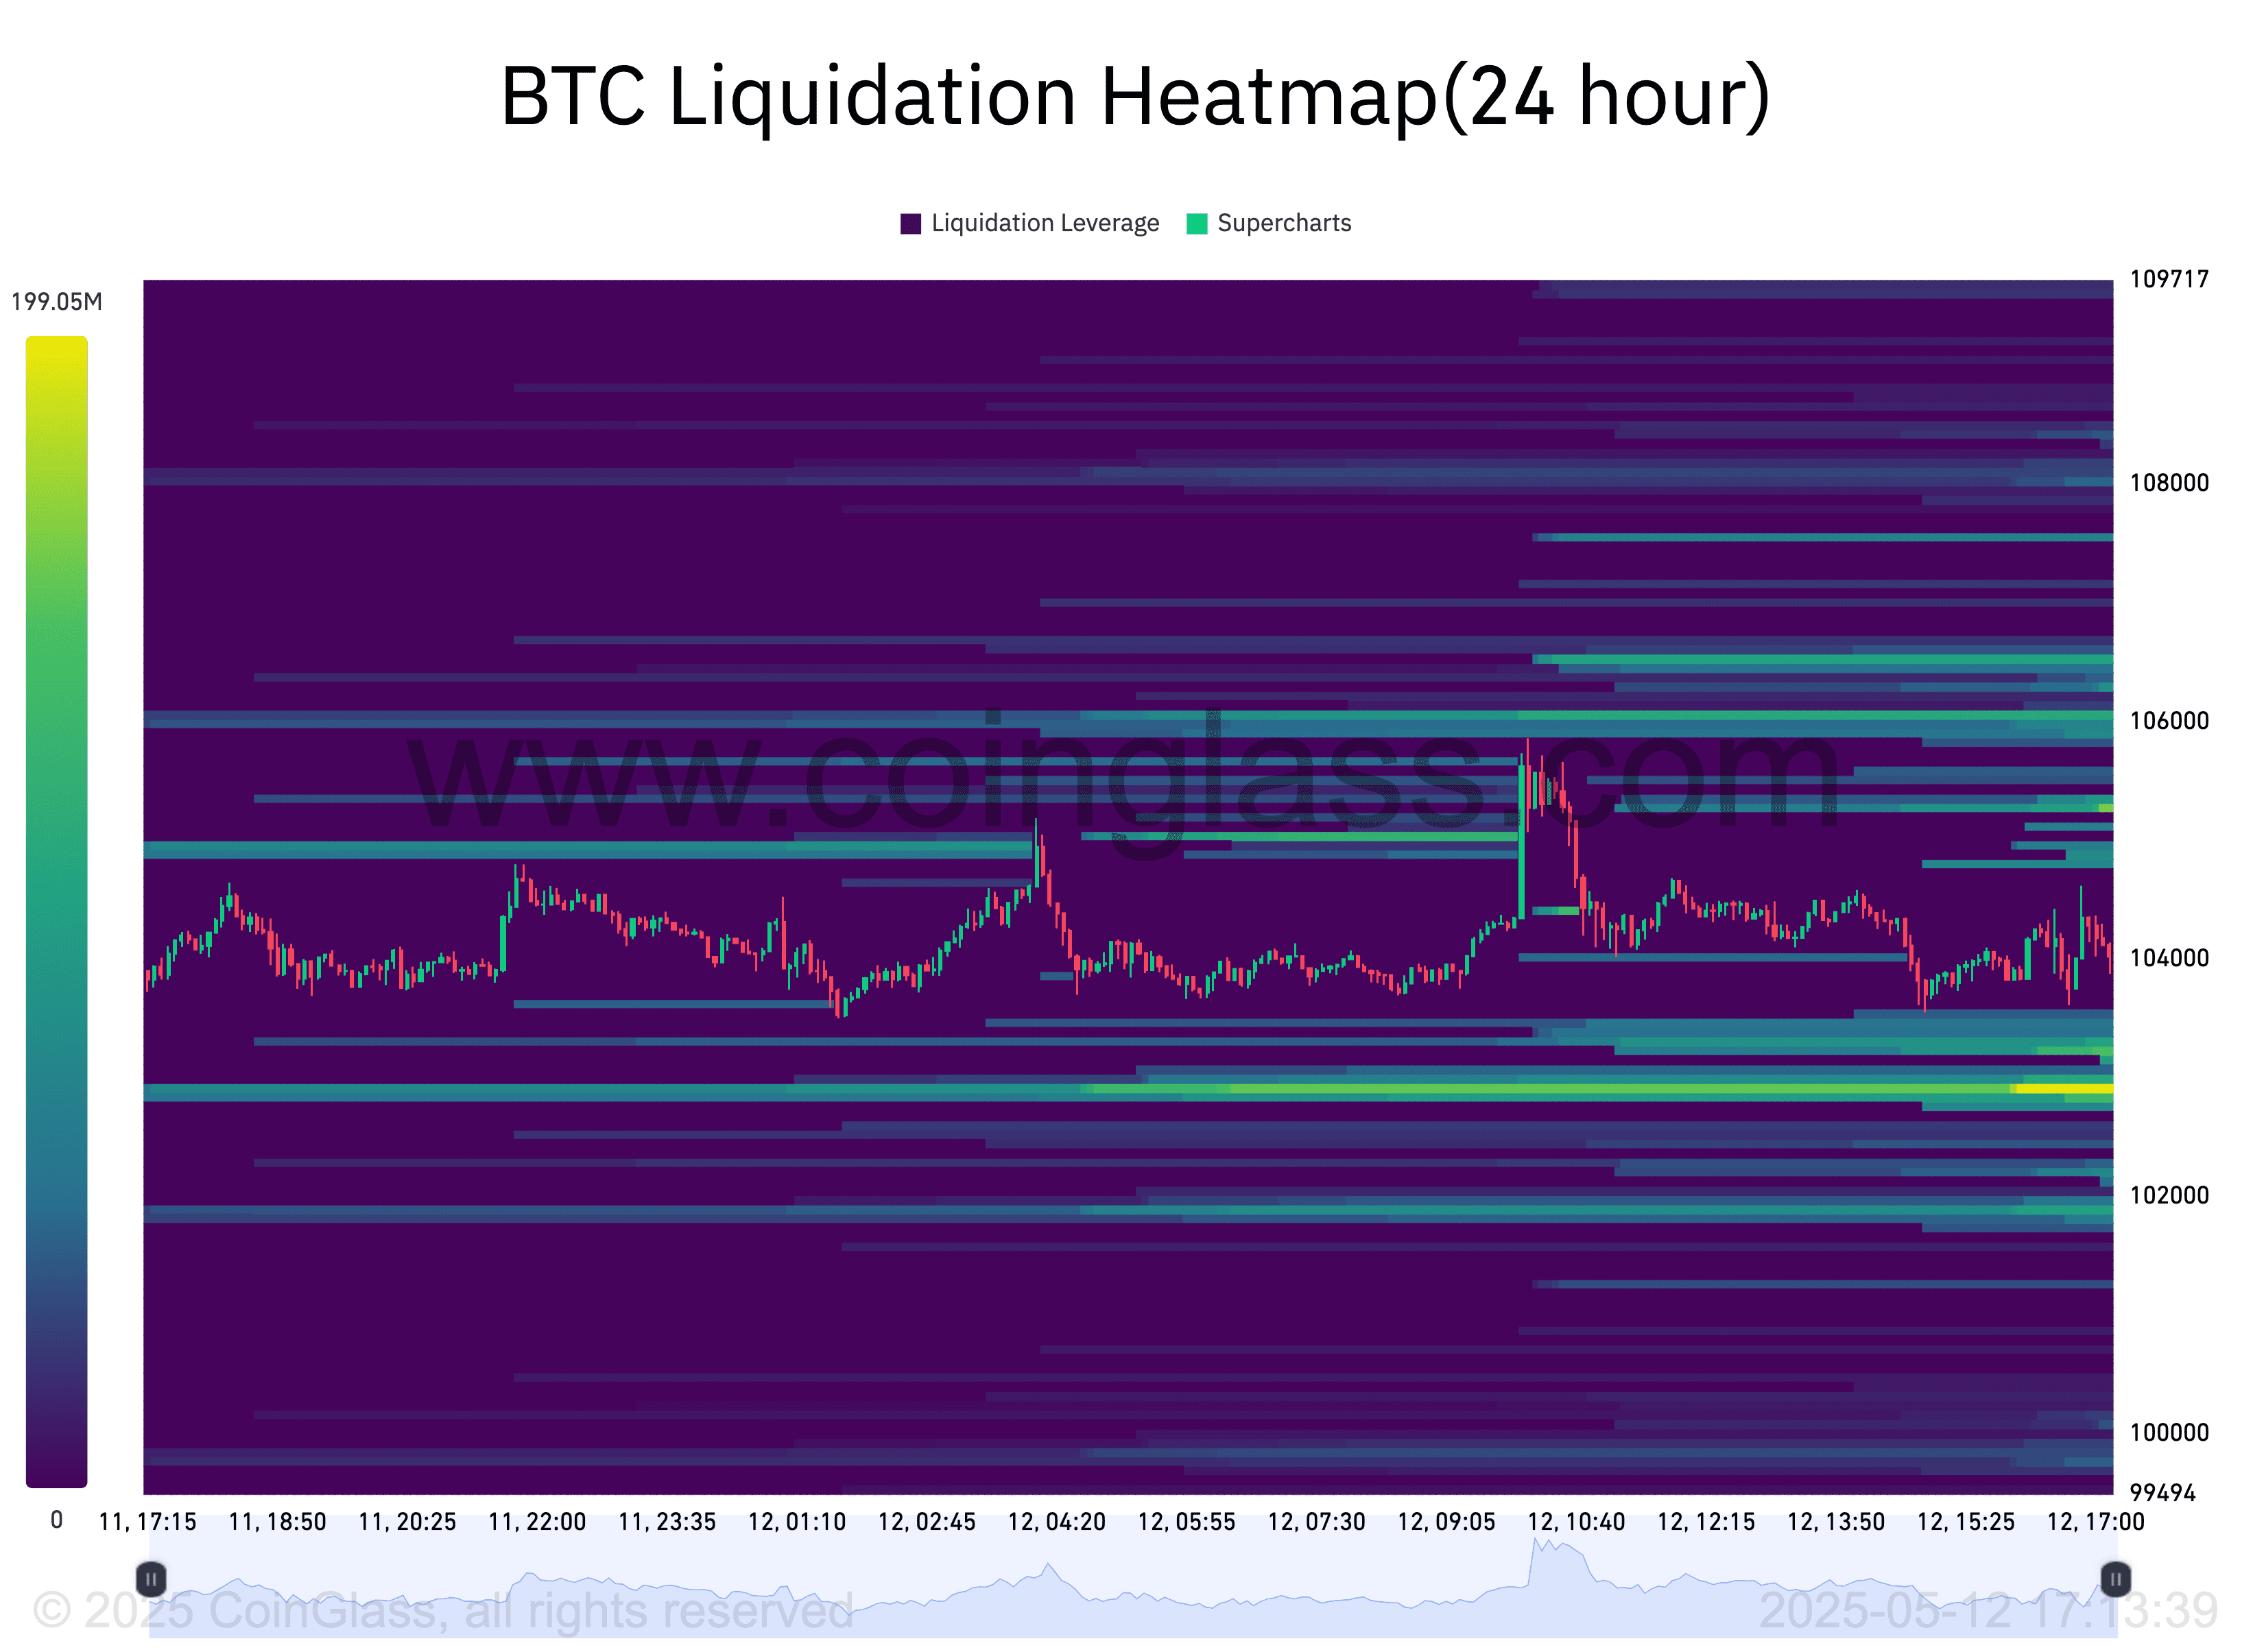
Traders are closely monitoring Bitcoin’s order book liquidity for potential short-term price movements. Popular trader Daan Crypto Trades noted that Bitcoin had “swept most nearby liquidity” around the $103,000-$105,000 range. He highlighted the $102,000 region as a potential area of interest due to a dense concentration of liquidation clusters.
Key Levels to Watch:
- Potential Support: $102,000 (liquidation cluster)
- Resistance: $105,000 (previous liquidity area)
CoinGlass data supports this observation, showing increasing bids around the $103,000 level after the Wall Street open, indicating potential buying interest in that area.
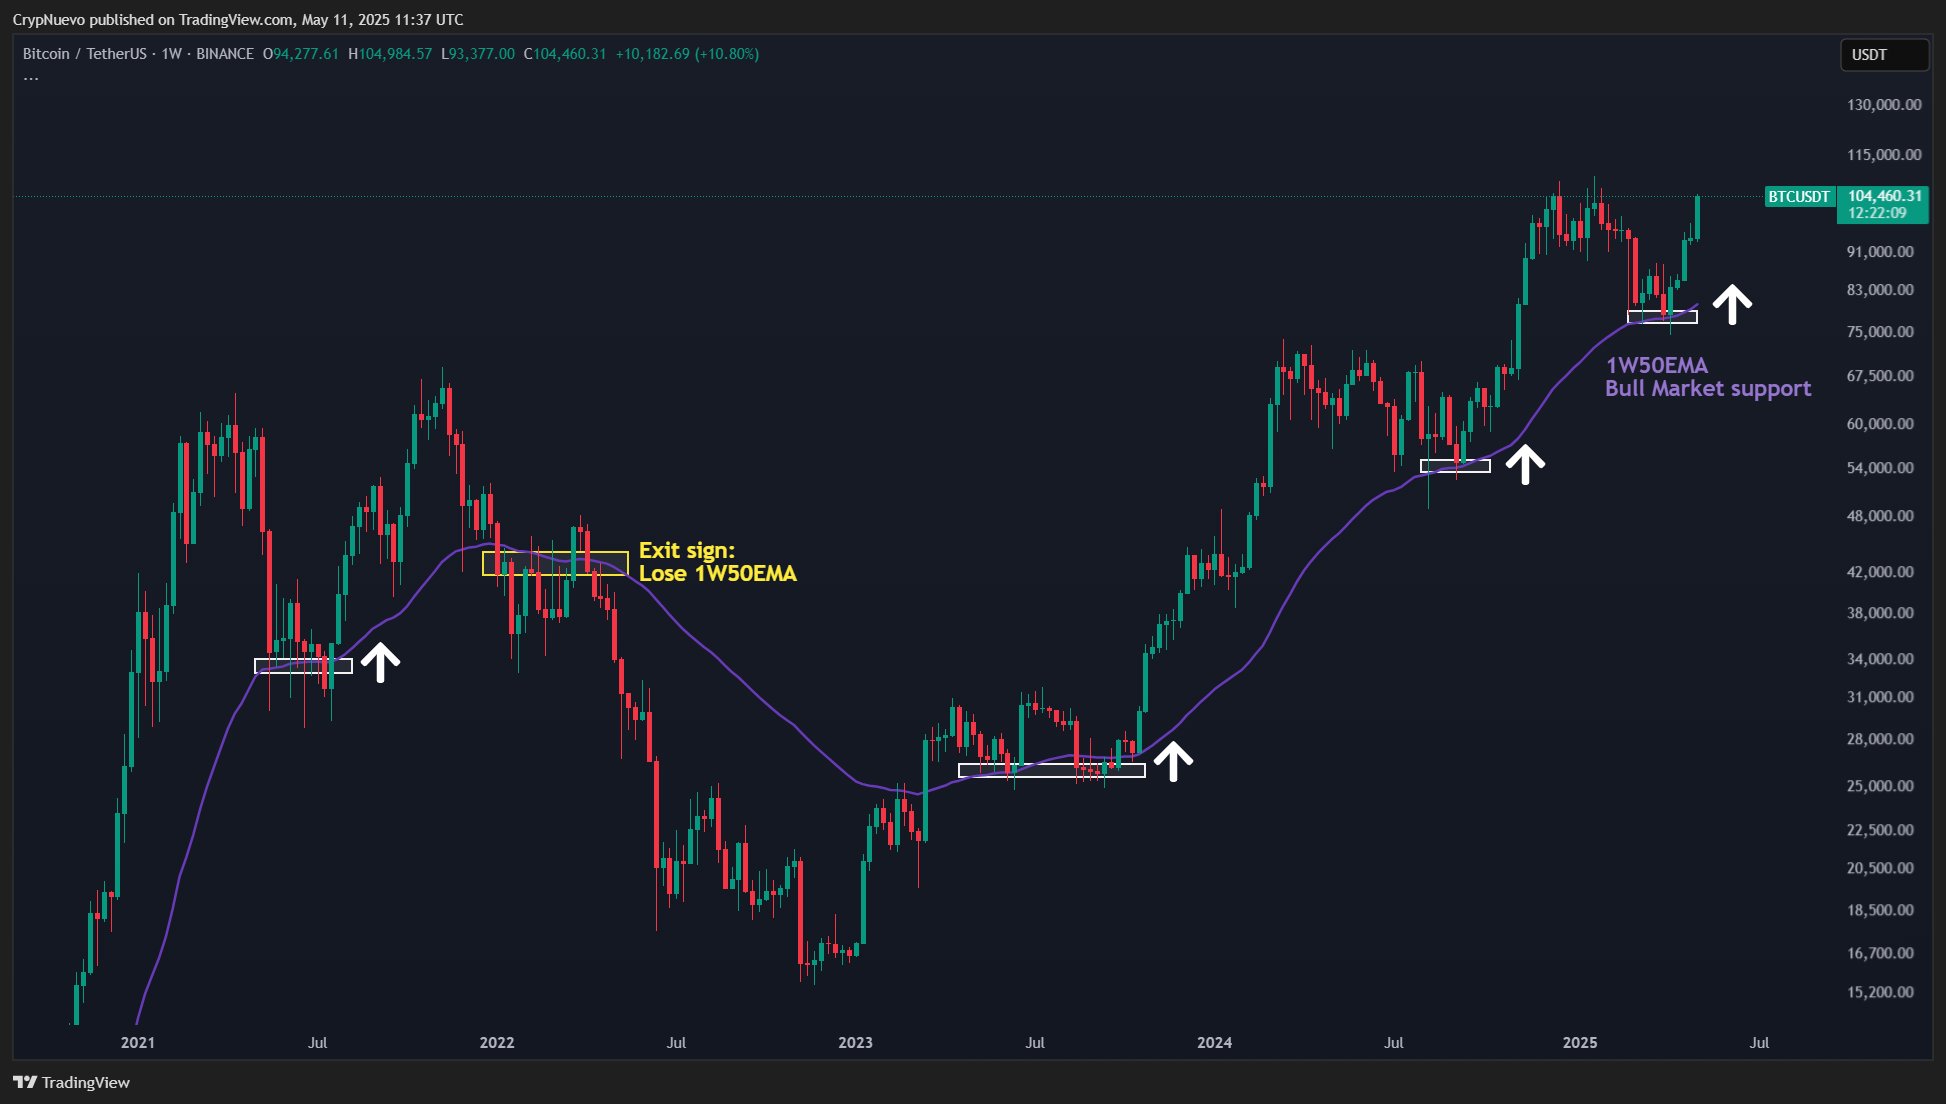
Long-Term Bullish Outlook: Retesting the 50-Week EMA
Looking at the bigger picture, several analysts maintain a bullish outlook for Bitcoin. CrypNuevo pointed out that Bitcoin has successfully retested the 50-week exponential moving average (EMA).
Historically, the 50-week EMA has acted as a springboard for new all-time highs. Each previous retest of this moving average has been followed by a significant upward price movement. The 50-week EMA currently sits at $80,300.
Key Bullish Indicator:
- Successful retest of the 50-week EMA ($80,300)
Further supporting the bullish sentiment, a classic bull market breakout signal has emerged on weekly timeframes – a cross on the moving average convergence/divergence (MACD) indicator.
Conclusion: Poised for Another Run?
Bitcoin’s current consolidation near $104,000 presents a mixed picture. While short-term price action may be influenced by liquidity levels around $102,000, the long-term outlook remains positive. The successful retest of the 50-week EMA and the MACD crossover suggest that Bitcoin may be gearing up for another run towards a new all-time high.
Disclaimer: This article is for informational purposes only and does not constitute financial advice. Cryptocurrency investments are inherently risky, and you should conduct your own research before making any decisions.