Bitcoin’s Response to US-China Trade Deal
Bitcoin (BTC) is currently consolidating around $104,000, following a recent surge that took it to its highest levels since late January. This price action coincides with significant developments in global markets, specifically the US-China trade deal, which has triggered positive reactions in stocks and the US dollar.
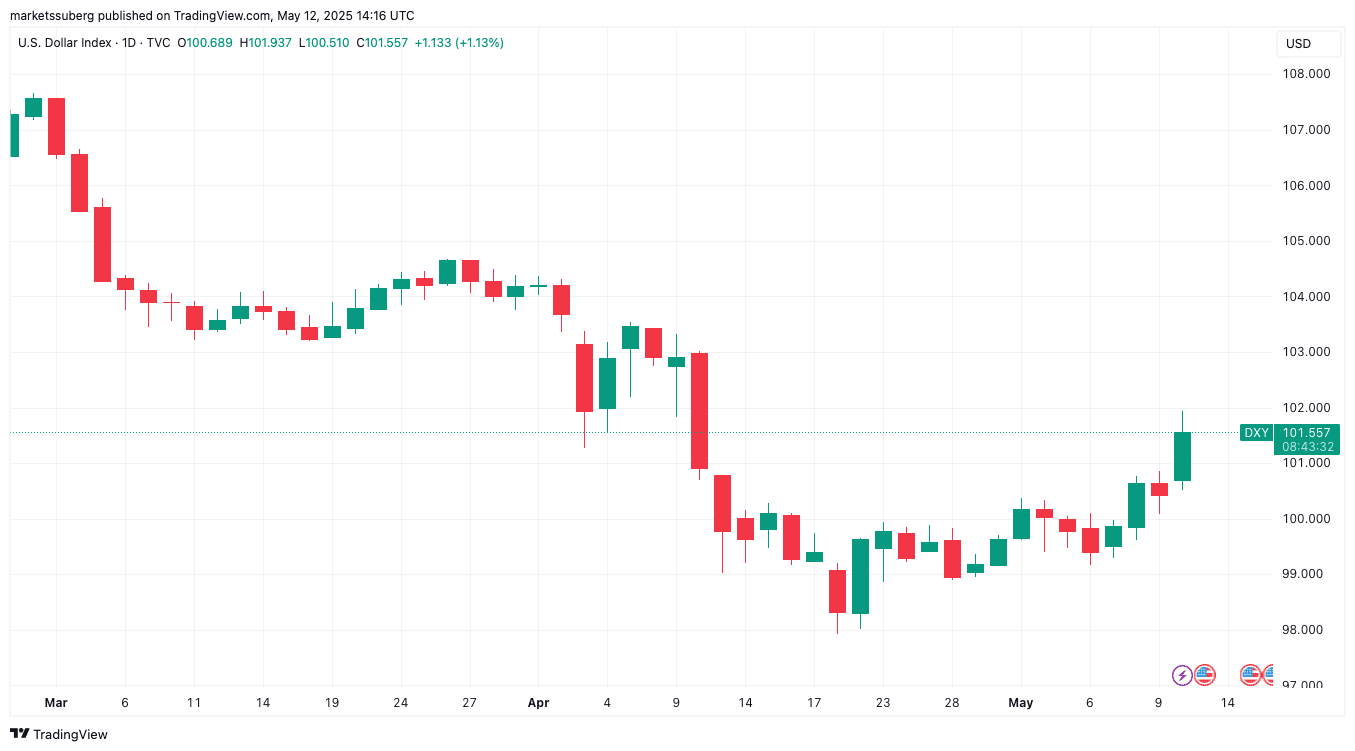
The agreement between the US and China to reduce trade tariffs has led to a rally in the S&P 500 and Nasdaq Composite Index, both gaining approximately 3%. This positive sentiment has also strengthened the US dollar, with the US Dollar Index (DXY) reaching one-month highs.
Key Takeaways from the Market Reaction:
- Stocks Surge: The S&P 500 and Nasdaq Composite Index experienced gains of around 3% following the US-China trade deal announcement.
- Dollar Strength: The US Dollar Index (DXY) hit a one-month high, reflecting increased confidence in the US economy.
- Gold’s Dip: Gold prices declined, nearing month-to-date lows, as investors shifted towards riskier assets.
Bitcoin’s Liquidity and Potential Targets
Analysts are closely monitoring Bitcoin’s order book liquidity to identify potential trading targets. Data suggests significant liquidity around the $102,000 level, which could serve as a key support area. A break below this level could trigger further price action, while a hold could signal continued bullish momentum.
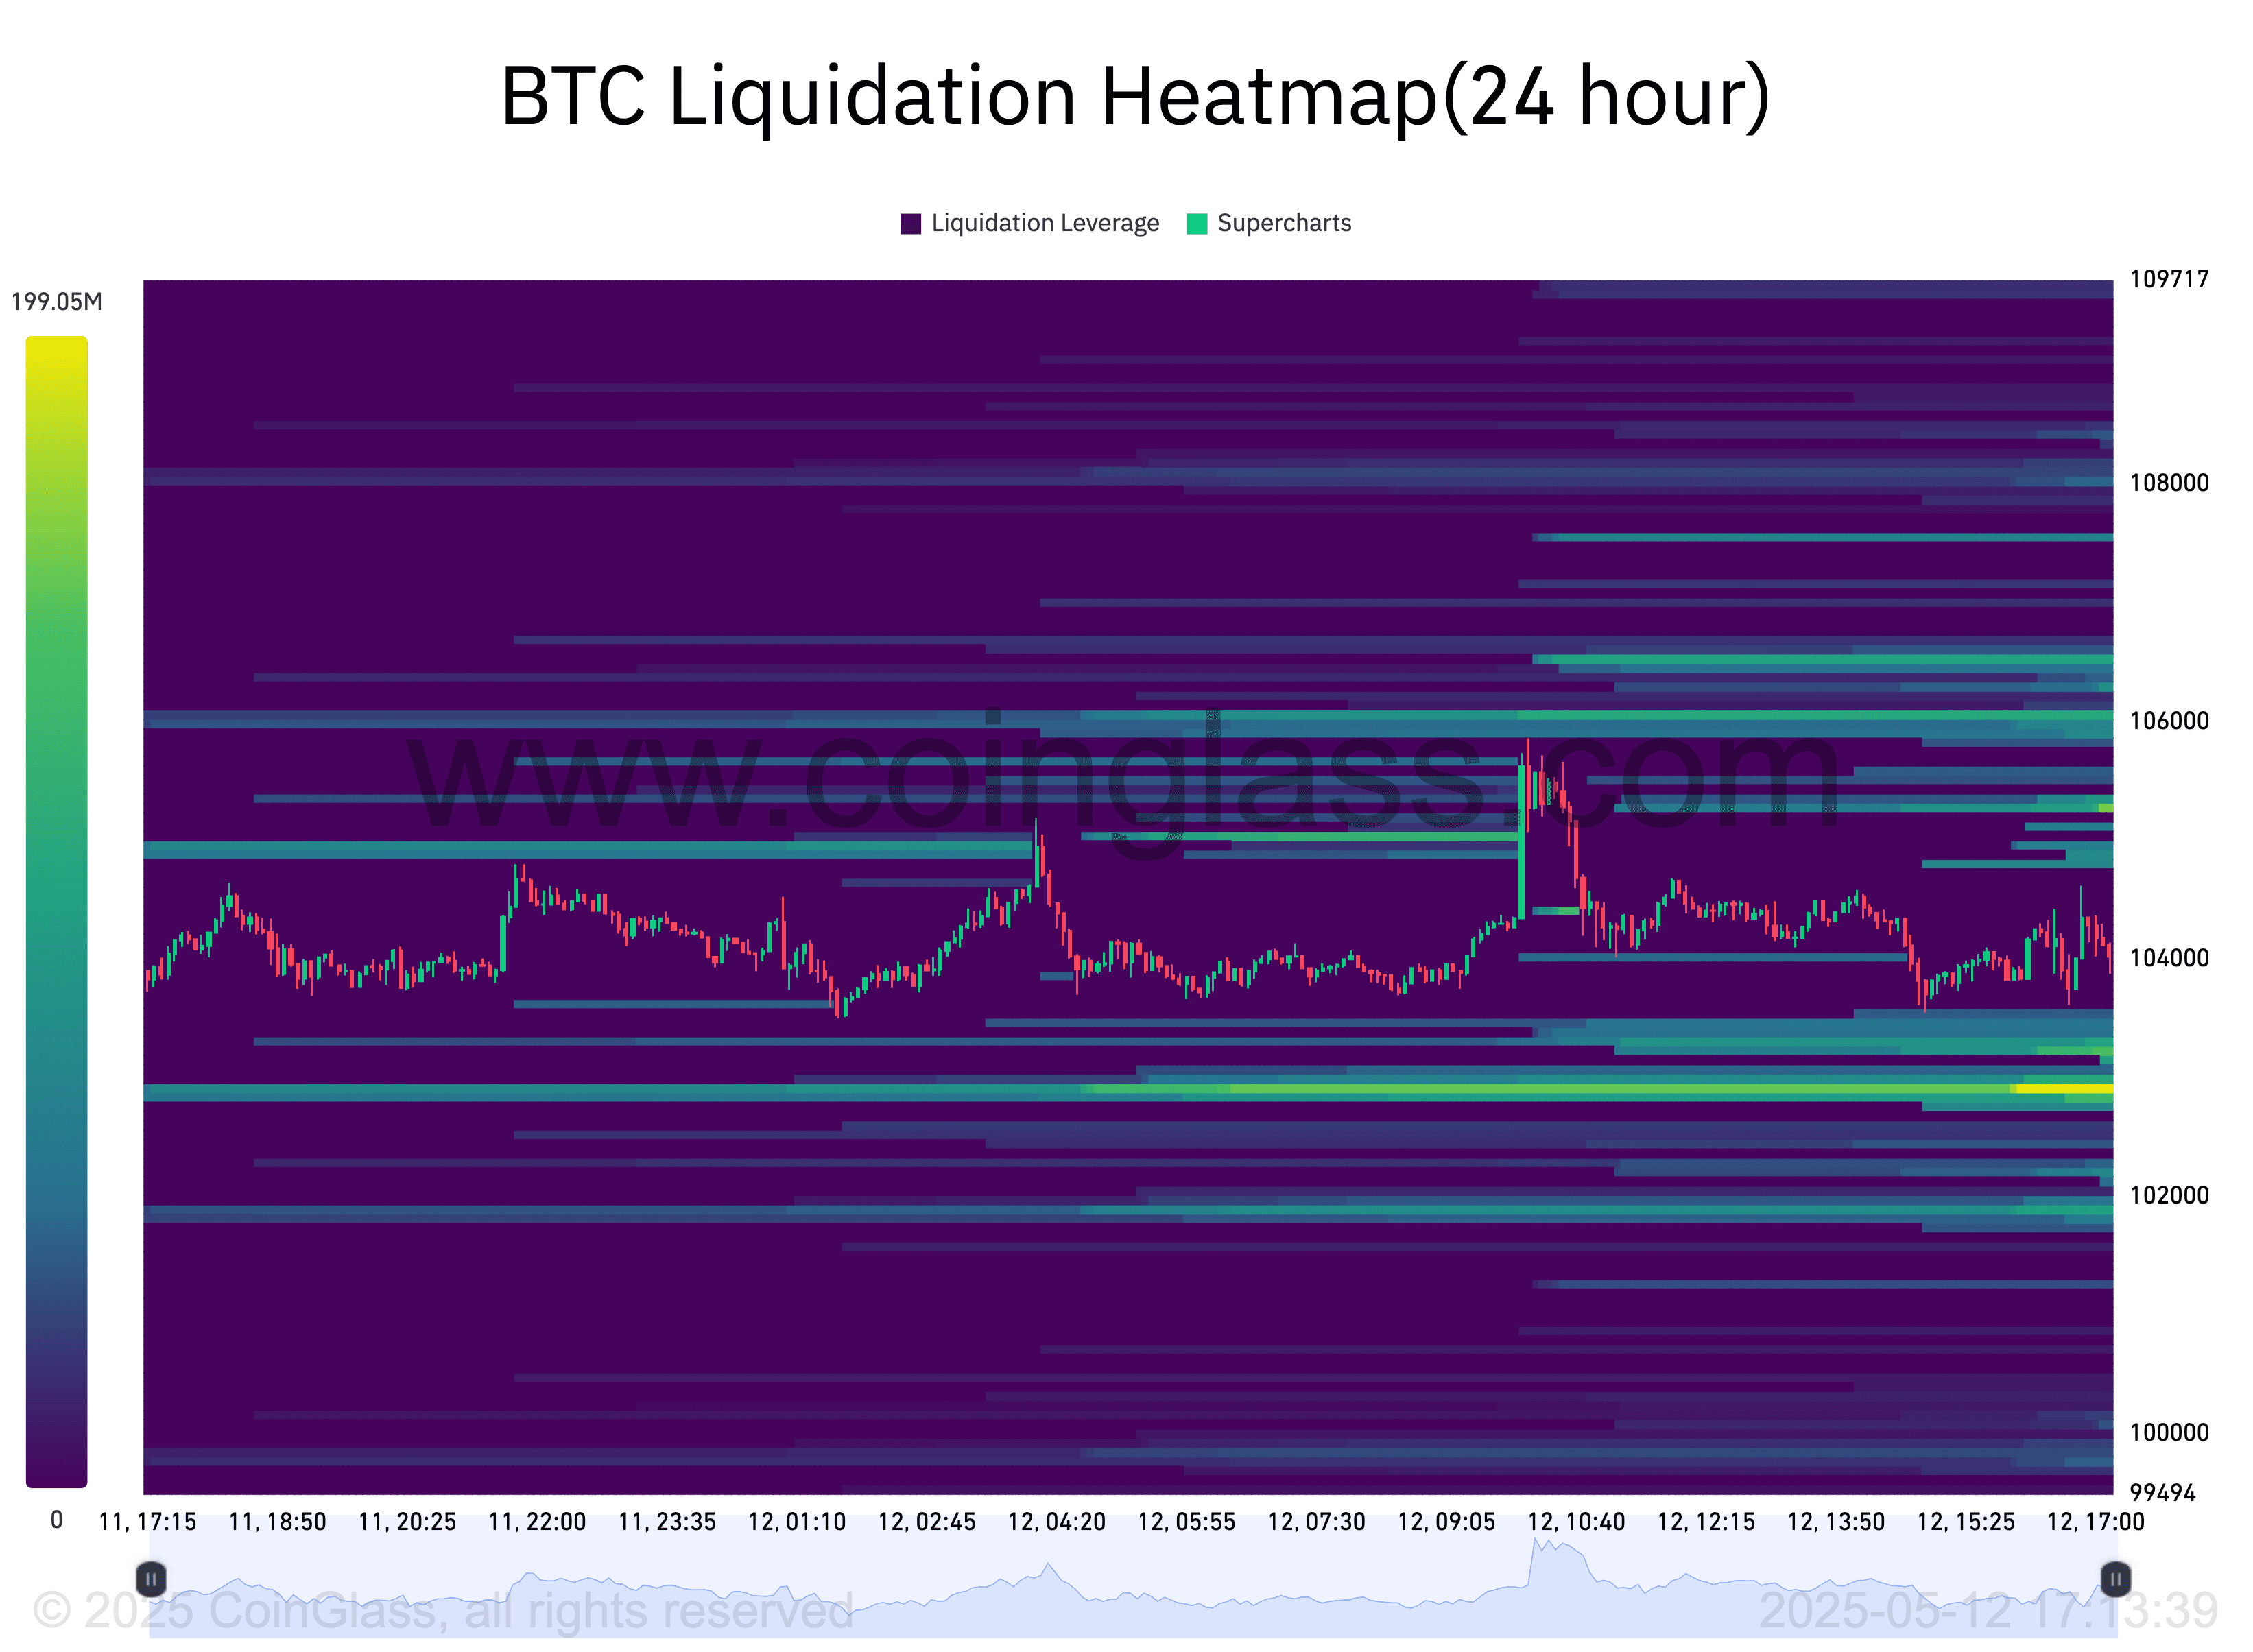
CoinGlass data indicates increasing bids around the $103,000 mark, suggesting strong buying interest at these levels.
Potential Scenarios:
- Bullish Scenario: If Bitcoin maintains its position above $103,000 and overcomes resistance at $105,000, it could target higher levels, potentially reaching a new all-time high.
- Bearish Scenario: A break below the $102,000 support could lead to further downside, with potential targets around $100,000 or lower.
Bullish Indicators and All-Time High Predictions
Several analysts are maintaining a bullish outlook for Bitcoin, citing technical indicators and historical patterns. One key indicator is the retest of the 50-week exponential moving average (EMA), which has historically acted as a springboard for new all-time highs.
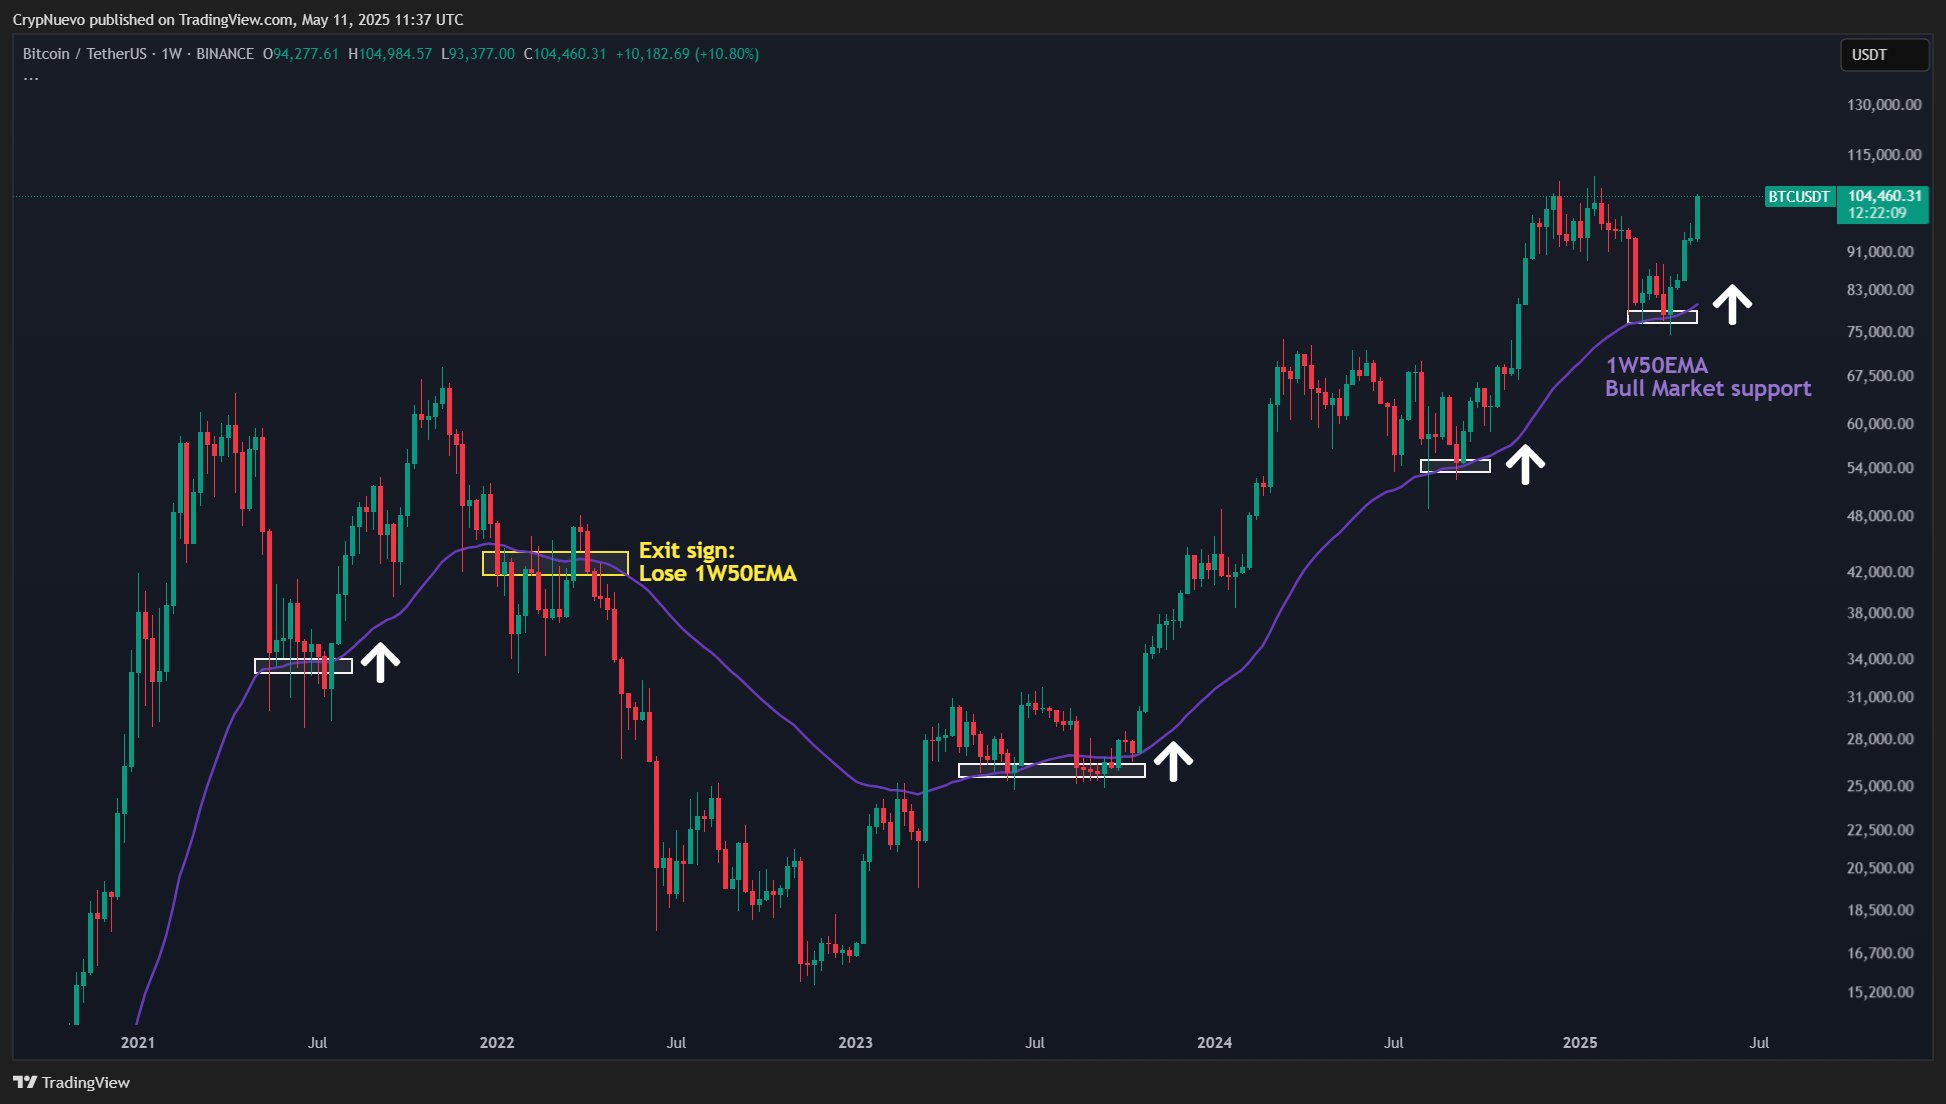
The 50-week EMA, currently around $80,300, has historically preceded significant upward movements in Bitcoin’s price. This suggests that a successful retest of this level could signal the beginning of a new bull run.
Another bullish signal is the moving average convergence/divergence (MACD) indicator, which has recently shown a classic bull market breakout signal on weekly timeframes.
Key Bullish Indicators:
- 50-Week EMA Retest: Historical data suggests that a retest of the 50-week EMA often precedes new all-time highs.
- MACD Bullish Crossover: A classic bull market breakout signal on weekly timeframes.
Conclusion
Bitcoin’s current consolidation phase follows a period of rapid gains, driven by positive market sentiment and technical indicators. While the US-China trade deal has provided a boost to stocks and the US dollar, Bitcoin remains resilient, finding support around key levels. Analysts are closely watching these levels and the ongoing market dynamics to determine whether Bitcoin will continue its upward trajectory and reach a new all-time high. As always, investors should conduct thorough research and consider their own risk tolerance before making any investment decisions.