Bitcoin (BTC) is showing signs of a potential rally to new all-time highs, fueled by fractal patterns and positive on-chain data. However, a bearish divergence on the daily chart warrants caution. This article provides a comprehensive analysis of the factors influencing Bitcoin’s price trajectory.
Key Takeaways:
- Bitcoin’s price action mirrors previous patterns, hinting at a breakout above $110,000.
- On-chain data from Glassnode indicates strong accumulation among various Bitcoin wallet cohorts.
- A bearish divergence on the daily chart signals a potential weakening of momentum, which should be closely monitored.
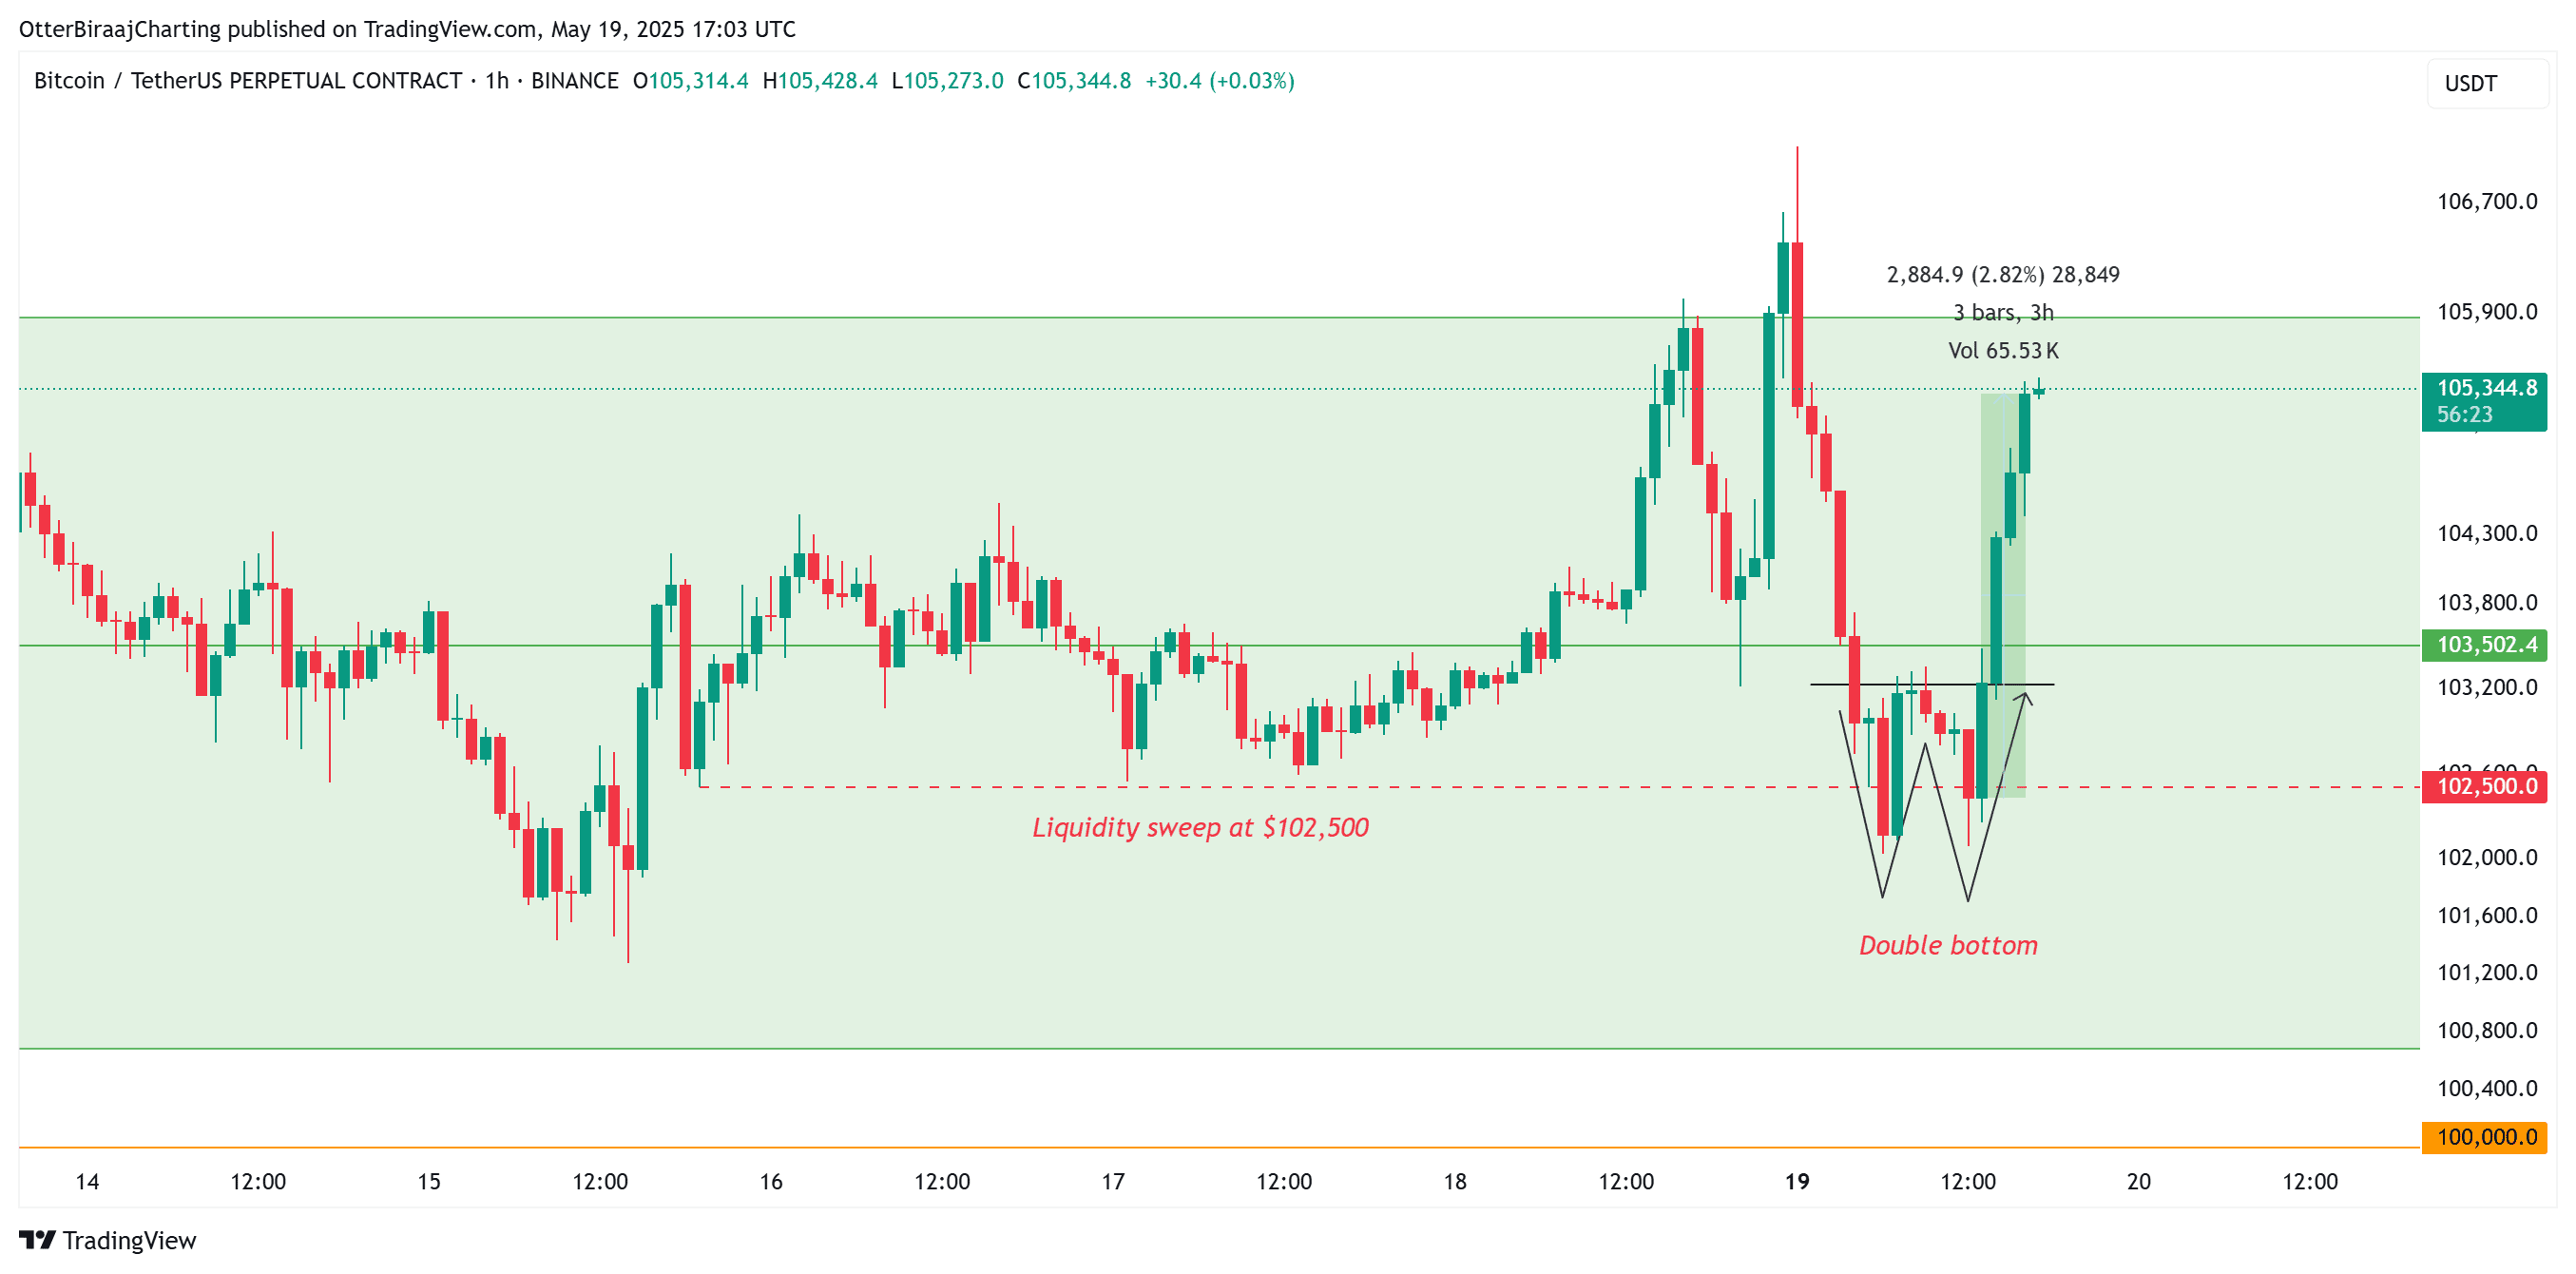
After forming a double bottom pattern on the 1-hour chart, Bitcoin’s price rebounded above $105,000 during the US market session. The sweep of liquidity around the $102,500 zone has potentially paved the way for further price appreciation.
Fractal Analysis Suggests Bullish Momentum
The current trading range of Bitcoin, between $106,300 and $100,600, exhibits similarities to a previous range between $97,900 and $92,700. Key characteristics of this pattern include:
- Trend reversals occurring at both range lows and range highs.
- The formation of a double bottom pattern following the establishment of range highs (e.g., $97,900 and $107,144).
- The double bottom formation occurring above range lows, sweeping internal liquidity levels.
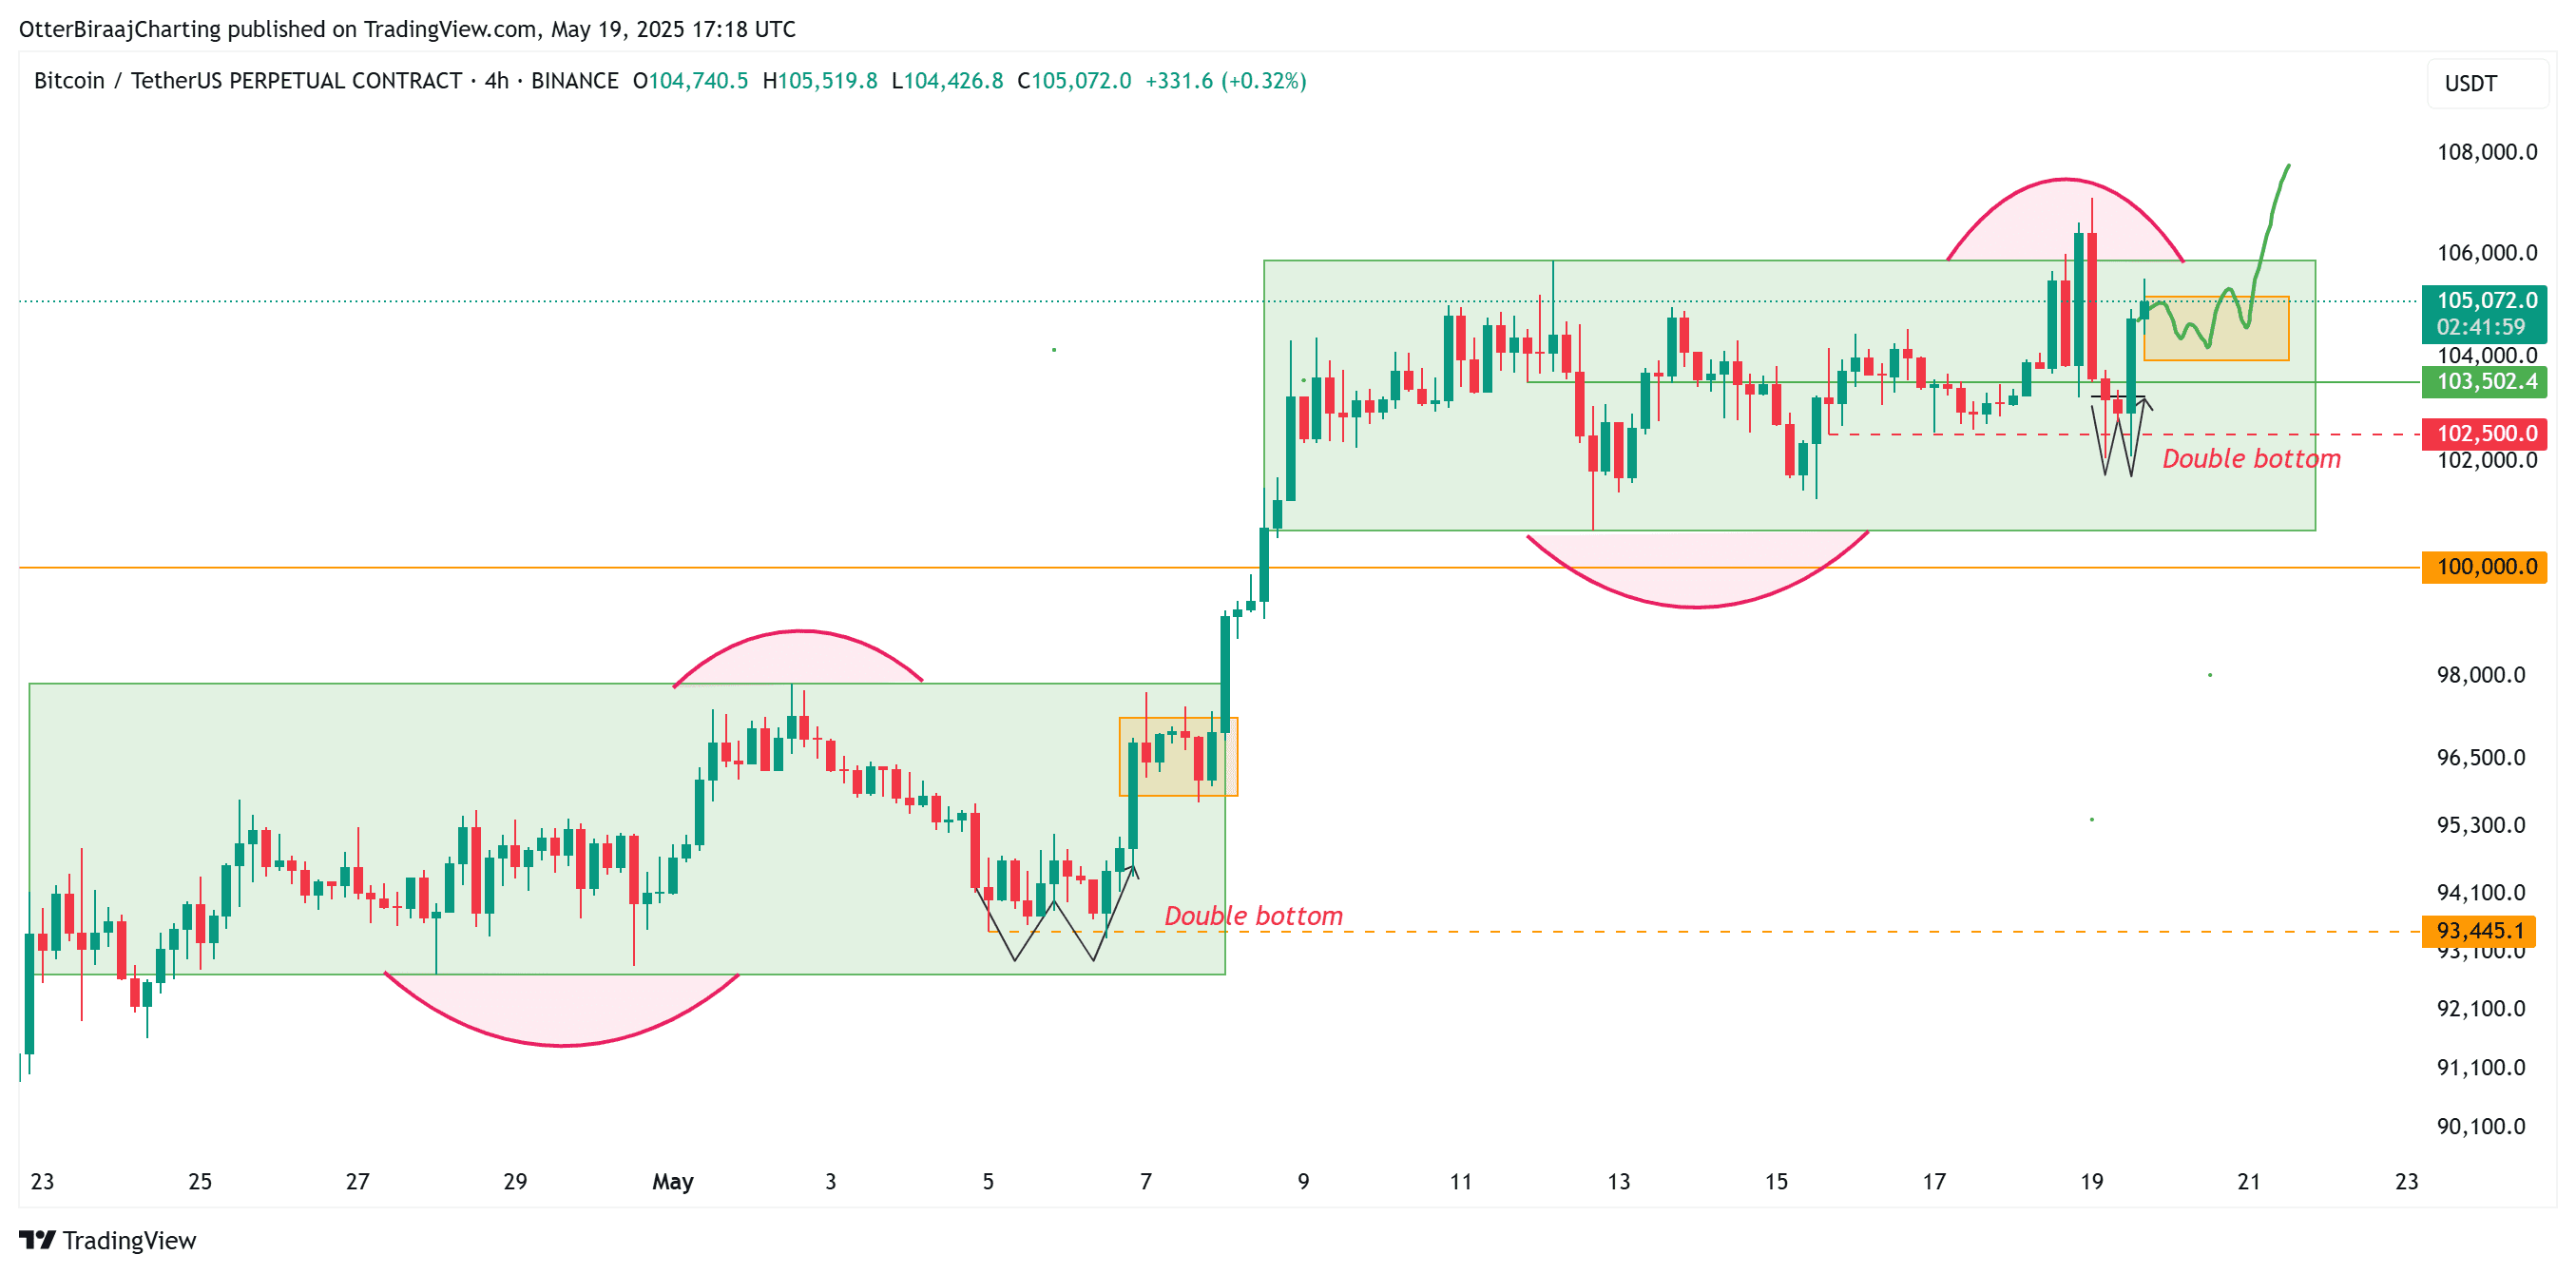
If this fractal pattern continues to hold, Bitcoin may consolidate between $103,500 and $105,200 in the short term, mirroring its prior consolidation between $95,800 and $97,300. A successful continuation of this pattern could lead to a breakout above $107,000 and potentially new all-time highs above $110,000.
Conversely, a failure to maintain support at $103,500 could result in a retest of the $102,000 level, invalidating the fractal pattern and potentially leading to further downside risk.
On-Chain Data: Accumulation Trends
Data from Glassnode reveals growing confidence in Bitcoin’s market, with accumulation trends indicating a bullish sentiment among various wallet cohorts. Small holders (less than 1 BTC) are accumulating, indicated by a score of 0.55. Larger holders, with 100-1,000 BTC and 1,000-10,000 BTC, show strong accumulation scores of 0.9 and 0.85, respectively.
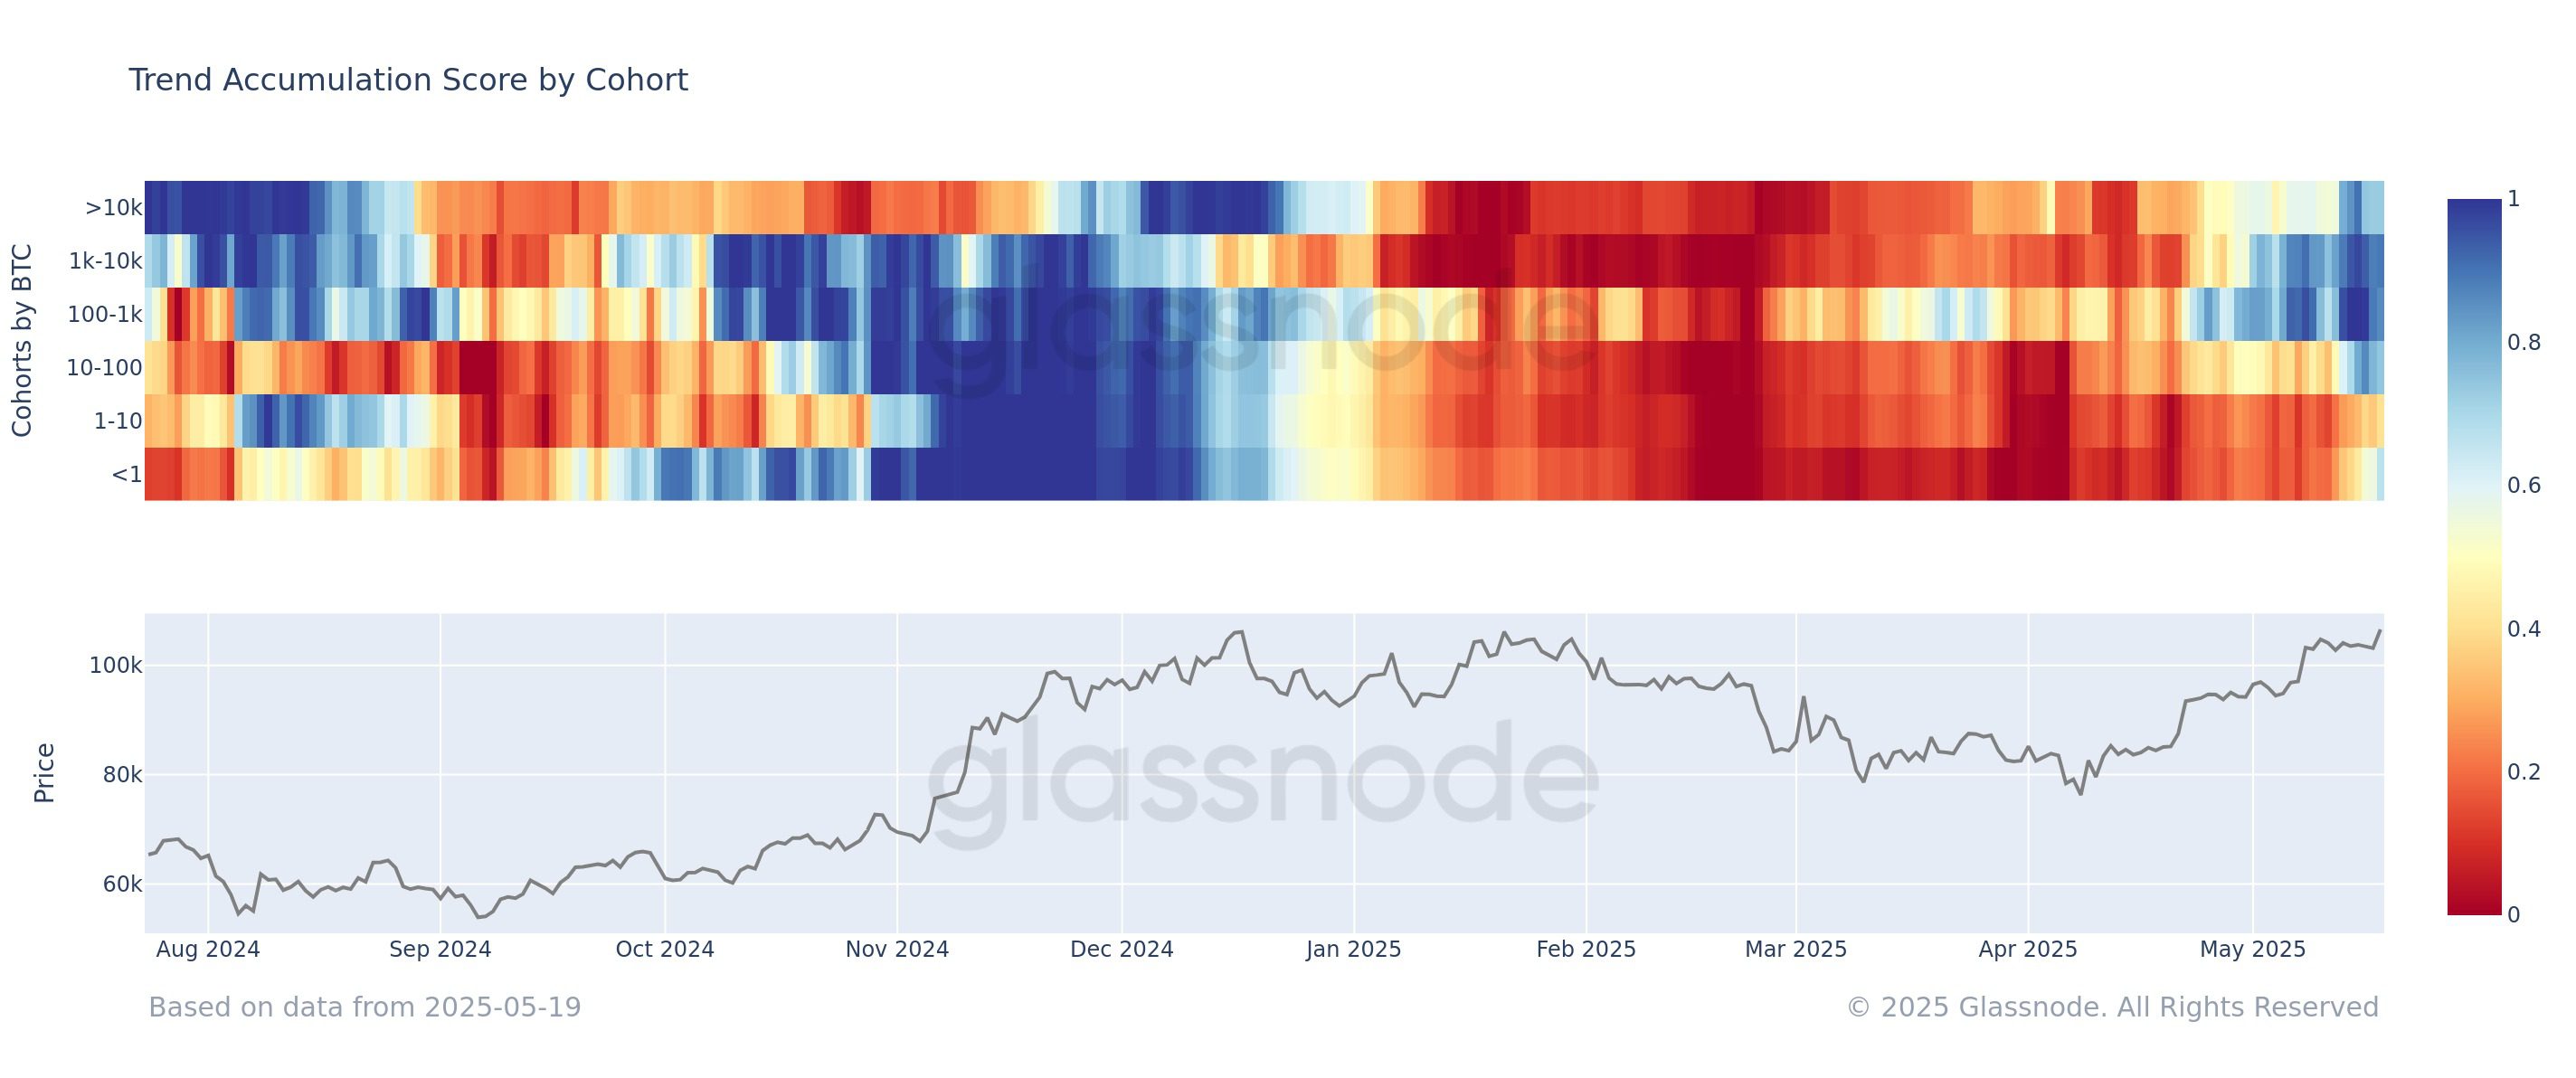
The heatmap, transitioning from blue (distribution) to red (accumulation), indicates increasing market confidence. Historically, such trends have often preceded Bitcoin price rallies.
Bearish Divergence: A Word of Caution
Despite the bullish signals, a bearish divergence on the daily chart, as pointed out by crypto analyst Bluntz, could hinder Bitcoin’s ability to reach new all-time highs. A bearish divergence occurs when the price makes a higher high, while the Relative Strength Index (RSI) forms a lower high. This suggests that buying pressure is weakening even as prices rise.
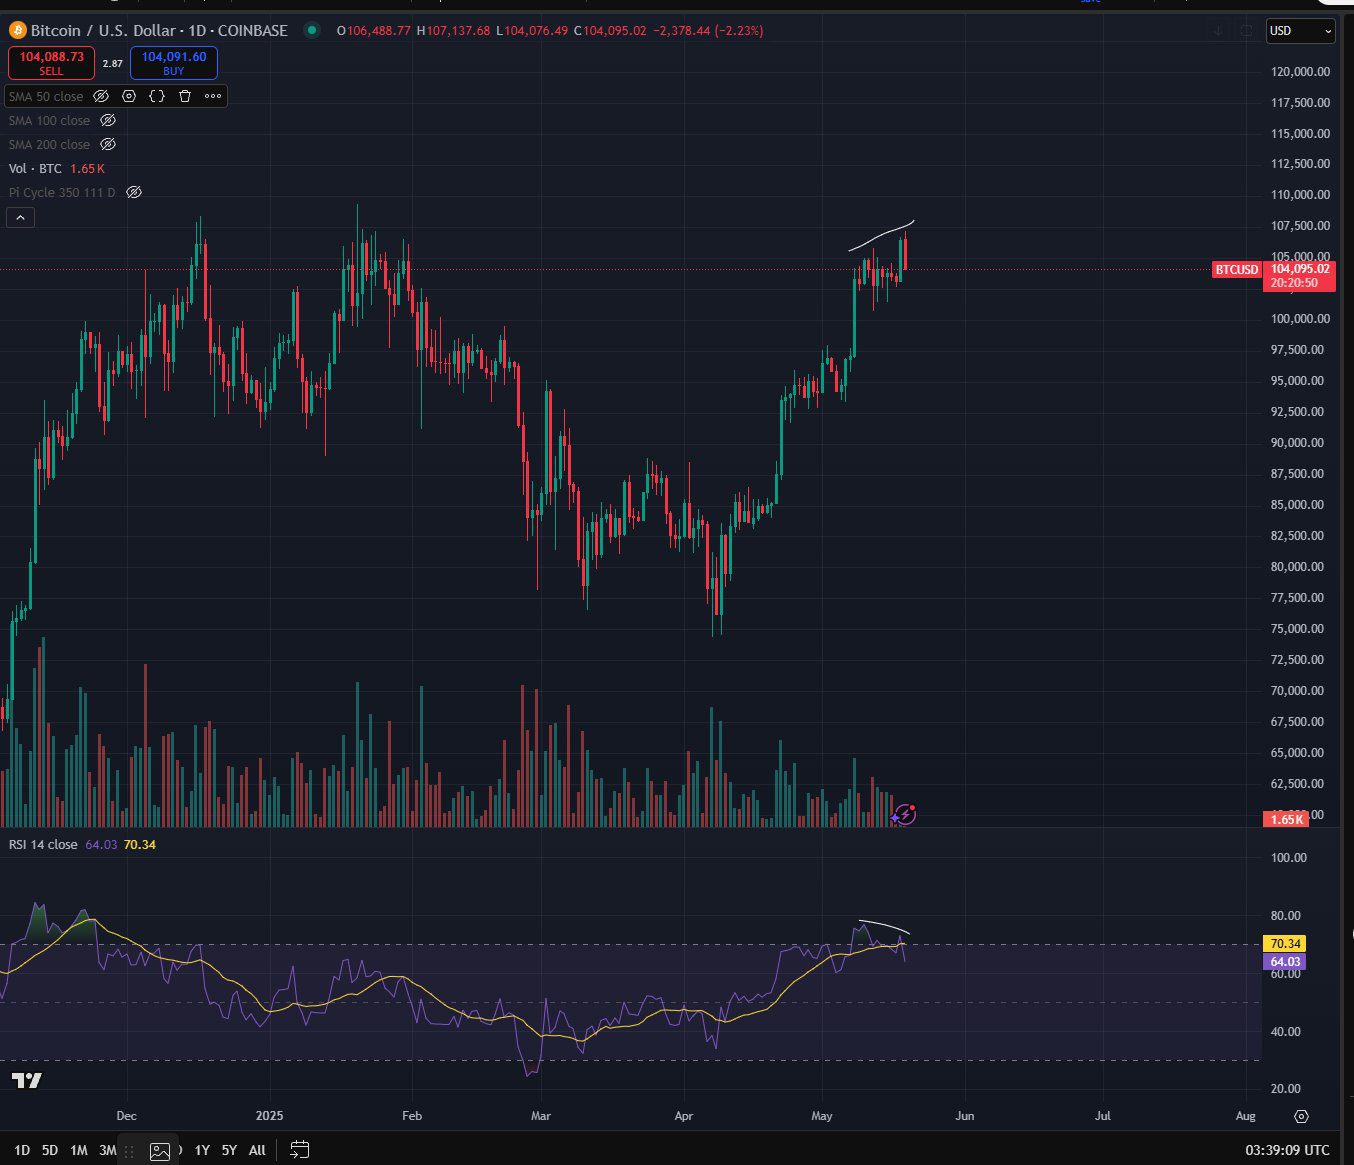
Bitcoin analyst Matthew Hyland also emphasizes the importance of pushing prices higher in the coming weeks to maintain bullish control. To avoid a confirmed weekly bearish divergence, Bitcoin needs to reach the $120,000-$130,000 range to create a higher high on the RSI.
Conclusion
Bitcoin’s price action is at a critical juncture. Fractal analysis and positive on-chain data suggest the potential for new all-time highs above $110,000. However, a bearish divergence on the daily chart serves as a reminder of potential headwinds. Investors and traders should closely monitor these factors to make informed decisions.
Disclaimer: This analysis is for informational purposes only and should not be considered as financial advice. Trading Bitcoin involves significant risk, and you could lose your entire investment.