Bitcoin (BTC) has kicked off the week with significant volatility, experiencing a breakout from its previous trading range around $103,000. This movement raises crucial questions: Was the surge to $107,000 a deceptive fakeout, or does it signal a genuine move towards new all-time highs? This analysis delves into the key factors influencing Bitcoin’s price action this week.
Key Takeaways:
- Liquidity Grab: Bitcoin’s price spiked to $107,000 before correcting, a classic liquidity grab squeezing both shorts and trapping late longs.
- Record Weekly Close: Despite the volatility, Bitcoin achieved its highest weekly close ever, signaling underlying bullish sentiment.
- Macroeconomic Factors: US trade deals and potential tariffs remain significant volatility triggers.
- Crypto-Stock Correlation: The relationship between crypto and stocks is unclear, adding uncertainty.
- Volume Delta: Analyzing Bitcoin exchange volume delta is essential to assess the sustainability of price breakouts.
Analyzing the Bitcoin Price Action
Bitcoin’s recent price action around the weekly close was marked by a rapid ascent to near $107,000, followed by a 4% correction. This move is often referred to as a “liquidity grab,” designed to exploit market participants. According to crypto analyst Michaël van de Poppe, this pattern is a classic trap, squeezing out short positions before reversing to ensnare late longs.
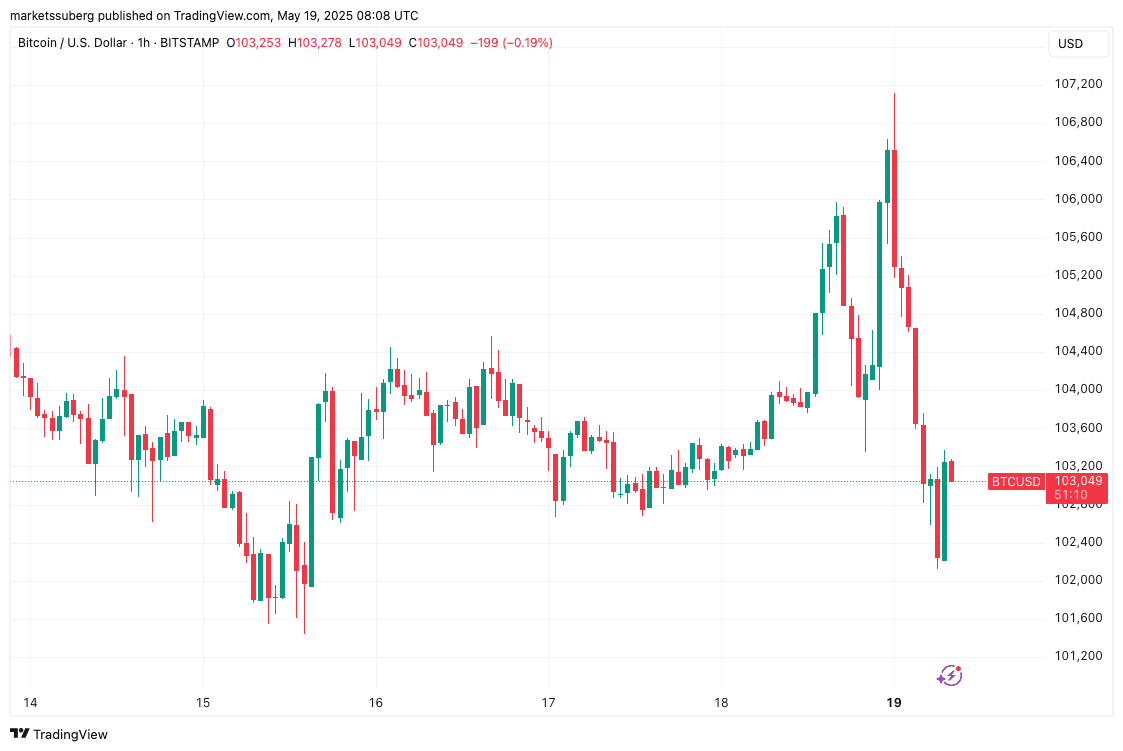
Data from CoinGlass indicated that ask liquidity was replenished at $107,500, preventing further upward movement, while bid liquidity was taken out down to $102,000. Total crypto liquidations in a 24-hour period reached $673 million, highlighting the high-stakes nature of the current market.
Trader CrypNuevo advises caution, suggesting that longing Bitcoin at current levels above $100,000 might not be worth the risk from a risk management perspective. He suggests waiting for a clear breakout above resistance for a more attractive entry point.
Bitcoin’s Record Weekly Close
Despite the rollercoaster ride, Bitcoin achieved its highest weekly close ever, settling around $106,500. This milestone reflects an underlying bullish sentiment among traders. According to trader Jelle, the red start to the week following the record close is likely a temporary dip, with the week expected to end strongly in the green.
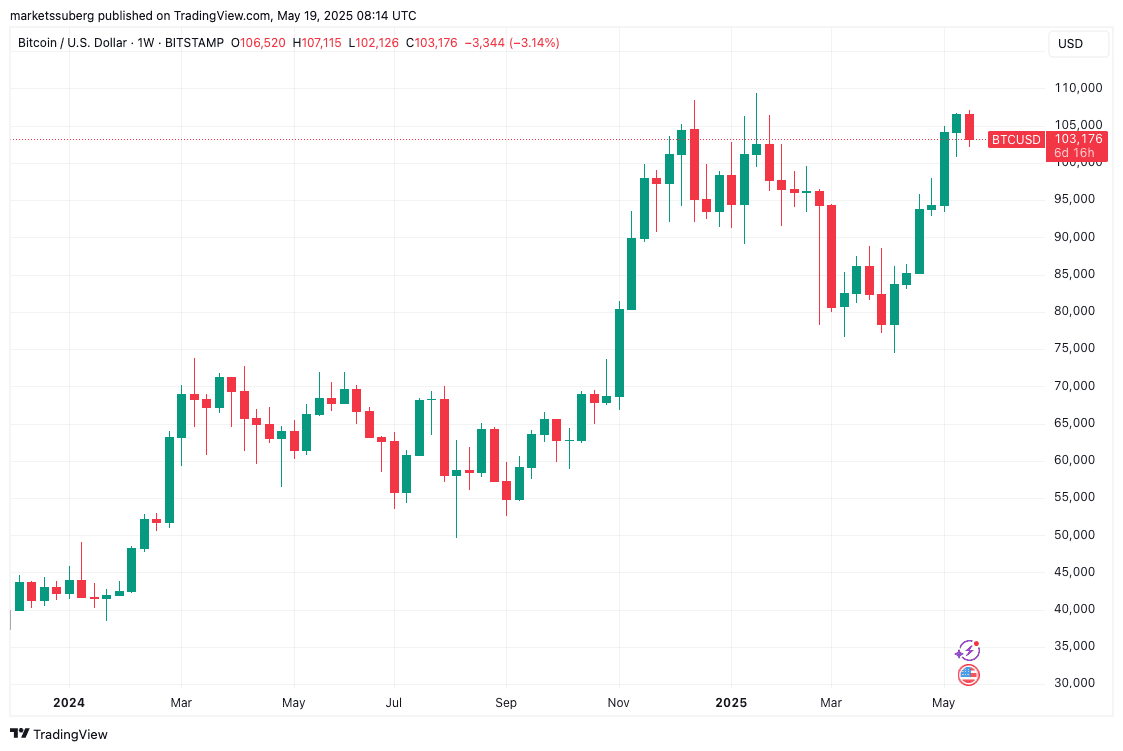
Chad noted that BTC/USD has closed above a key Fibonacci extension level for two consecutive weeks, a significant milestone. Swissblock Technologies highlighted the liquidity grab above $104K-$106K, emphasizing the importance of bulls defending the current range to maintain momentum.
Macroeconomic Influences: US Trade and the Federal Reserve
With a relatively light macroeconomic data calendar this week, focus shifts to the Federal Reserve and US trade deals. Markets are particularly sensitive to developments in trade relations between the US and its partners, especially regarding potential tariffs on non-negotiating countries. A deal with China earlier in the month triggered a positive reaction in stock markets.
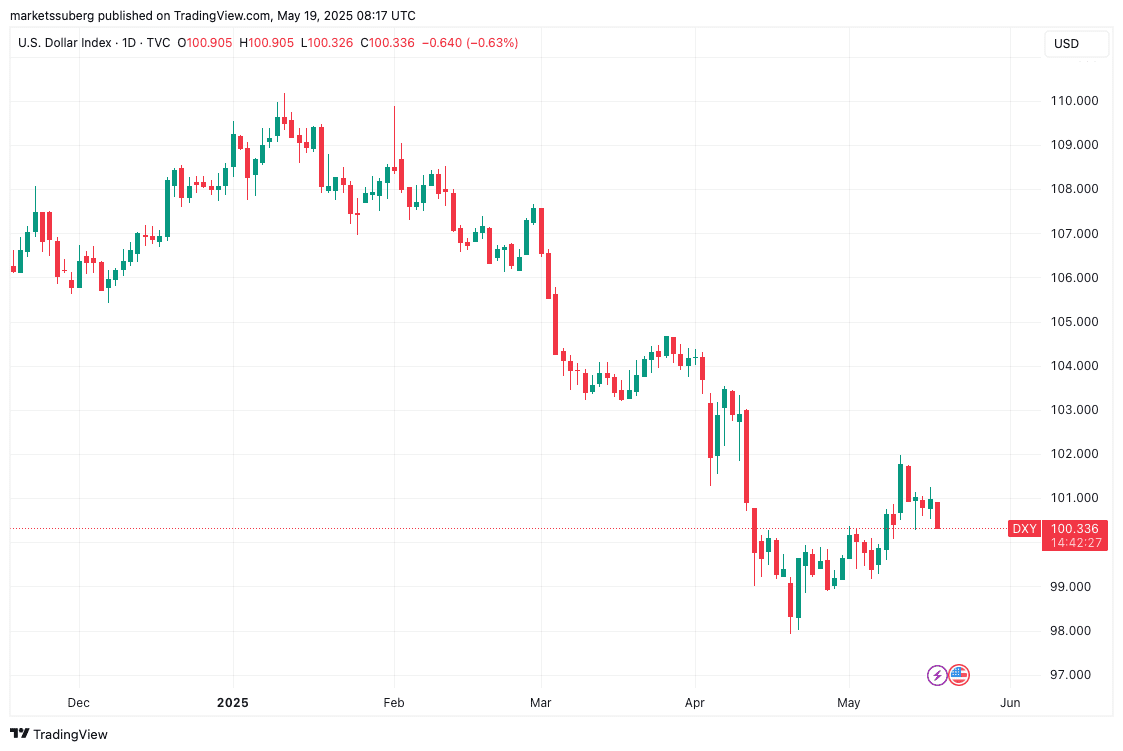
However, the recent US credit downgrade by Moody’s has put pressure on the dollar, potentially benefiting Bitcoin and other cryptocurrencies, according to The Kobeissi Letter.
Furthermore, the market’s expectation for interest rate cuts by the Federal Reserve has been pushed back to September, making crypto more resilient to hawkish cues.
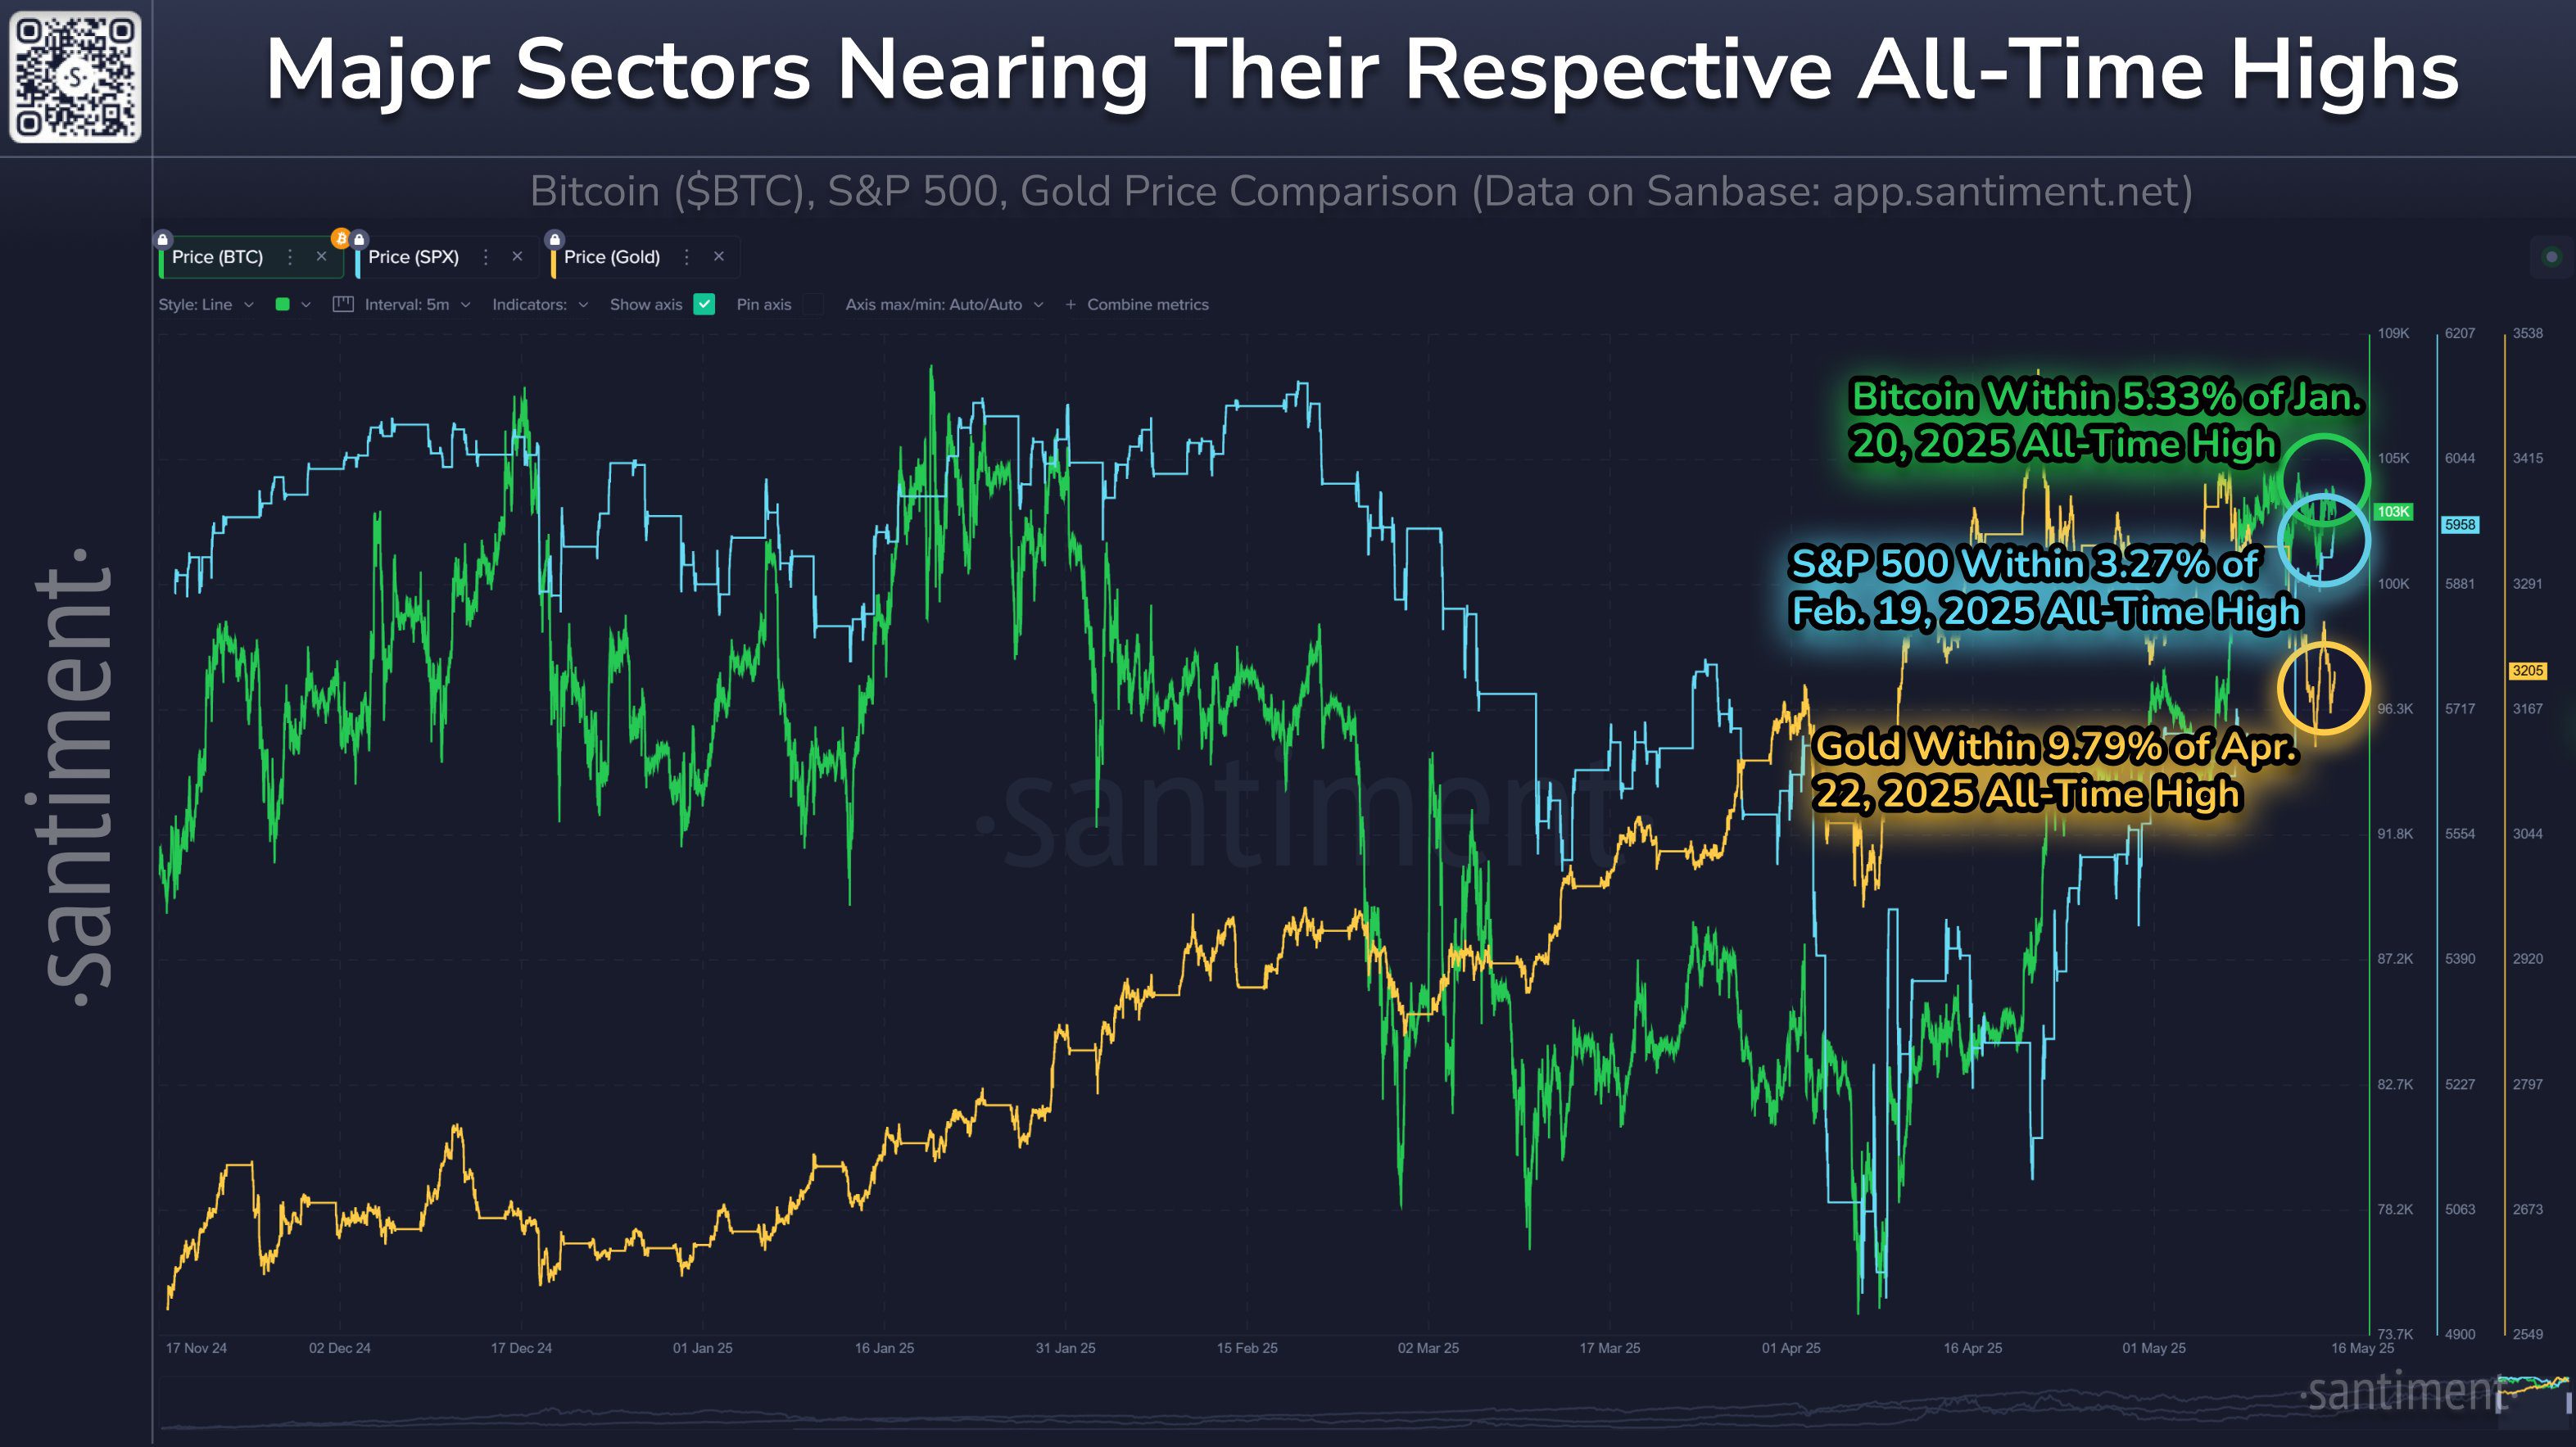
Correlation with Stocks: A Mixed Picture
The correlation between crypto and US stocks remains a topic of debate. Research firm Santiment describes the two asset classes as “somewhat correlated.” RedStone Oracles distinguishes between short-term (7-day) negative correlation and long-term (30-day) valuable correlation between Bitcoin and the S&P 500.
The market’s sensitivity to the same volatility triggers impacting stocks frustrates some participants, as they prefer Bitcoin to trade independently.
Analyzing Exchange Volume Delta
Assessing the potential for Bitcoin to enter price discovery requires an understanding of exchange order-book behavior. CryptoQuant highlights the importance of volume delta, particularly on Binance, as a key ingredient for sustained price movements.
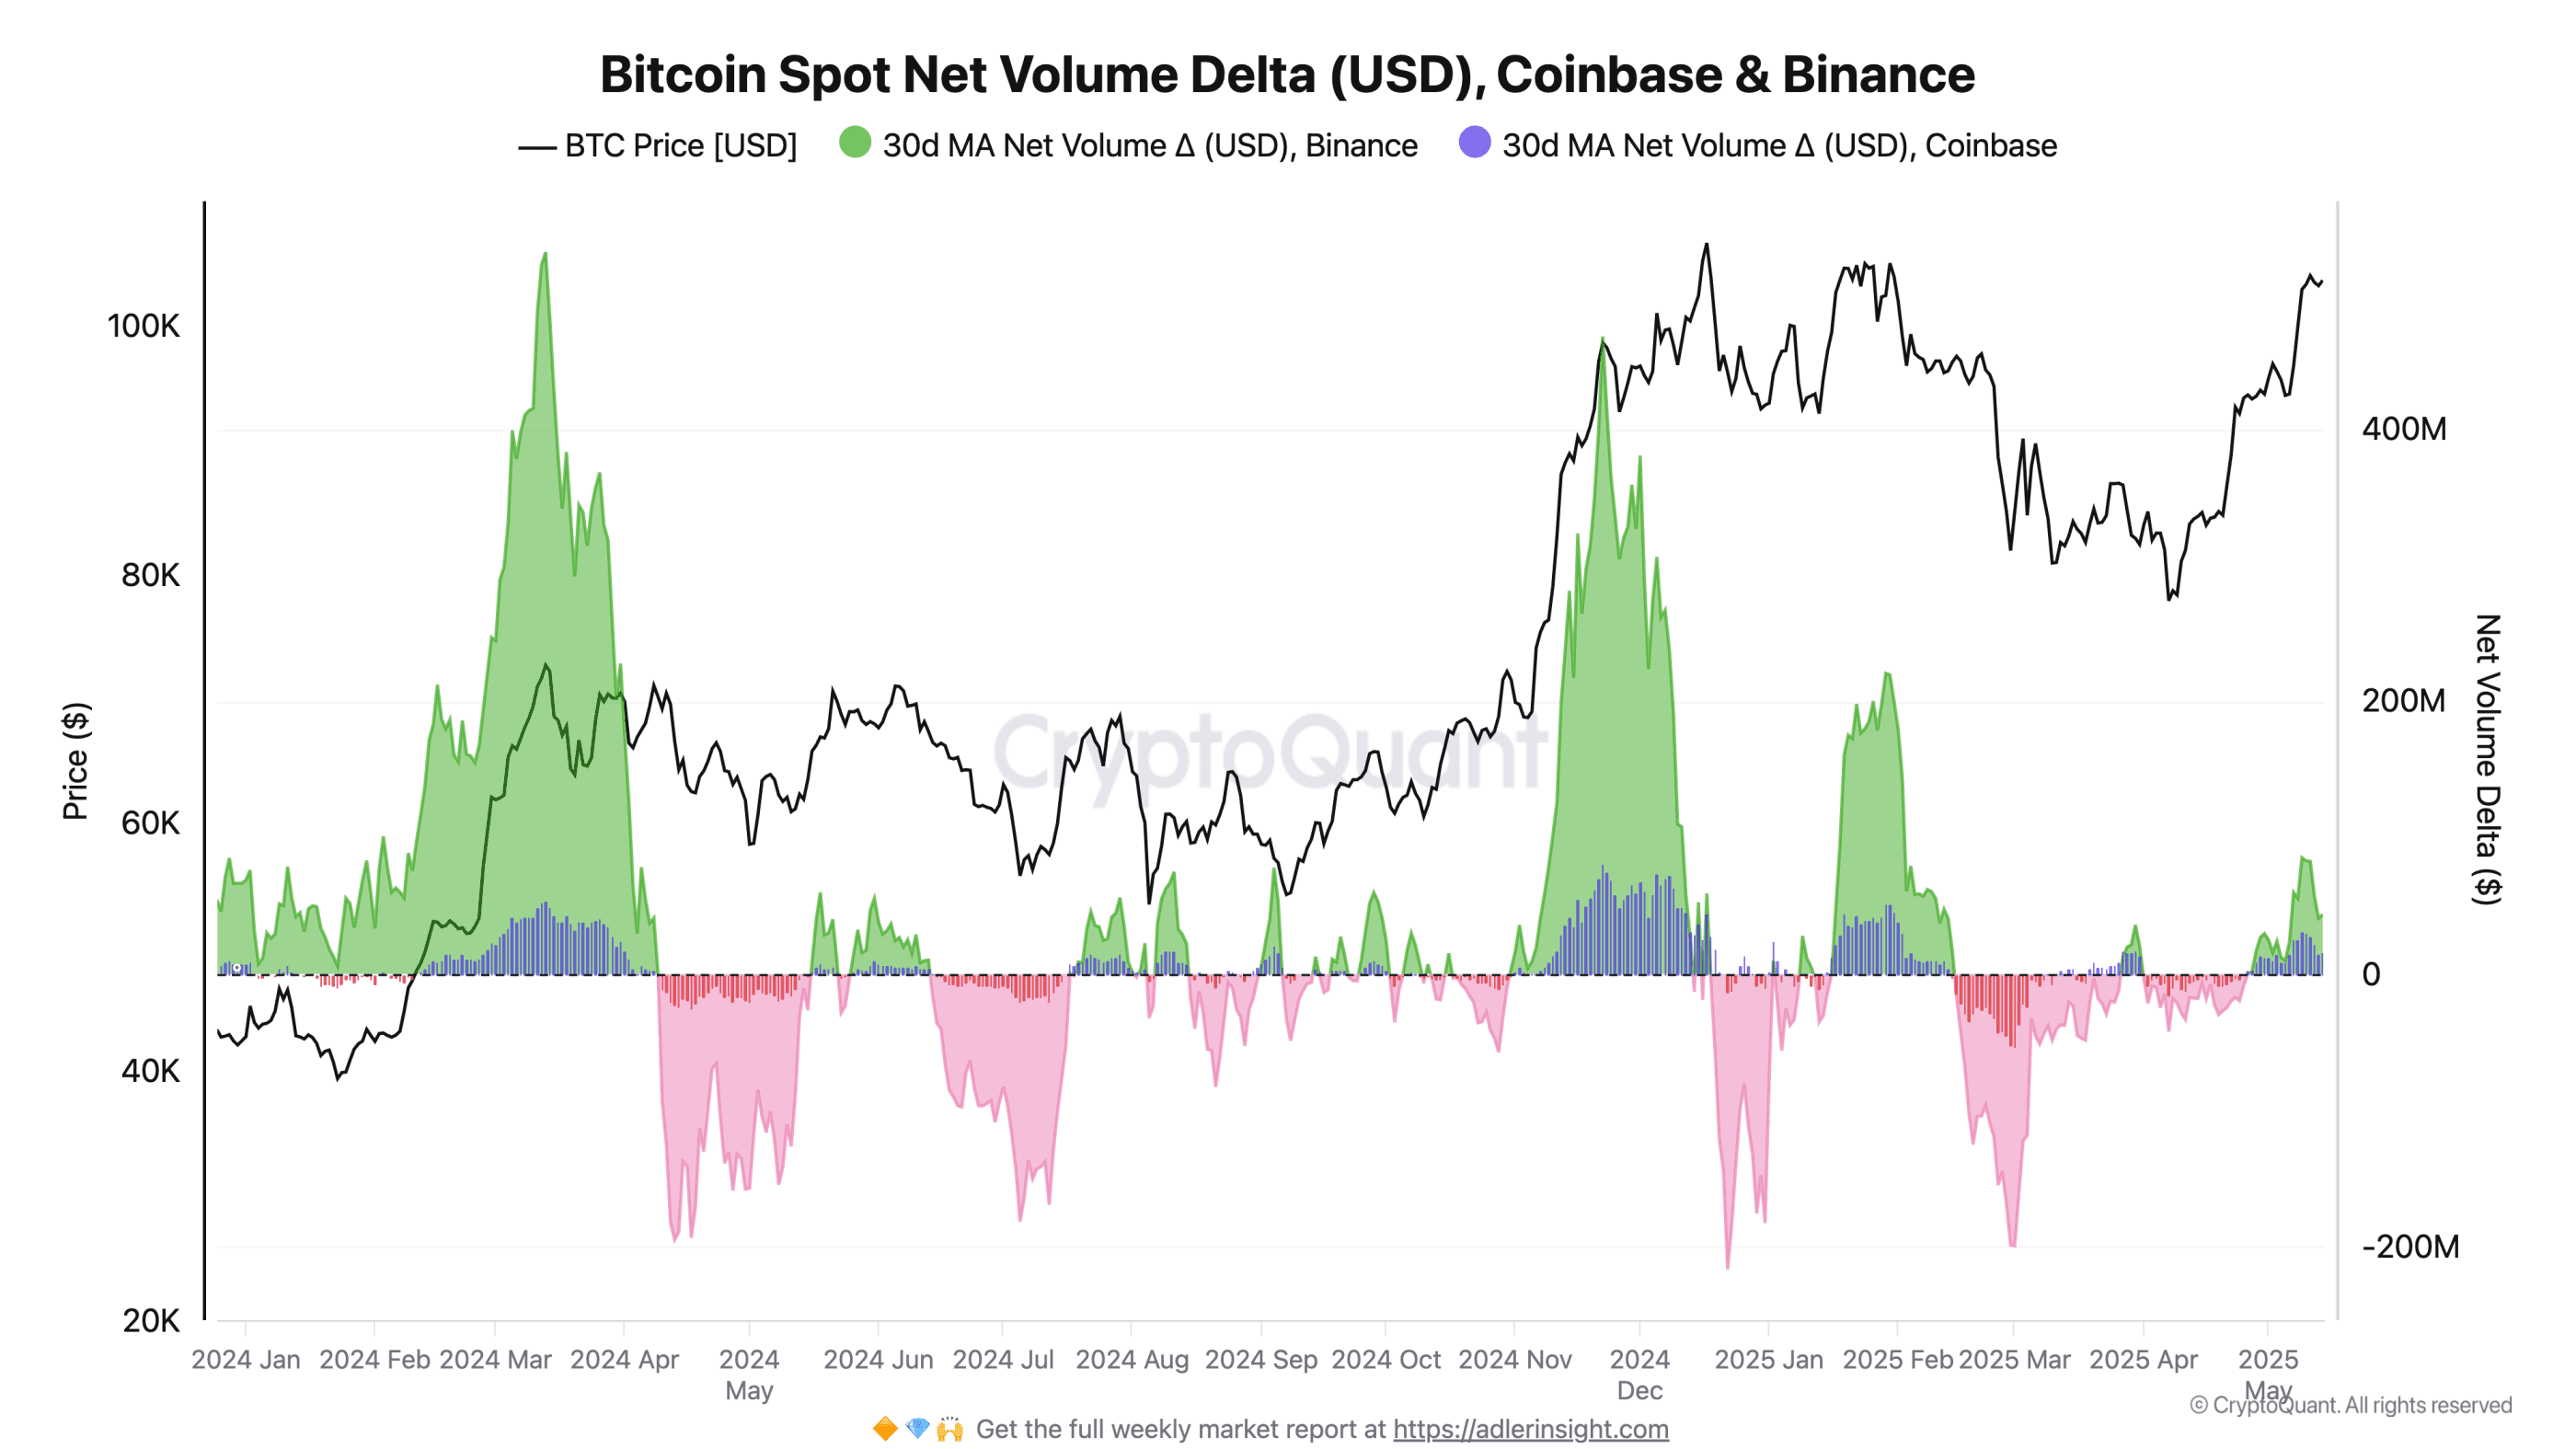
A positive spot net volume delta indicates that buying activity is increasing and selling pressure is declining. However, a rapid increase in spot volumes can also coincide with local market tops. Monitoring volume delta provides valuable insights into investor behavior and helps avoid disadvantageous market entries.
In conclusion, this week in Bitcoin presents a mix of opportunities and risks. Understanding the technical indicators, macroeconomic influences, and market sentiment is crucial for making informed decisions.