Bitcoin (BTC) experienced a significant drop, raising concerns among investors about a potential price breakdown. This analysis delves into the technical factors contributing to the recent downturn and identifies crucial support levels to monitor.
Key Takeaways:
- Bitcoin’s recent 4.5% drop confirms a bearish divergence, signaling potential weakness.
- Analysts highlight the $97,000–$98,500 range as a critical support level that bulls must defend.
- An inverse head-and-shoulders pattern suggests a possible retest of $91,000 before any potential bullish recovery.
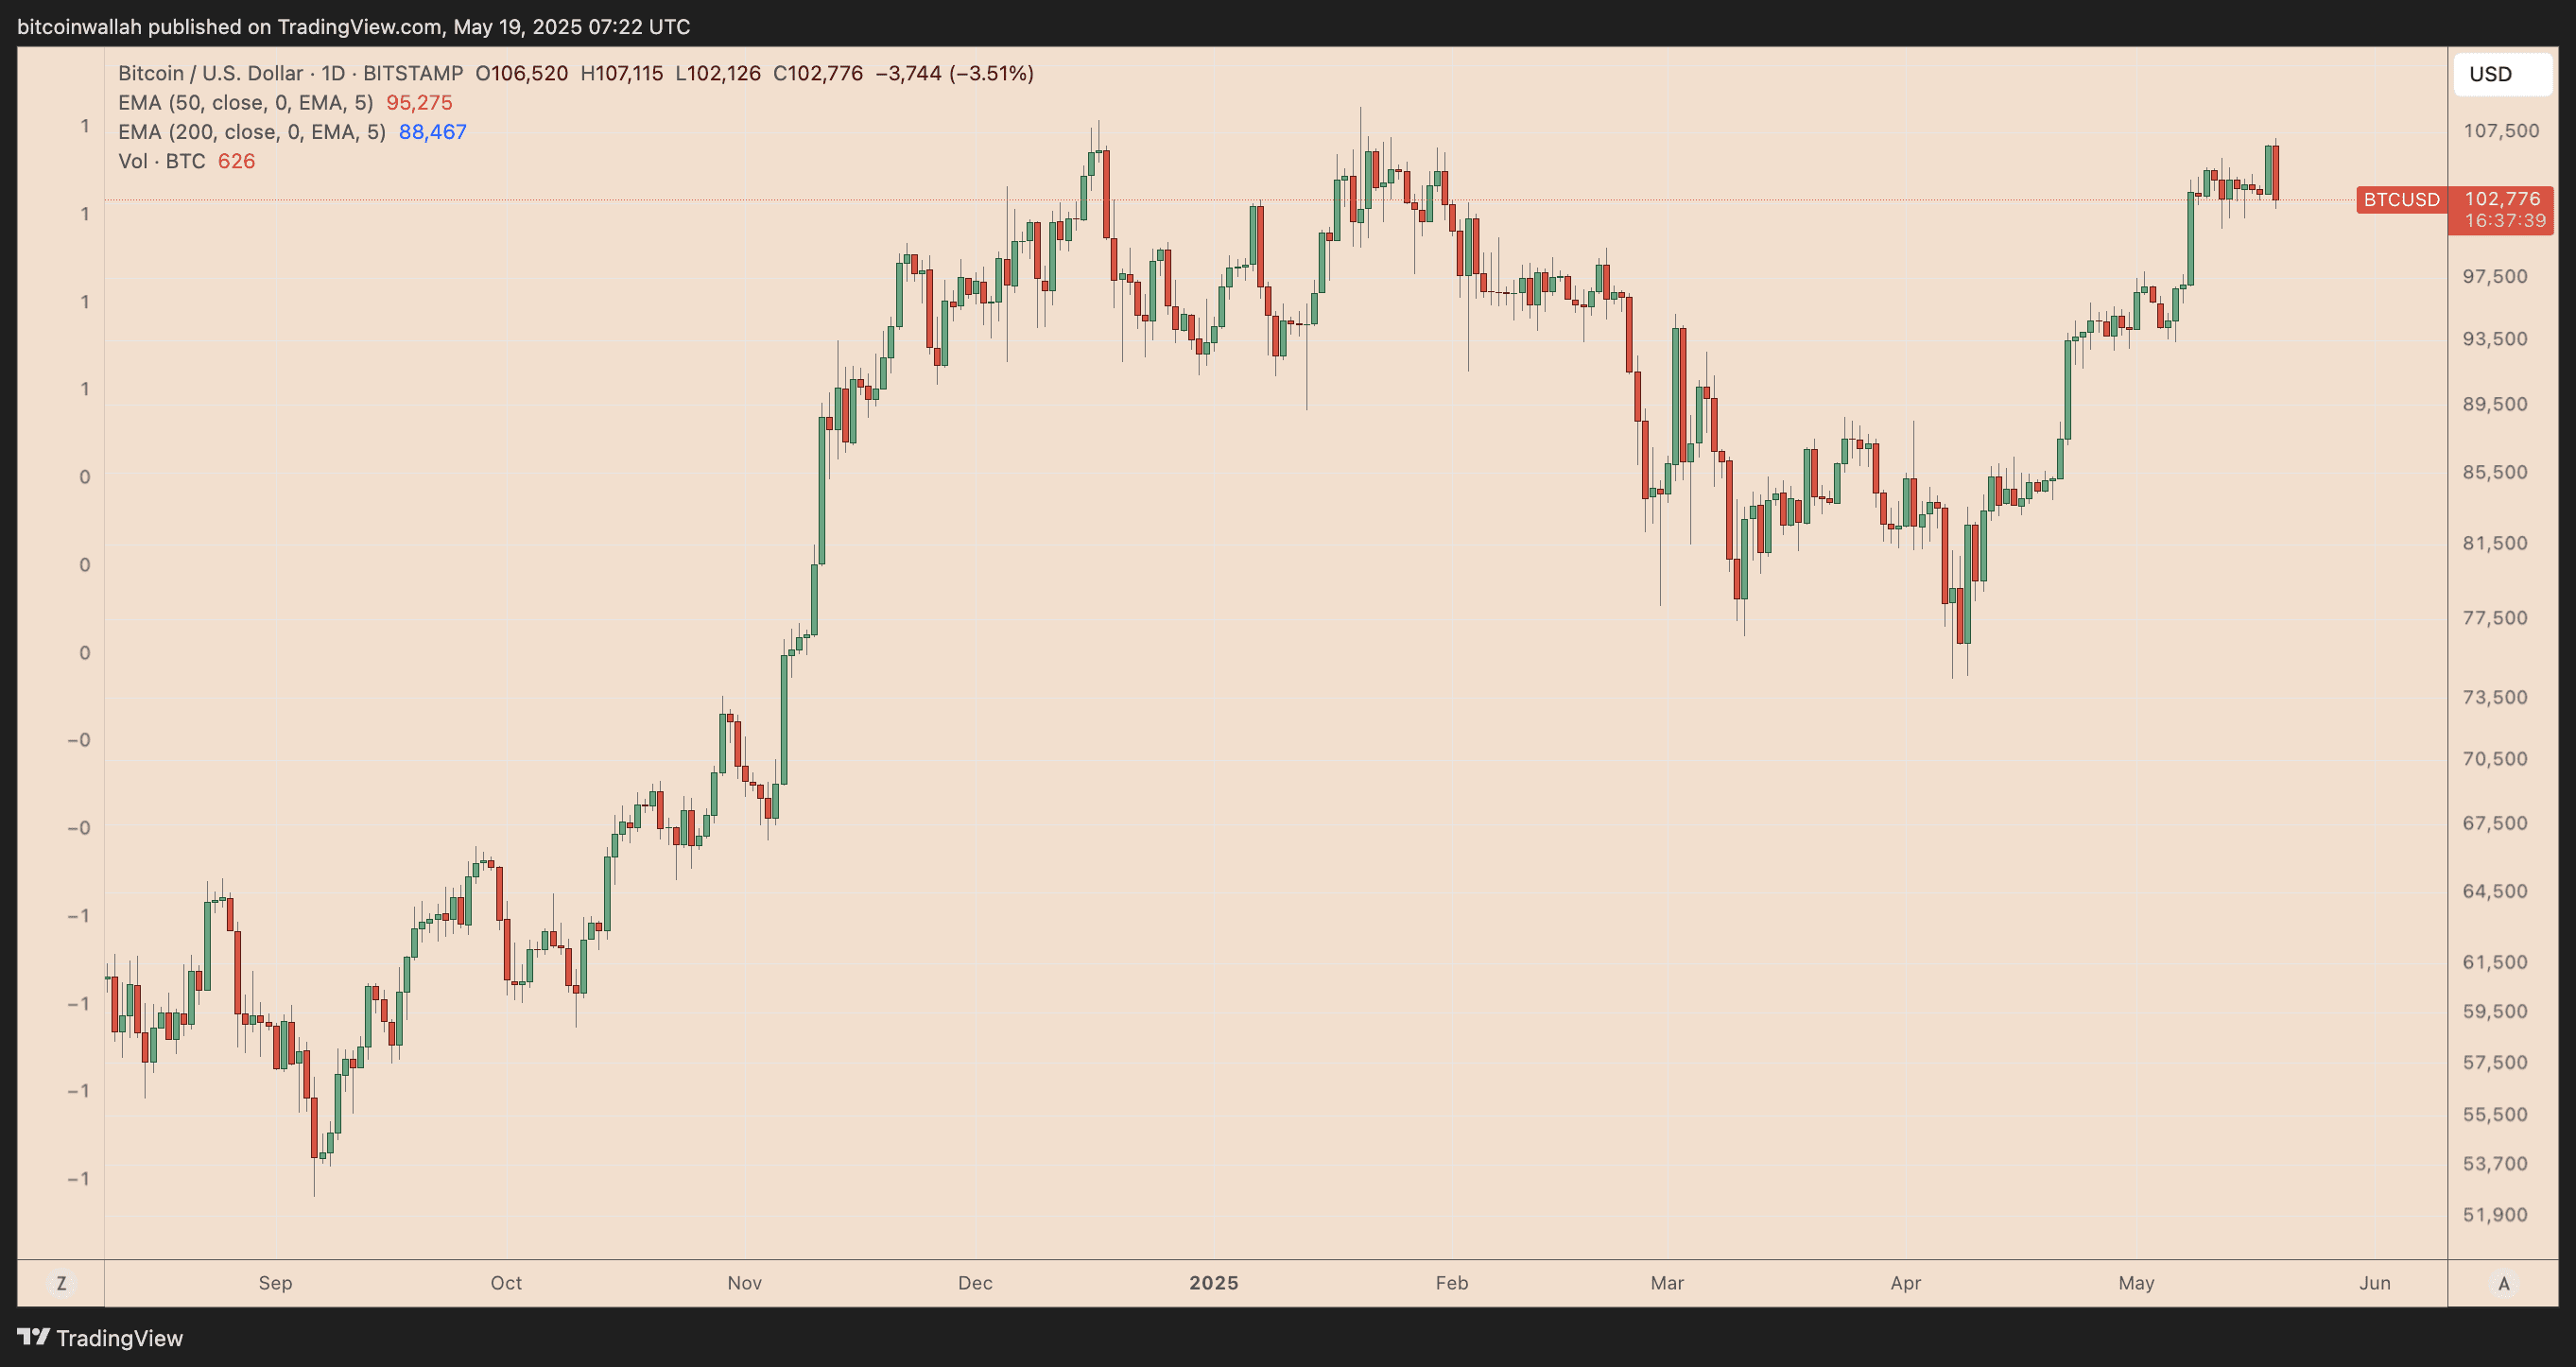
Bitcoin’s price dipped over 4.5% on May 19th, reaching approximately $102,000. This decline represents the most significant daily drop in over a month, triggering concern among investors.
The price movement coincided with broader market anxieties, potentially triggered by Moody’s downgrade of the U.S. government’s credit rating. The downgrade, stemming from concerns about the rising budget deficit, impacted risk assets across the board.
The recent decline confirms a bearish divergence, increasing the likelihood of Bitcoin breaching the $100,000 support level. Understanding the factors contributing to this potential breakdown is crucial for investors.
Analyzing the Bearish Divergence:
Prior to the sell-off, Bitcoin displayed technical vulnerabilities. While the price reached a new local high above $107,000, the relative strength index (RSI) registered a lower high. This discrepancy, known as a bearish divergence, often indicates a potential trend reversal.
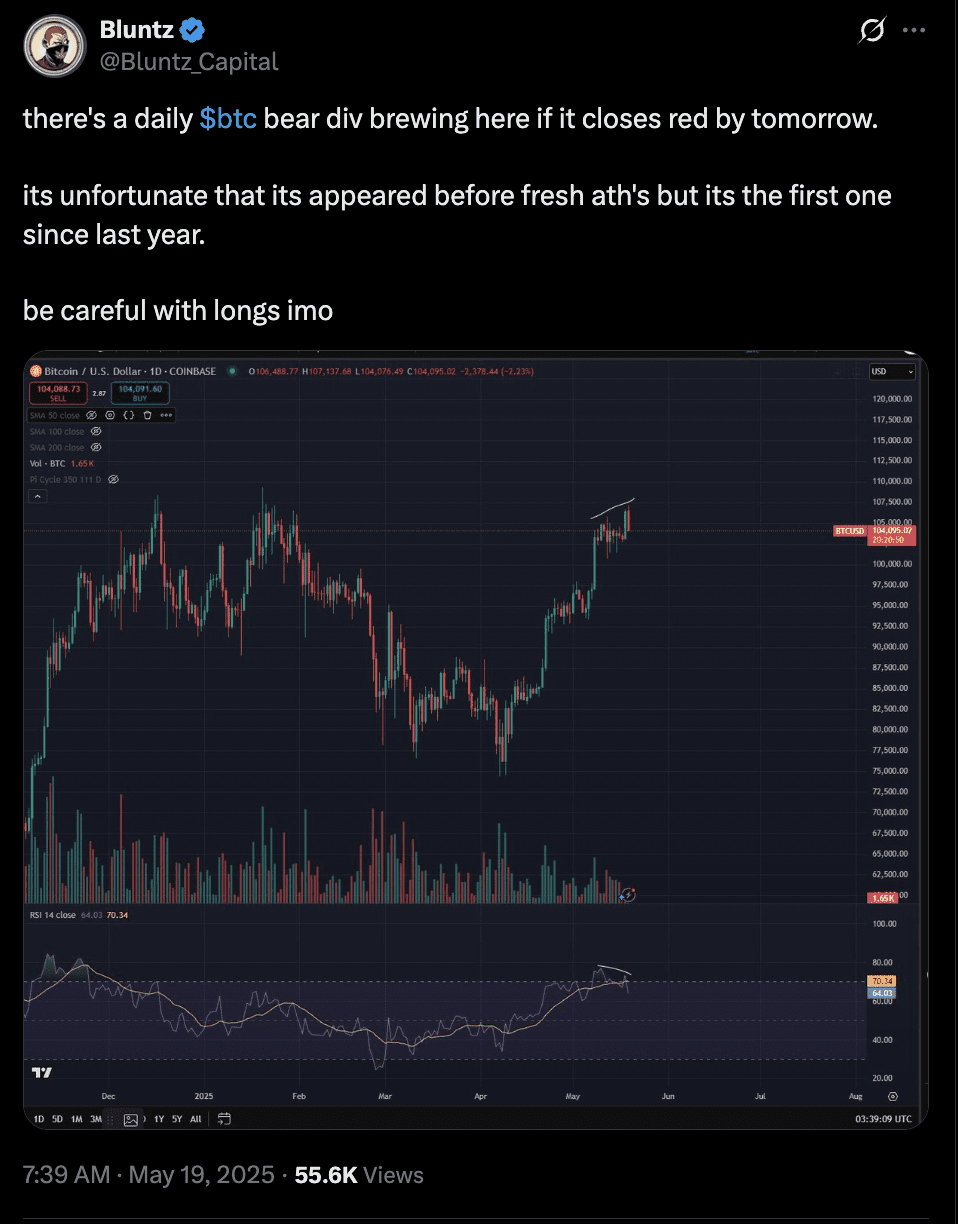
Analyst Bluntz cautioned traders about potential long positions, recognizing the emerging weakness in Bitcoin’s price action. The subsequent 4.5% intraday drop validated these concerns.
Swissblock analysts observed that Bitcoin briefly surpassed the $104,000–$106,000 resistance range but failed to maintain the breakout. This rejection pushed the price back into a zone with substantial trading volume, placing immediate support between $101,500 and $102,500 under pressure.
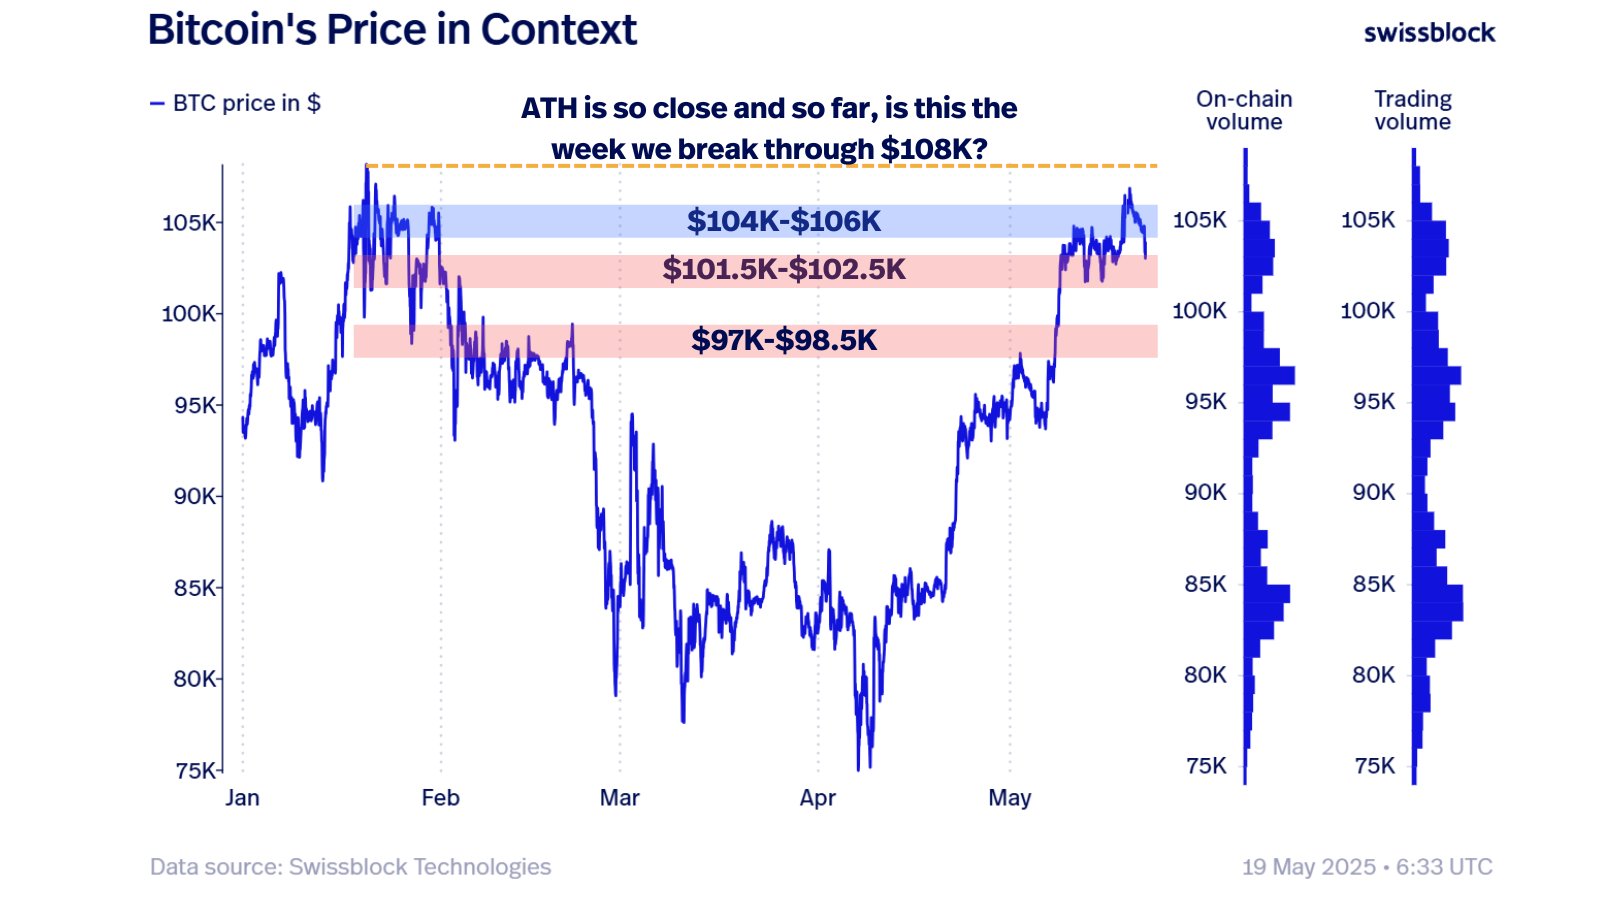
According to Swissblock, the $97,000–$98,500 range represents a critical downside target based on historical on-chain volume and trading activity. A failure to hold the $101,500-$102,500 area could trigger a further decline to this level.
Inverse Head and Shoulders Pattern and Potential Retest:
Examining the three-day chart reveals a potential inverse head-and-shoulders pattern. Although typically bullish in the long term, this pattern suggests a short-term retest of the 50-period exponential moving average (EMA), situated near $91,000.
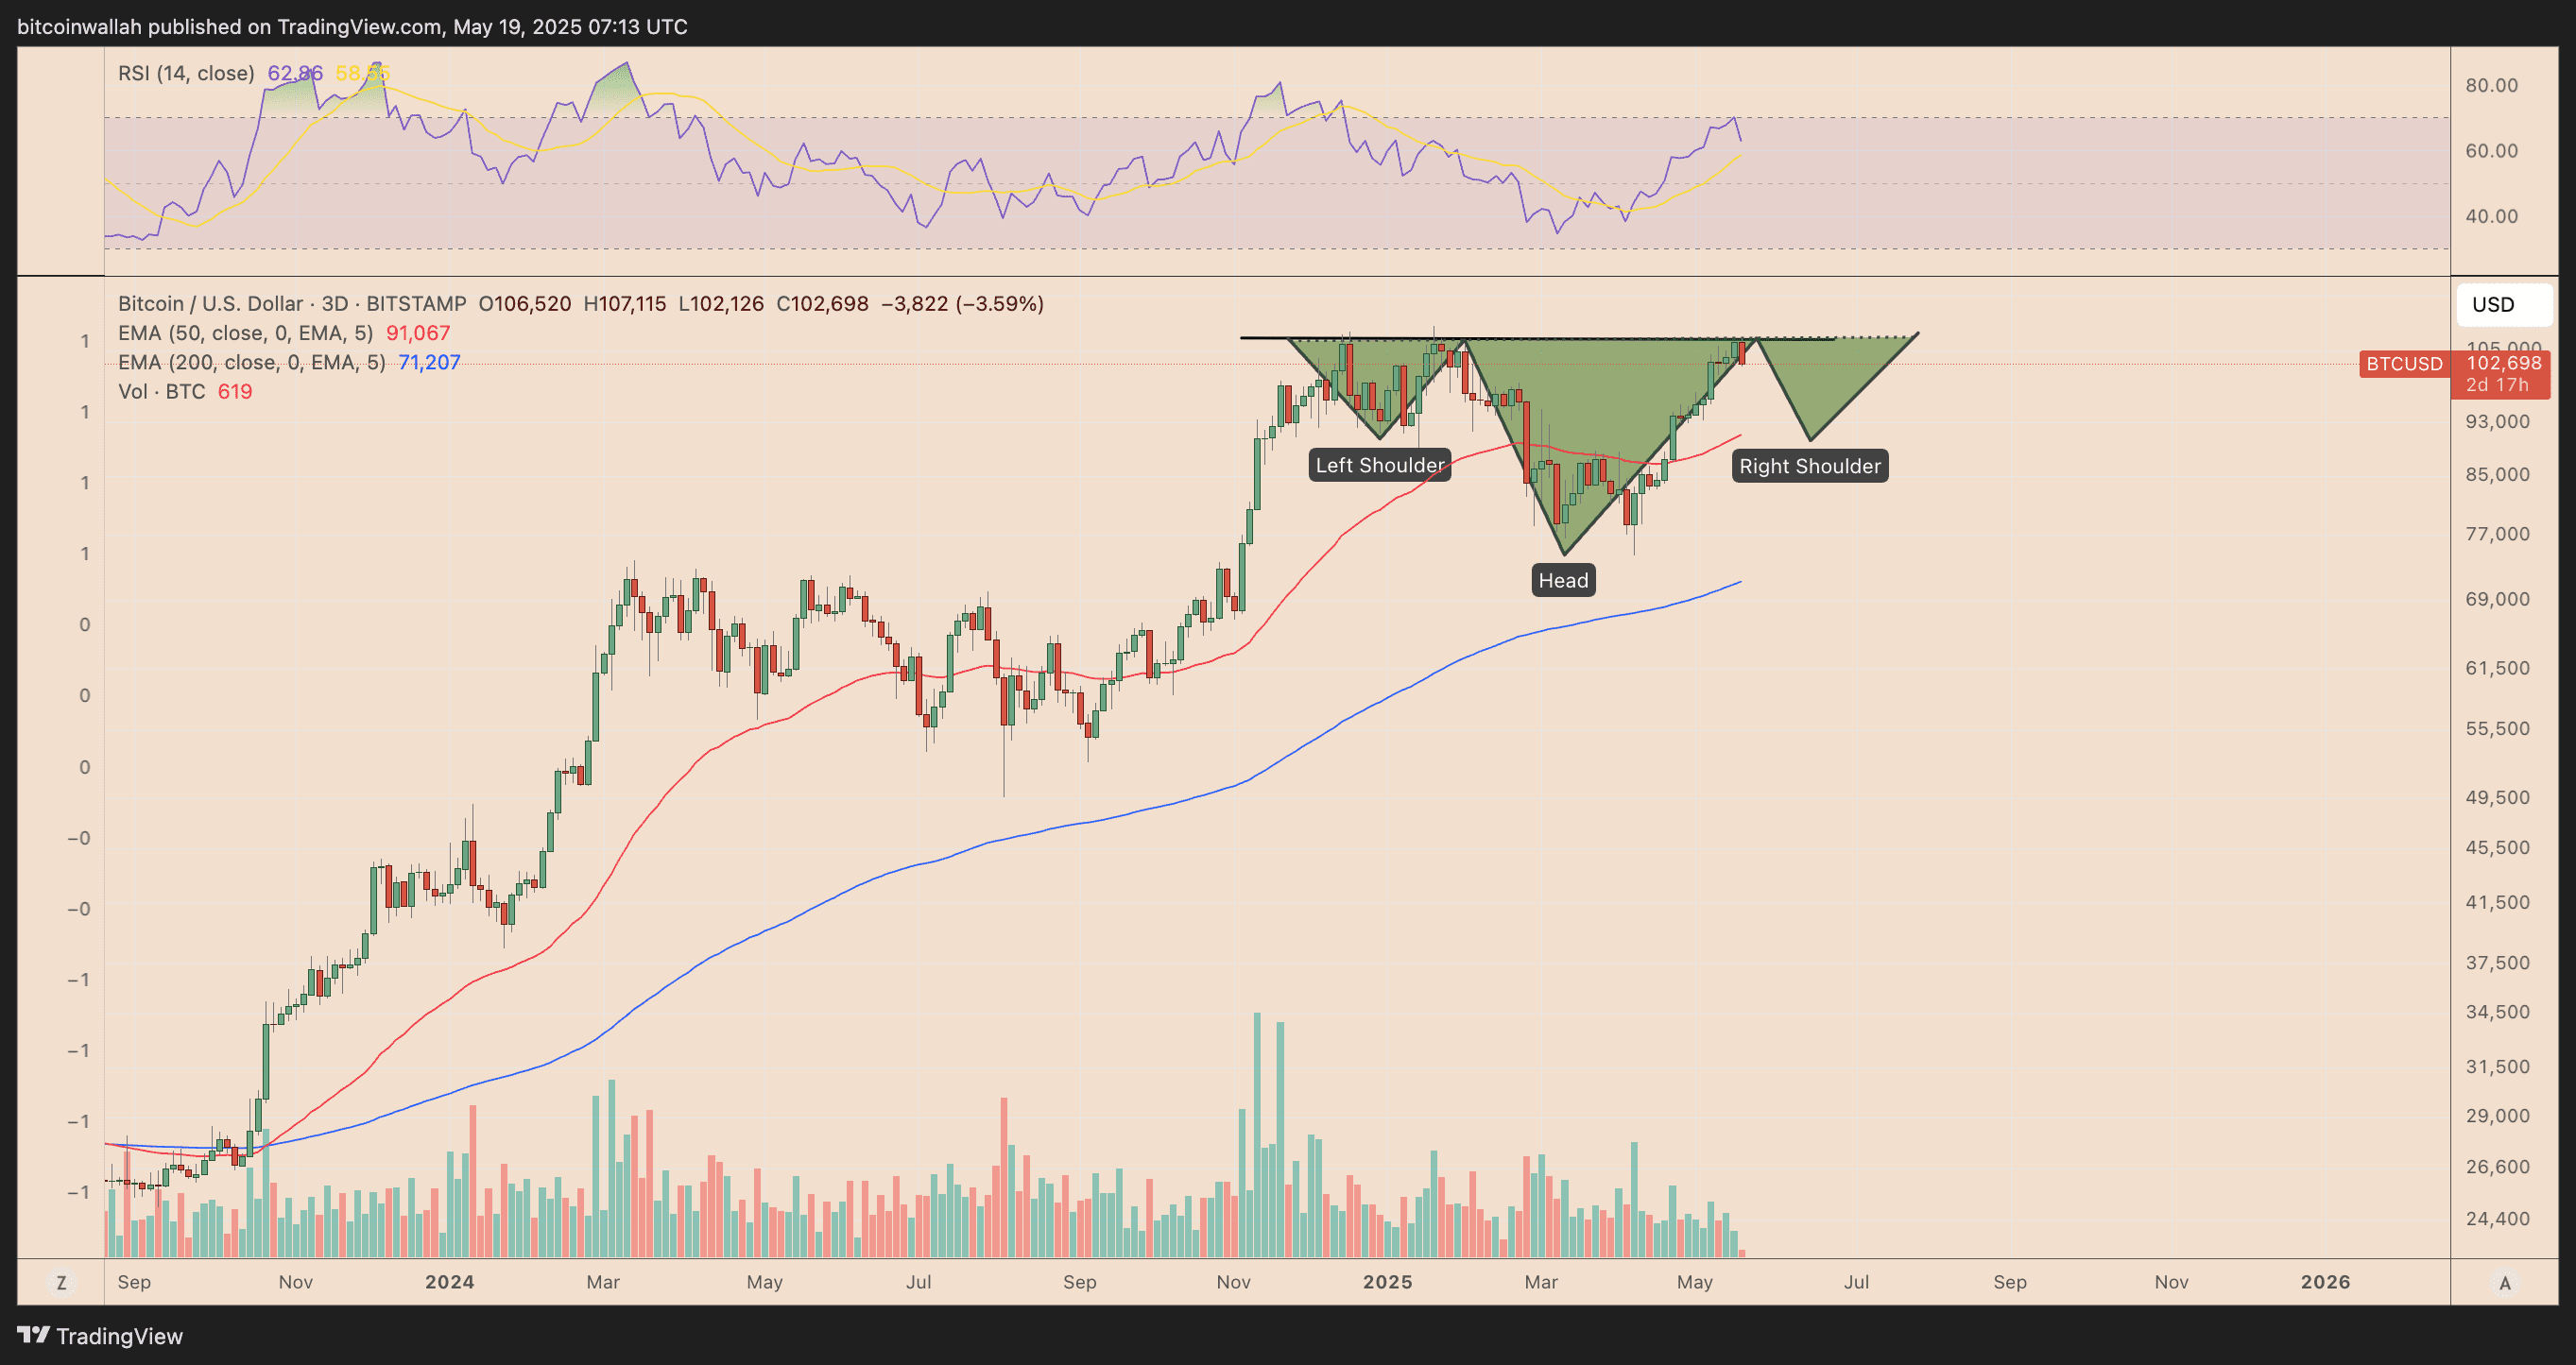
The probability of such a decline has increased due to Bitcoin’s inability to close above the $107,000 neckline. This zone previously triggered bearish reversals in December 2024 and January 2025, adding further weight to the current concerns.
What does this mean for Bitcoin’s future? If Bitcoin rebounds from the $91,000 zone toward the $107,000 neckline, it could potentially increase the odds of a rally towards $150,000. However, failure to hold critical support levels could lead to further downside.
Expert Opinions: Multiple analysts have highlighted the importance of monitoring these key support and resistance levels to gauge Bitcoin’s short-term trajectory. Keeping a close eye on these levels will be crucial for making informed investment decisions.
Broader Market Context: External factors, such as macroeconomic developments and regulatory announcements, can also significantly impact Bitcoin’s price. Investors should remain aware of these broader trends and consider their potential influence on the cryptocurrency market.
In Conclusion: The recent bearish signals in Bitcoin’s price action warrant caution. While the long-term outlook may remain positive, understanding the short-term risks and monitoring key support levels are essential for navigating the current market environment. The $97,000-$98,500 range, and potentially $91,000, are levels to watch closely.