Bitcoin Price Analysis: Is the Bull Run Exhausted?
Bitcoin (BTC) has recently reached all-time highs, sparking debate among traders about the sustainability of its bull run. While some celebrate the price discovery, others are bracing for a significant pullback. This analysis delves into the key indicators suggesting a potential correction and explores expert opinions on future price movements.
Key Takeaways:
- Bitcoin’s all-time highs are met with skepticism, with many anticipating a price correction.
- Analysts point to overbought conditions and historical patterns suggesting a pullback.
- Predictions vary, with some forecasting a return to $69,000, while others see support levels between $90,000 and $105,000.
- Increased institutional investment may influence price performance differently compared to previous cycles.
Technical Indicators Suggesting a Correction:
Several technical indicators suggest that Bitcoin may be due for a correction:
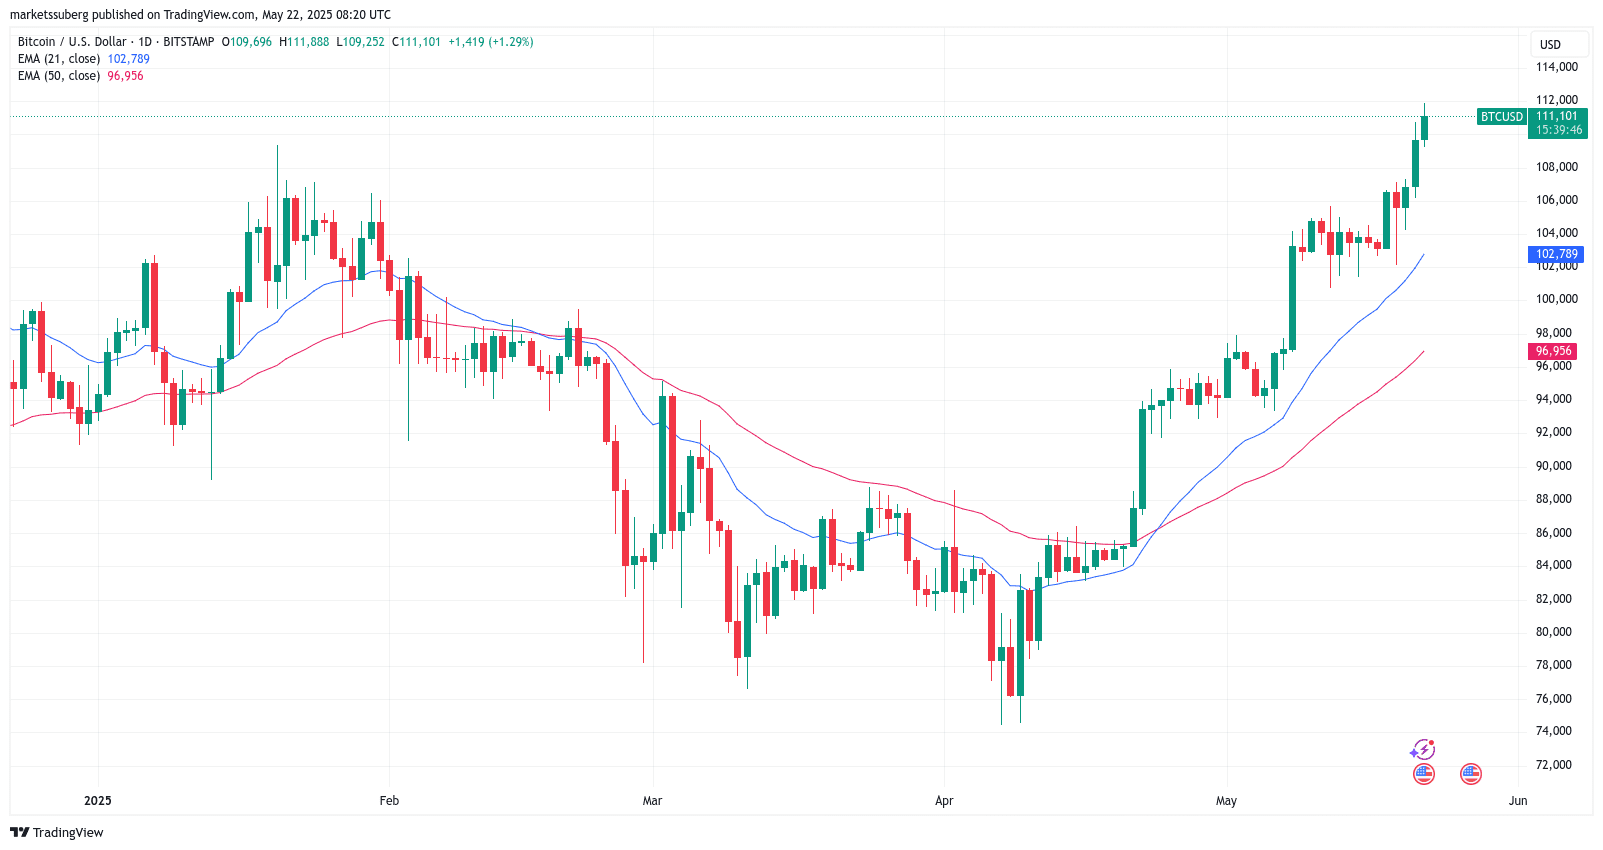
- Exponential Moving Averages (EMAs): Trader Crypto Chase highlights that Bitcoin’s price has deviated significantly from its EMAs, a pattern historically followed by pullbacks.
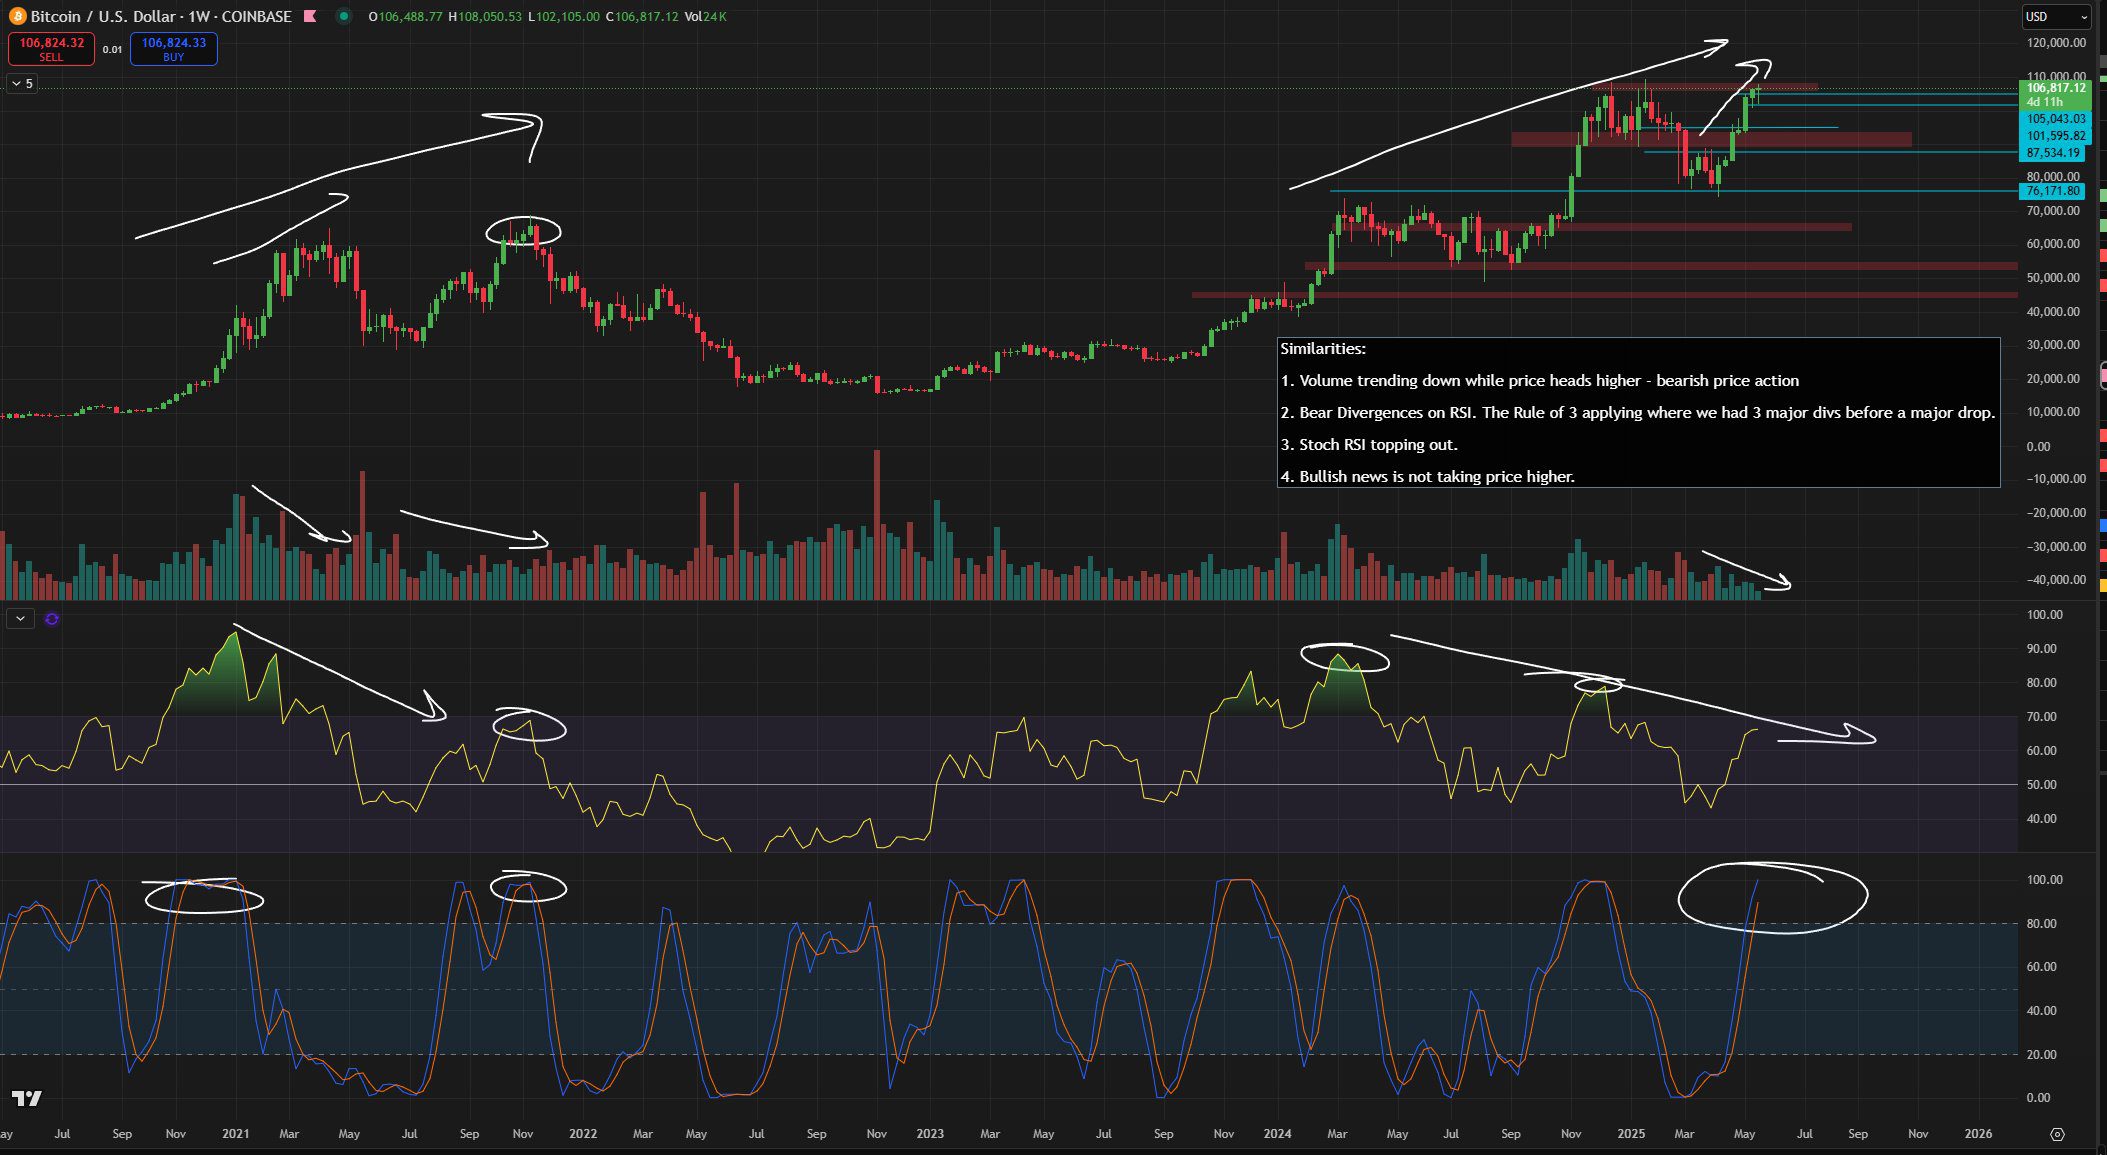
- Relative Strength Index (RSI): Trader Roman points to bearish divergences in the RSI, indicating that Bitcoin is “looking exhausted.”
Expert Opinions and Price Targets:
- Stockmoney Lizards: Their roadmap from late 2023 anticipates a cycle peak in Q4 of this year, followed by a bear market taking BTC back to $69,000.
- Various Traders: Support targets range from $105,000 to $90,000, reflecting a belief that the bull market is losing momentum.
The Role of Institutional Investment:
The current Bitcoin bull run differs from previous cycles due to increased institutional investment. This influx of capital could potentially mitigate the severity of price corrections and skew price performance in favor of bulls. However, the overall impact of these large players remains to be seen.
Potential Scenarios:
- Bearish Scenario: A significant price correction to the $69,000 level, driven by overbought conditions and historical patterns.
- Consolidation Scenario: A pullback to support levels between $90,000 and $105,000, followed by a period of consolidation.
- Bullish Scenario: Continued upward momentum, potentially driven by institutional investment, leading to new all-time highs.
Analyzing Previous Bitcoin Cycles
To understand the current market sentiment, it’s helpful to look at previous Bitcoin cycles. Historically, Bitcoin has experienced significant bull runs followed by sharp corrections. These cycles are often driven by a combination of factors, including:
- Halving Events: The Bitcoin halving, which occurs approximately every four years, reduces the rate at which new bitcoins are created. This scarcity can drive up demand and lead to price increases.
- Market Sentiment: Positive news and increased adoption can fuel bull runs, while negative news and regulatory uncertainty can trigger corrections.
- Macroeconomic Factors: Interest rates, inflation, and other macroeconomic factors can also influence Bitcoin’s price.
However, it’s important to note that past performance is not always indicative of future results. The increasing presence of institutional investors and the growing maturity of the cryptocurrency market may lead to different outcomes in the current cycle.
Disclaimer
This analysis is for informational purposes only and does not constitute financial advice. Trading Bitcoin and other cryptocurrencies involves significant risk, and you could lose money. Always do your own research before making any investment decisions.