Key Takeaways:
- Bitcoin’s realized cap has increased by $30 billion since April 20, indicating strong investor confidence.
- A recurring price consolidation pattern suggests a potential 10% breakout in the coming days.
- Increased spot buying pressure points to institutional and retail investors driving the recent rally.
Bitcoin (BTC) is showing significant bullish momentum, fueled by substantial capital inflows. These inflows suggest the potential for new all-time highs in the near future. According to Glassnode, Bitcoin’s Realized Cap, which reflects the total value of BTC based on the price at which each coin was last moved, has risen by $30 billion since April 20, growing at a 3% monthly rate in May. The current realized cap stands at $900 billion.
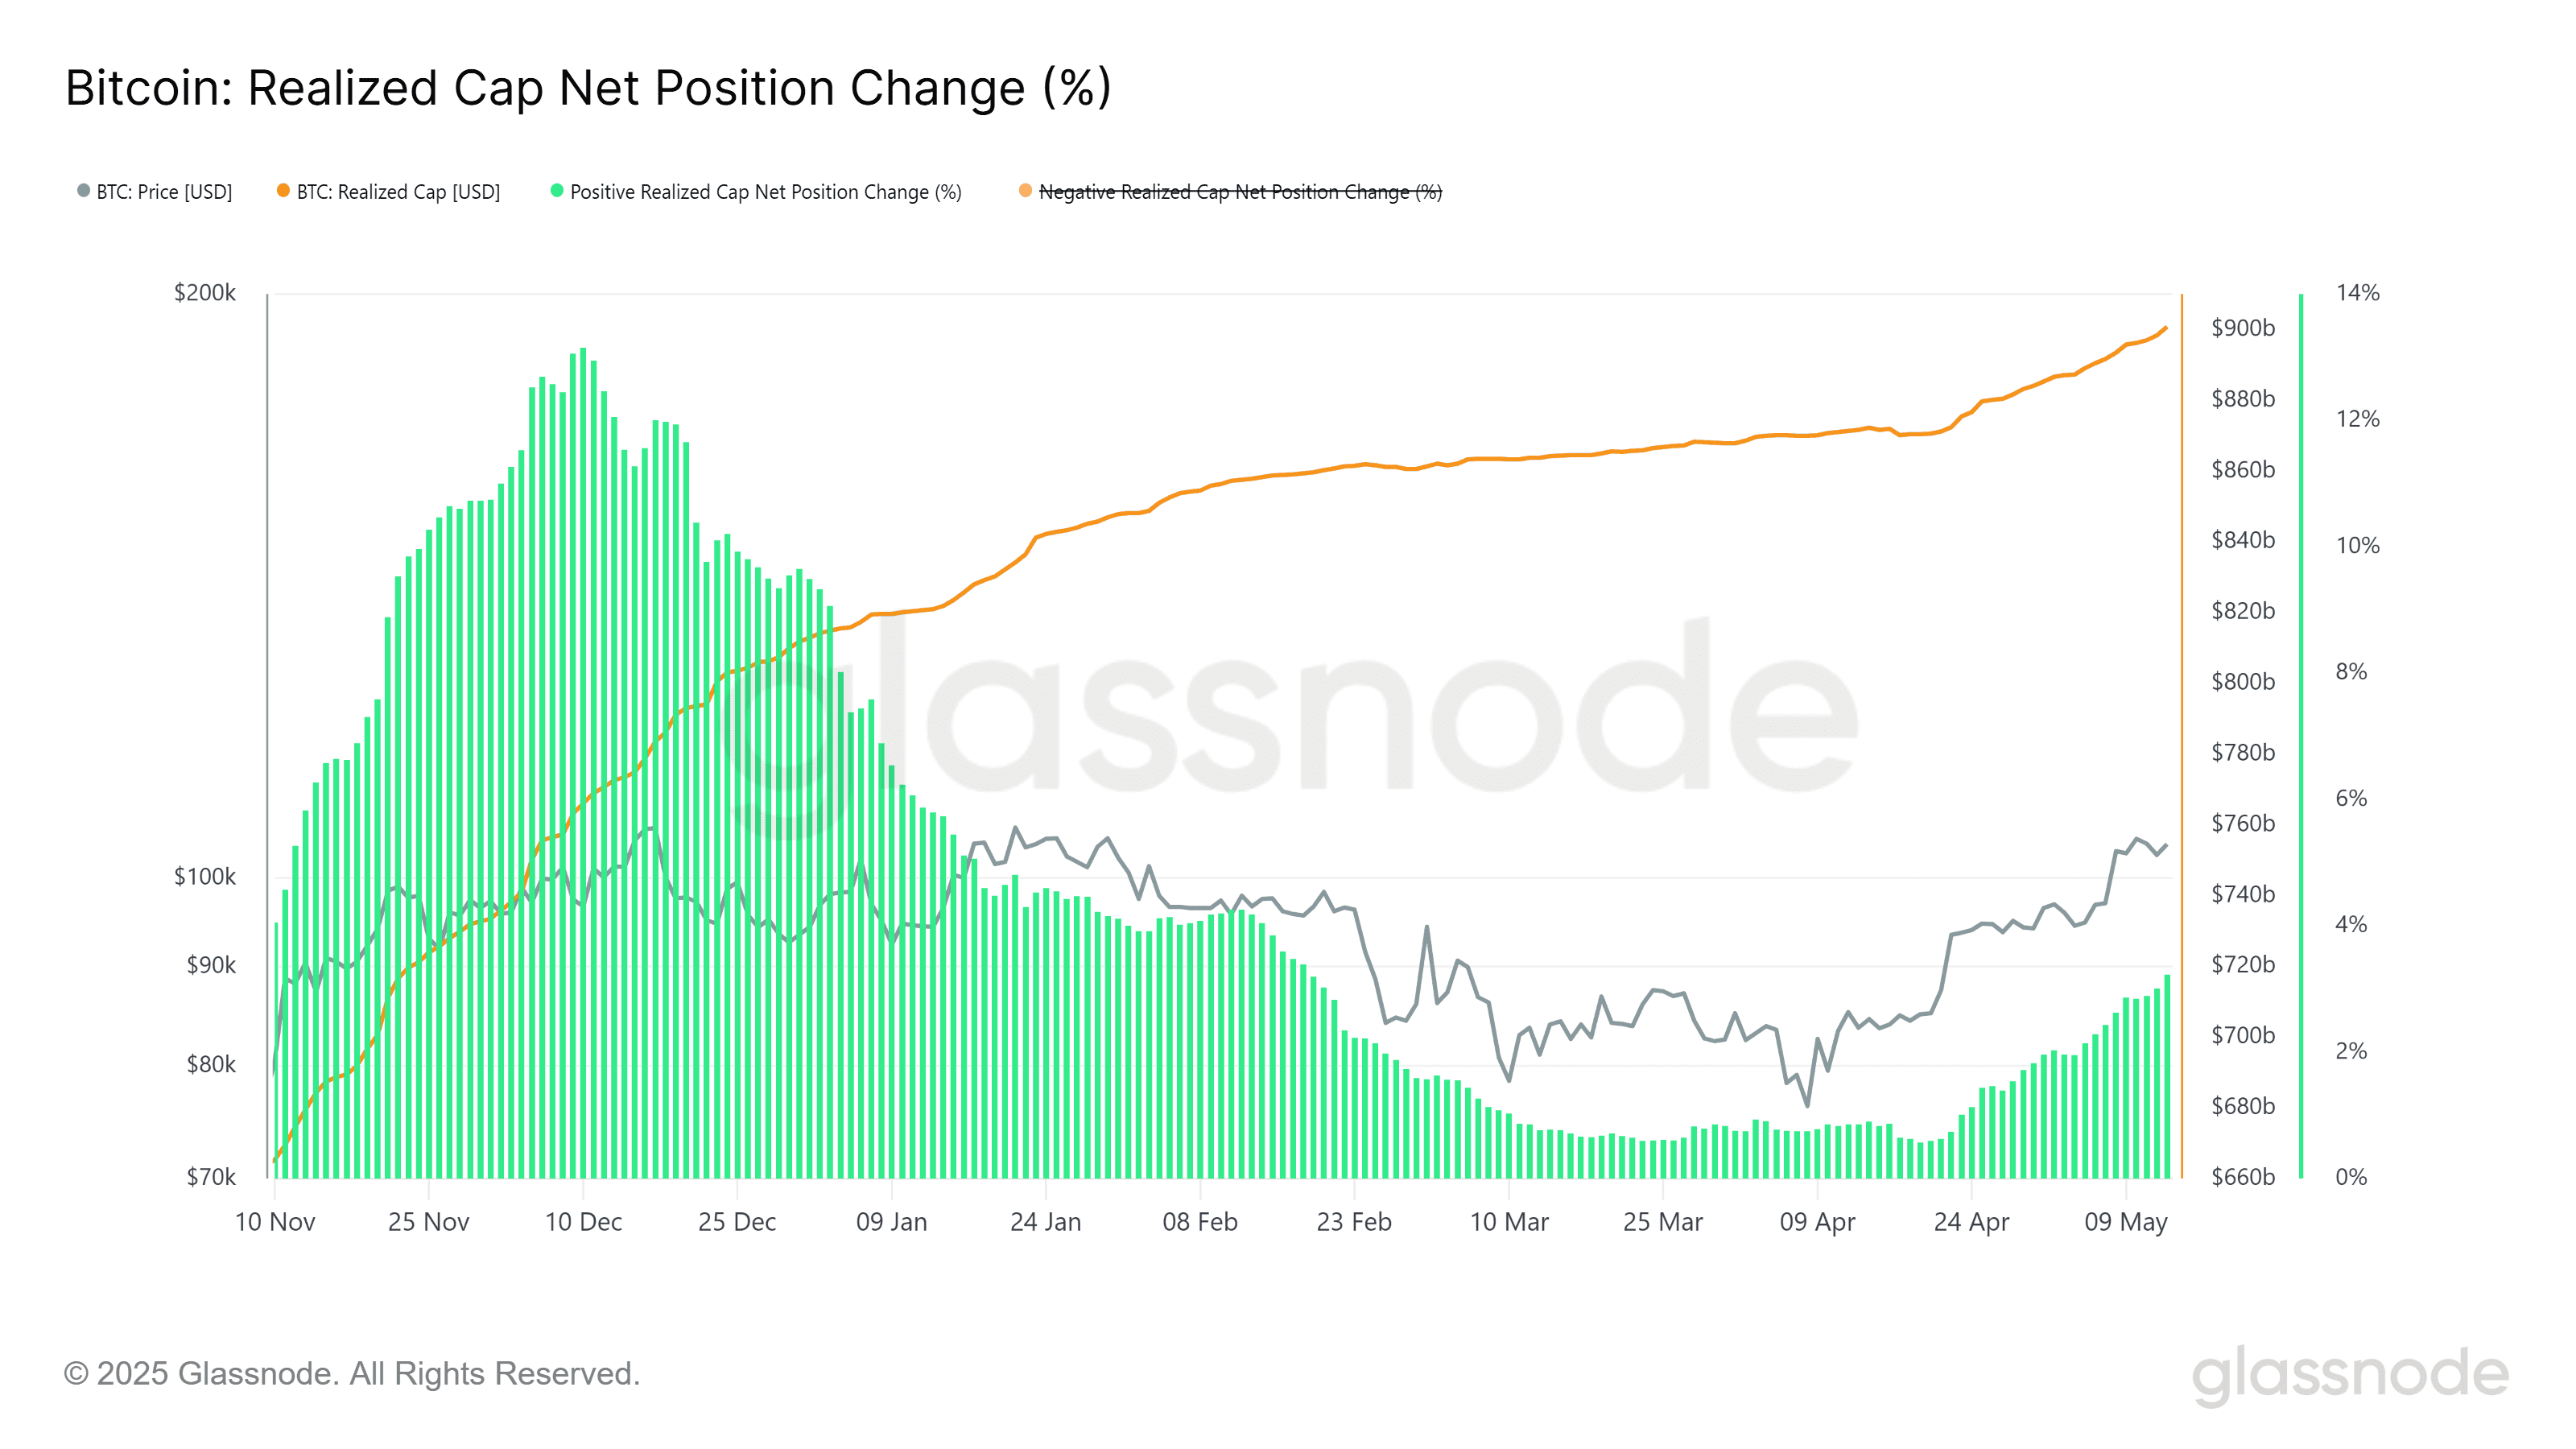
While this growth is slower than the 8% surge seen in late 2024 when BTC approached $93,000, it still demonstrates consistent investor confidence and fresh capital entering the market. The Realized Cap metric is crucial as it provides a more accurate reflection of market value by considering when Bitcoin was last actively traded.
Further supporting this bullish outlook, Glassnode also highlighted a notable shift in market dynamics. The 7-day simple moving average (SMA) of Bitcoin’s Spot Volume Delta turned positive, peaking near $5 billion on May 13. This indicates a strong net spot buying demand, a phenomenon observed only a few times this year.
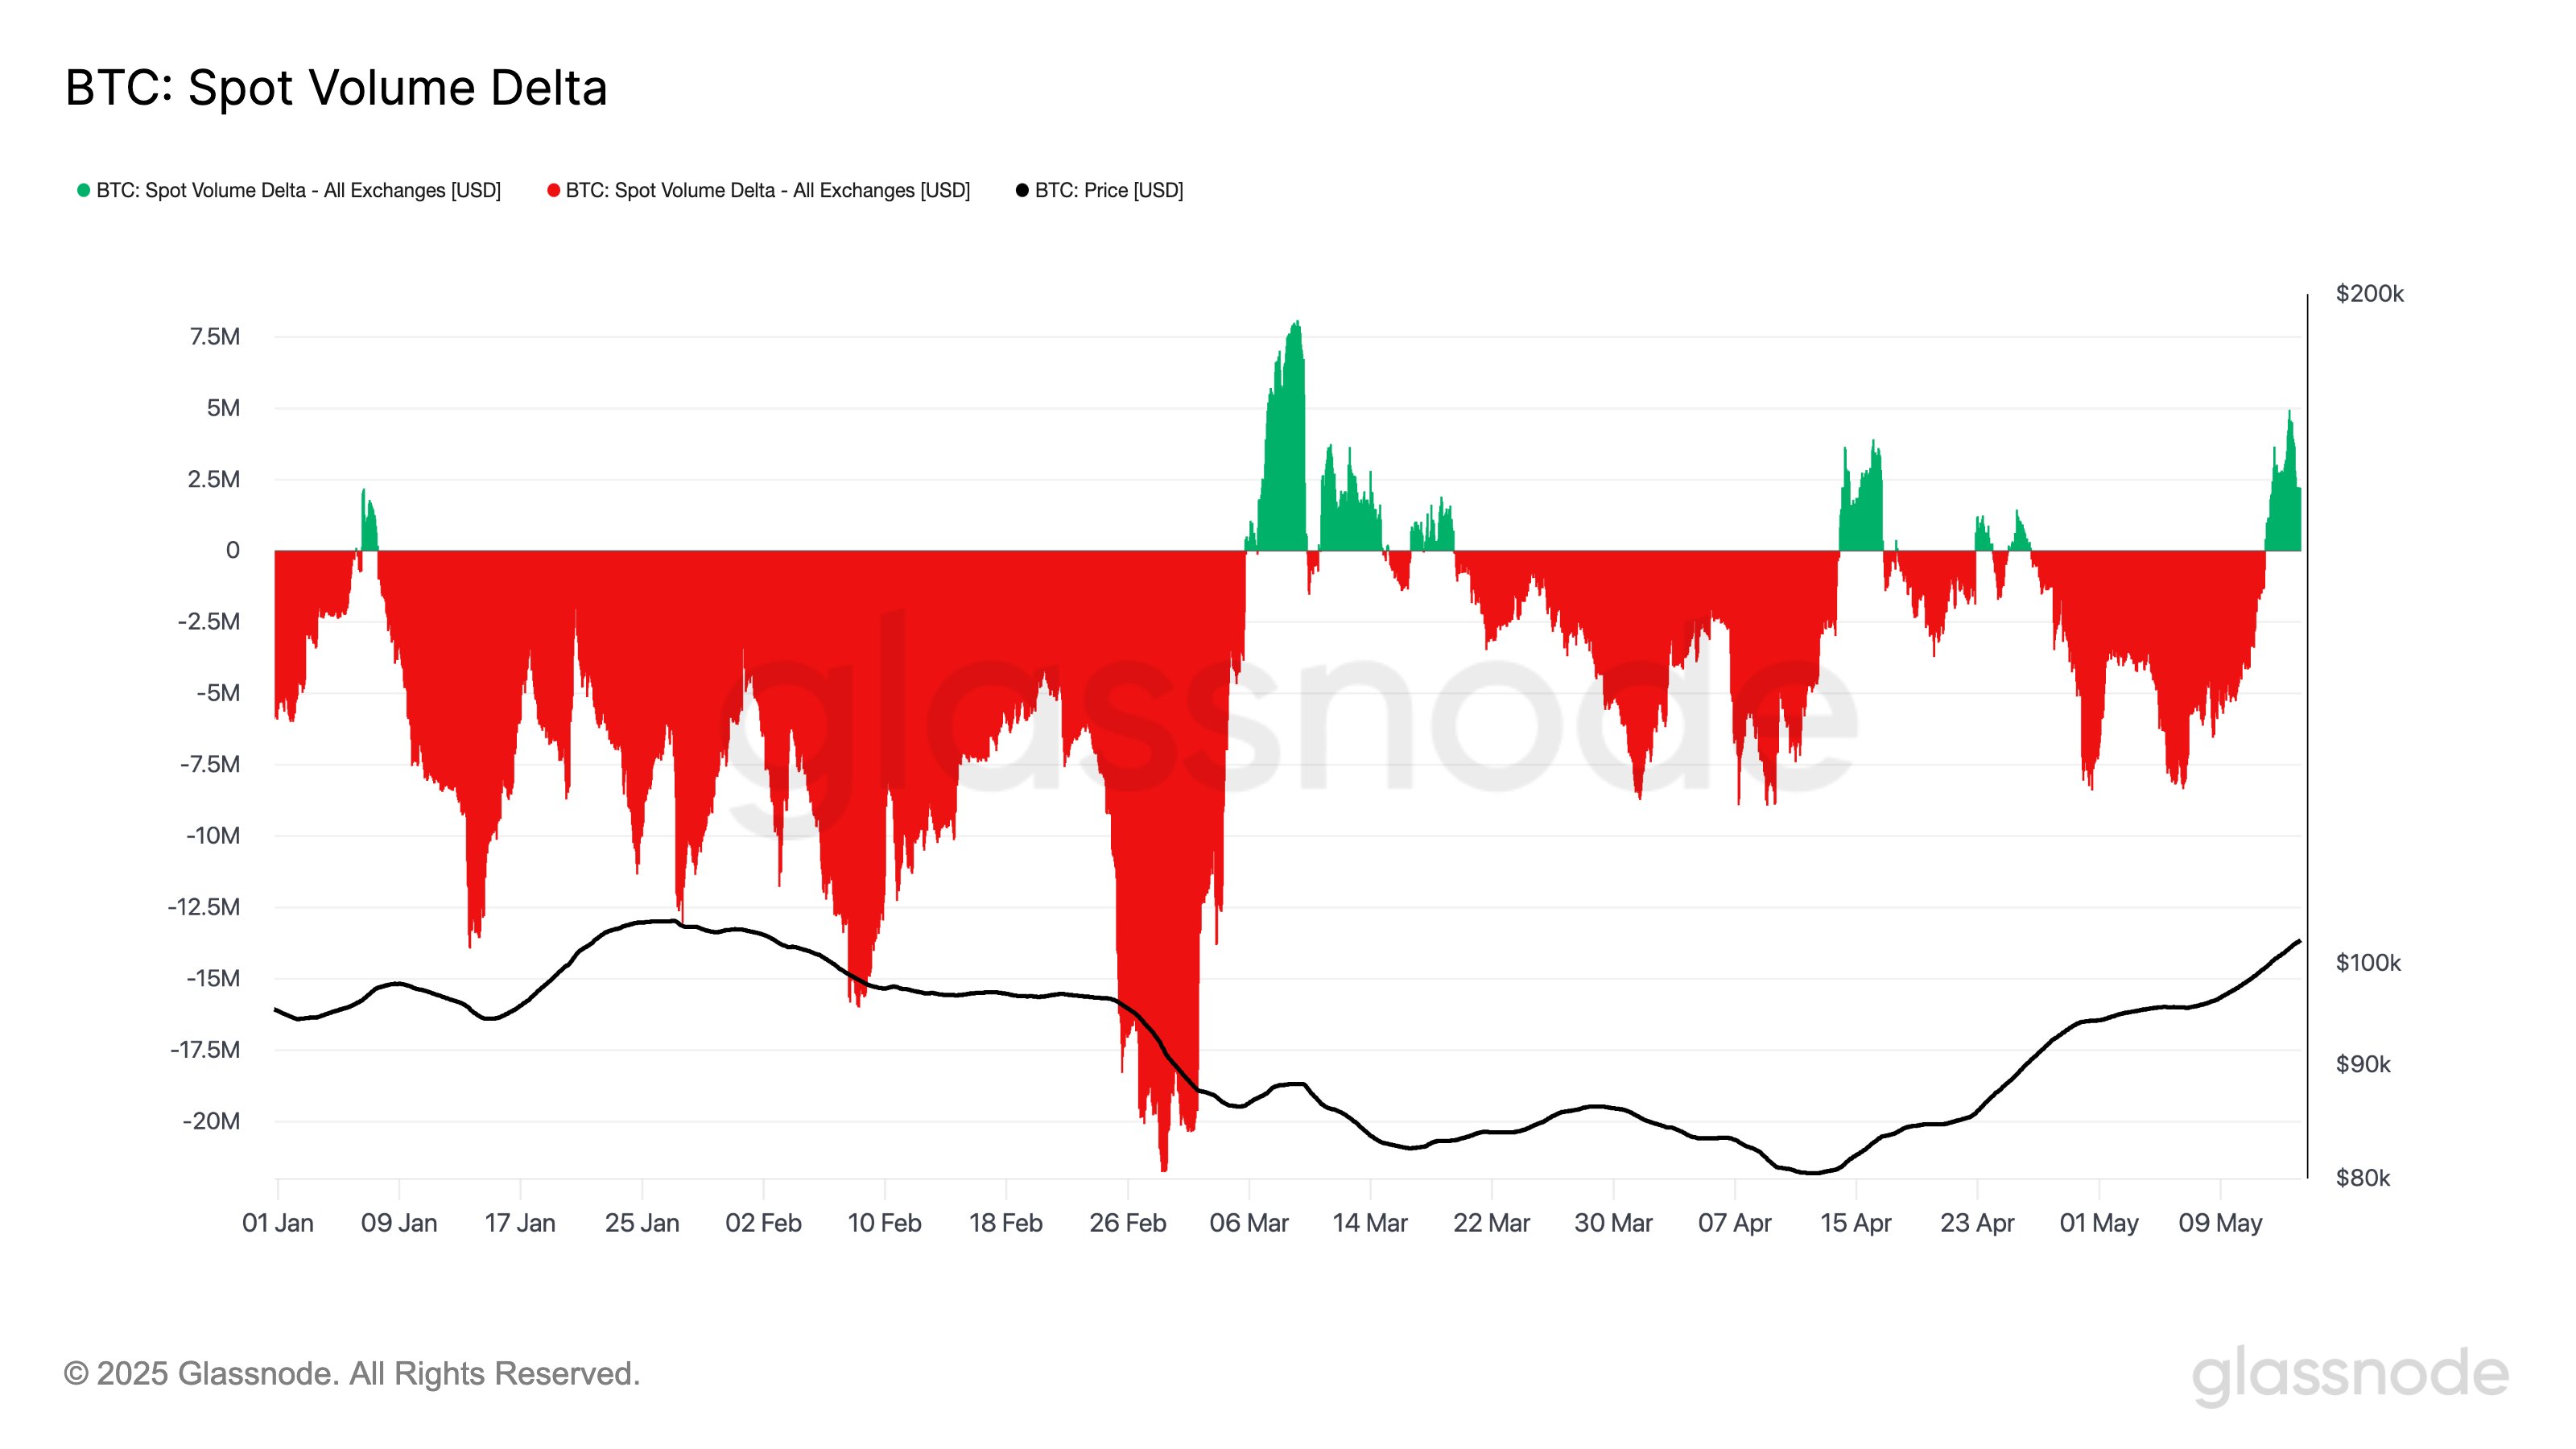
This surge in spot buying pressure suggests the rally is being driven by both institutional and retail investors, rather than solely by leveraged trading. This increased buying activity confirms solid spot market conviction behind Bitcoin’s recent push above the $100,000 psychological resistance.
Analyzing Bitcoin’s Consolidation Pattern: A Potential 10% Breakout?
Bitcoin has been exhibiting a pattern of steady consolidation and expansion since bottoming out around $74,500 in early April. Over the past four weeks, a distinct trend has emerged where Bitcoin consolidates after reaching a key level, then breaks out to a higher range. This pattern has repeated twice, with a third consolidation currently in progress.
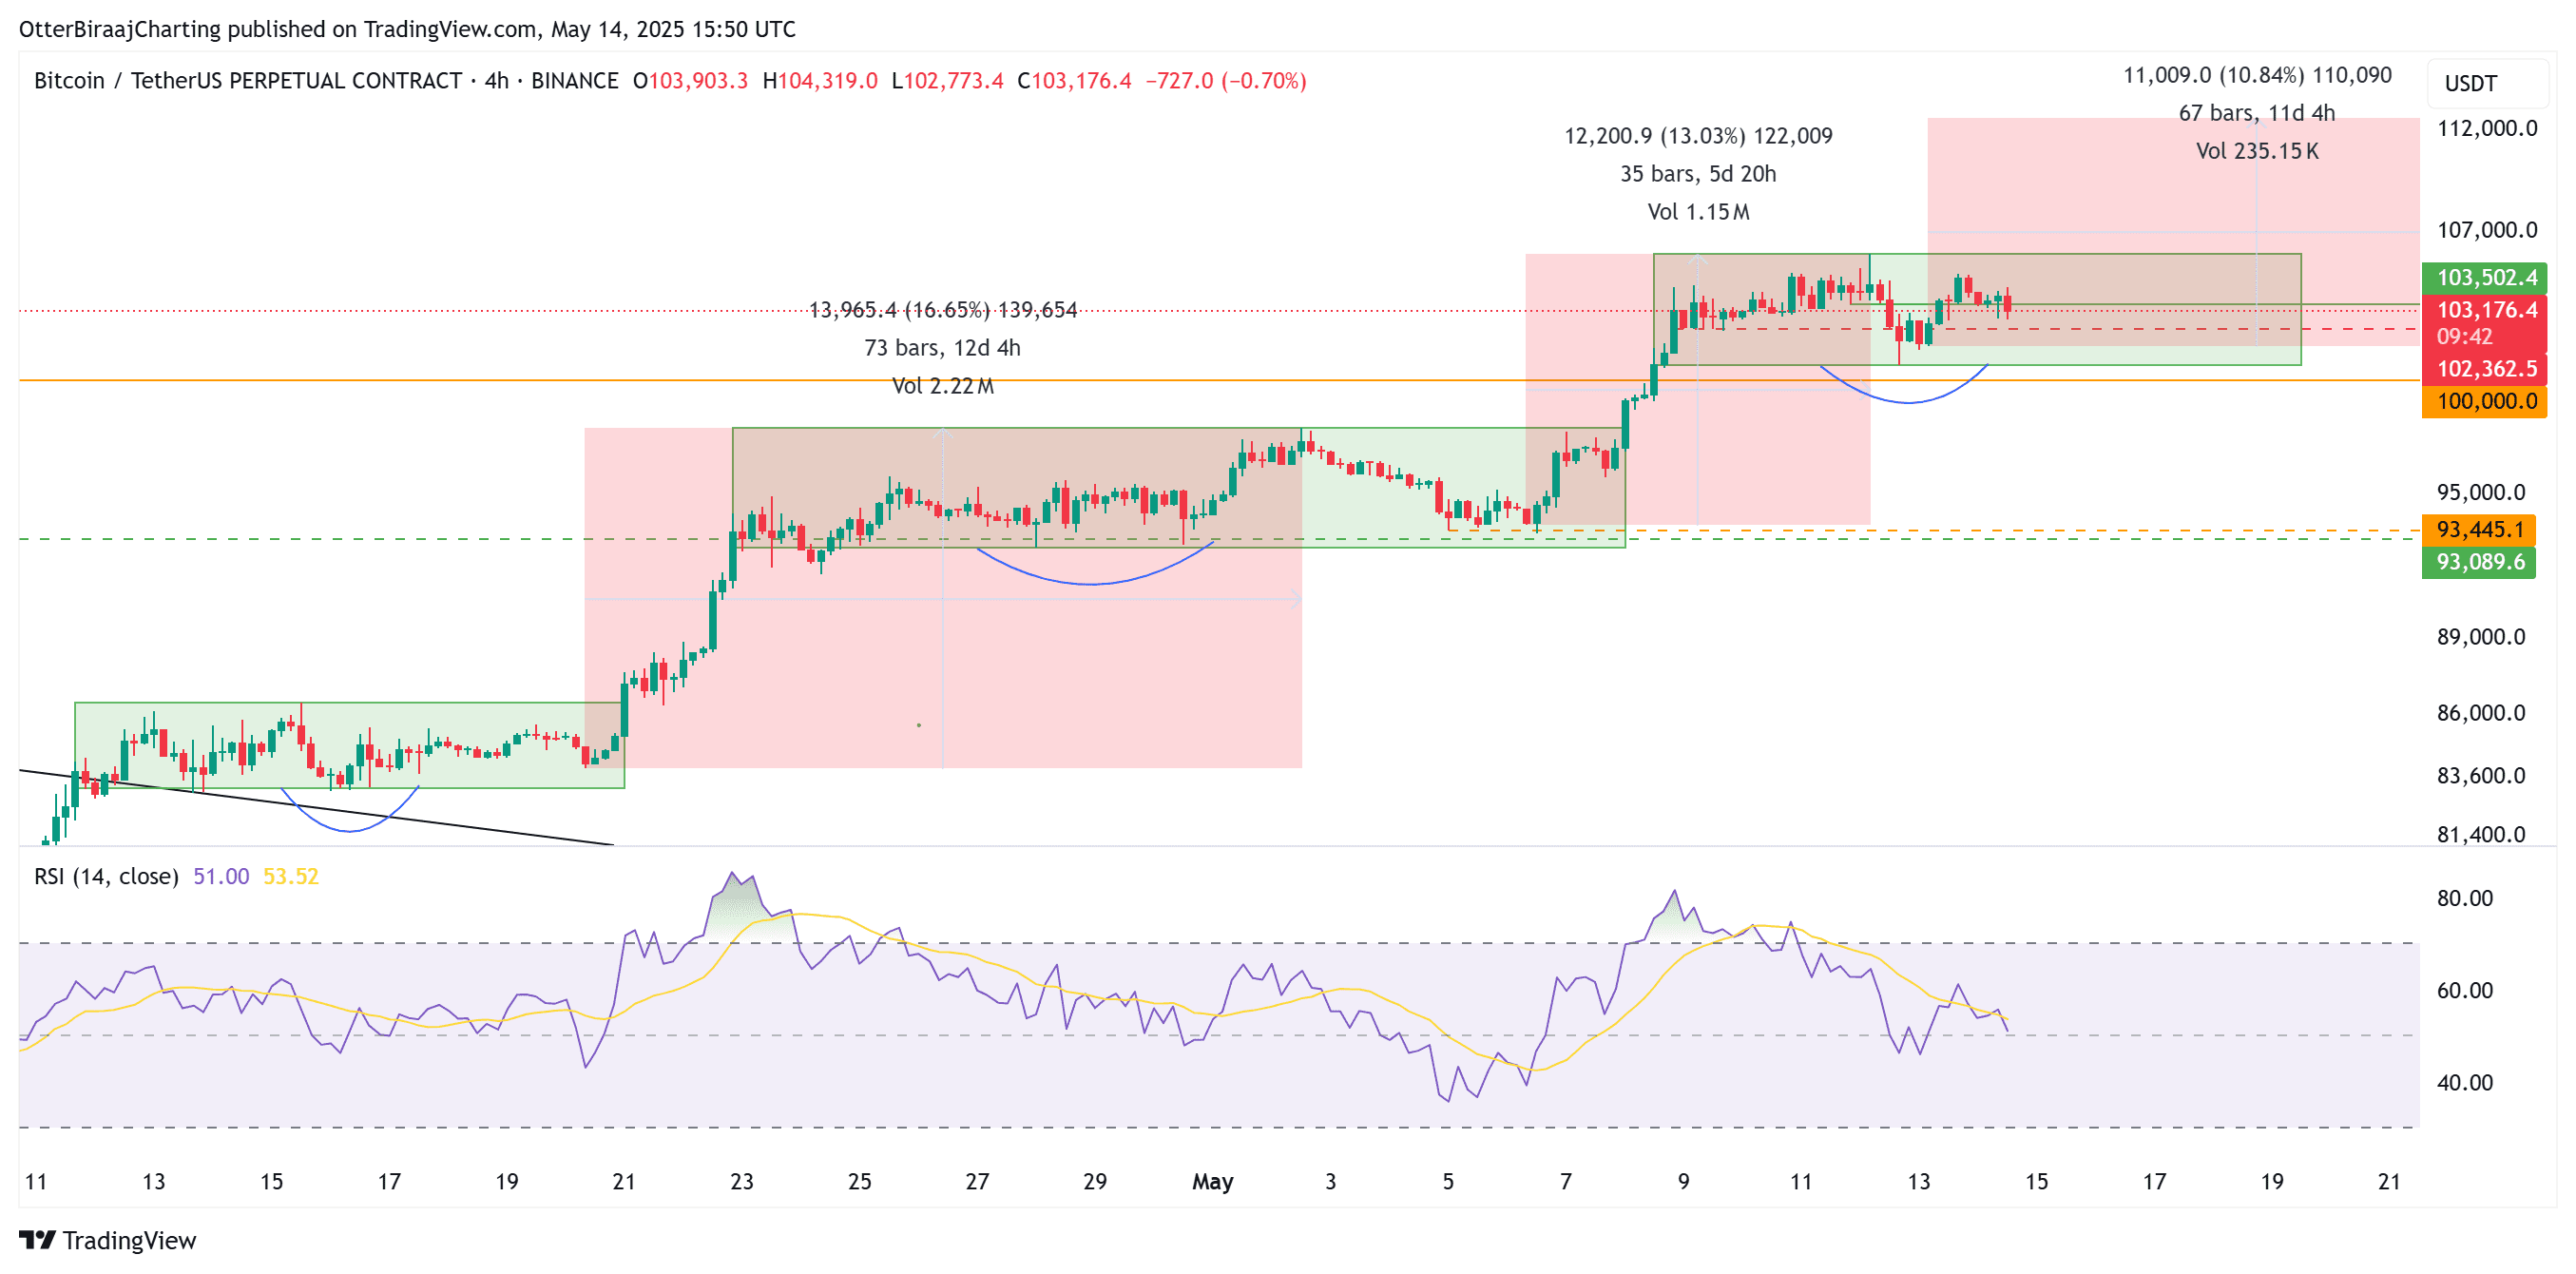
Each phase has followed a similar setup, forming higher upper and lower ranges. Typically, the bottom range is tested at least once before Bitcoin makes a push to new highs. The Relative Strength Index (RSI) has mirrored this price action, reaching overbought levels during new highs and dropping to around 50 during sideways movement.
Currently, Bitcoin is consolidating between an upper range of $105,700 and a lower range of $100,678. If the historical pattern continues, Bitcoin could retest the $100,000-$102,000 level before potentially breaking above $110,000. However, a bearish scenario could unfold if prices fall below $102,000 and fail to recover quickly.
Factors Driving Bitcoin’s Bullish Momentum:
- Institutional Adoption: Growing acceptance of Bitcoin among institutional investors is driving significant capital inflows.
- Retail Interest: Increased awareness and accessibility are attracting more retail investors to the Bitcoin market.
- Halving Effect: The recent Bitcoin halving event, which reduced the block reward for miners, is expected to create scarcity and drive up prices.
- Macroeconomic Factors: Concerns about inflation and economic uncertainty are leading investors to seek alternative assets like Bitcoin.
Potential Risks and Considerations:
- Regulatory Uncertainty: Evolving regulations surrounding cryptocurrencies could impact Bitcoin’s price and adoption.
- Market Volatility: Bitcoin remains a highly volatile asset, and prices can fluctuate significantly.
- Security Concerns: Cybersecurity threats and potential hacks remain a concern for Bitcoin investors.
Conclusion:
Bitcoin’s current market conditions indicate a strong bullish sentiment. The combination of increasing realized cap, rising spot buying pressure, and a recurring consolidation pattern suggest the potential for new all-time highs in the coming weeks. However, investors should remain aware of the inherent risks and conduct thorough research before making any investment decisions. Monitoring key indicators like the Realized Cap, Spot Volume Delta, and RSI can provide valuable insights into the evolving Bitcoin market.
This article does not contain investment advice or recommendations. Every investment and trading move involves risk, and readers should conduct their own research when making a decision.