Bitcoin Price Prediction: Will BTC Hit $100K by May? Analyzing 5 Key Charts
Bitcoin (BTC) is currently exhibiting several indicators that suggest a potential rally towards the $100,000 mark by May. These signals stem from technical analysis of price charts, on-chain data, and derivatives market analysis. This article will break down five key charts and data points to assess the likelihood of this bullish scenario.
Key Factors Supporting a $100K Bitcoin Rally:
- Technical Chart Patterns: Several bullish chart patterns are emerging, suggesting upward price momentum.
- On-Chain Data: Increasing profitability and accumulation trends indicate renewed market confidence.
- Derivatives Market Dynamics: Liquidation levels and short positions at $100,000 could trigger a short squeeze, accelerating price appreciation.
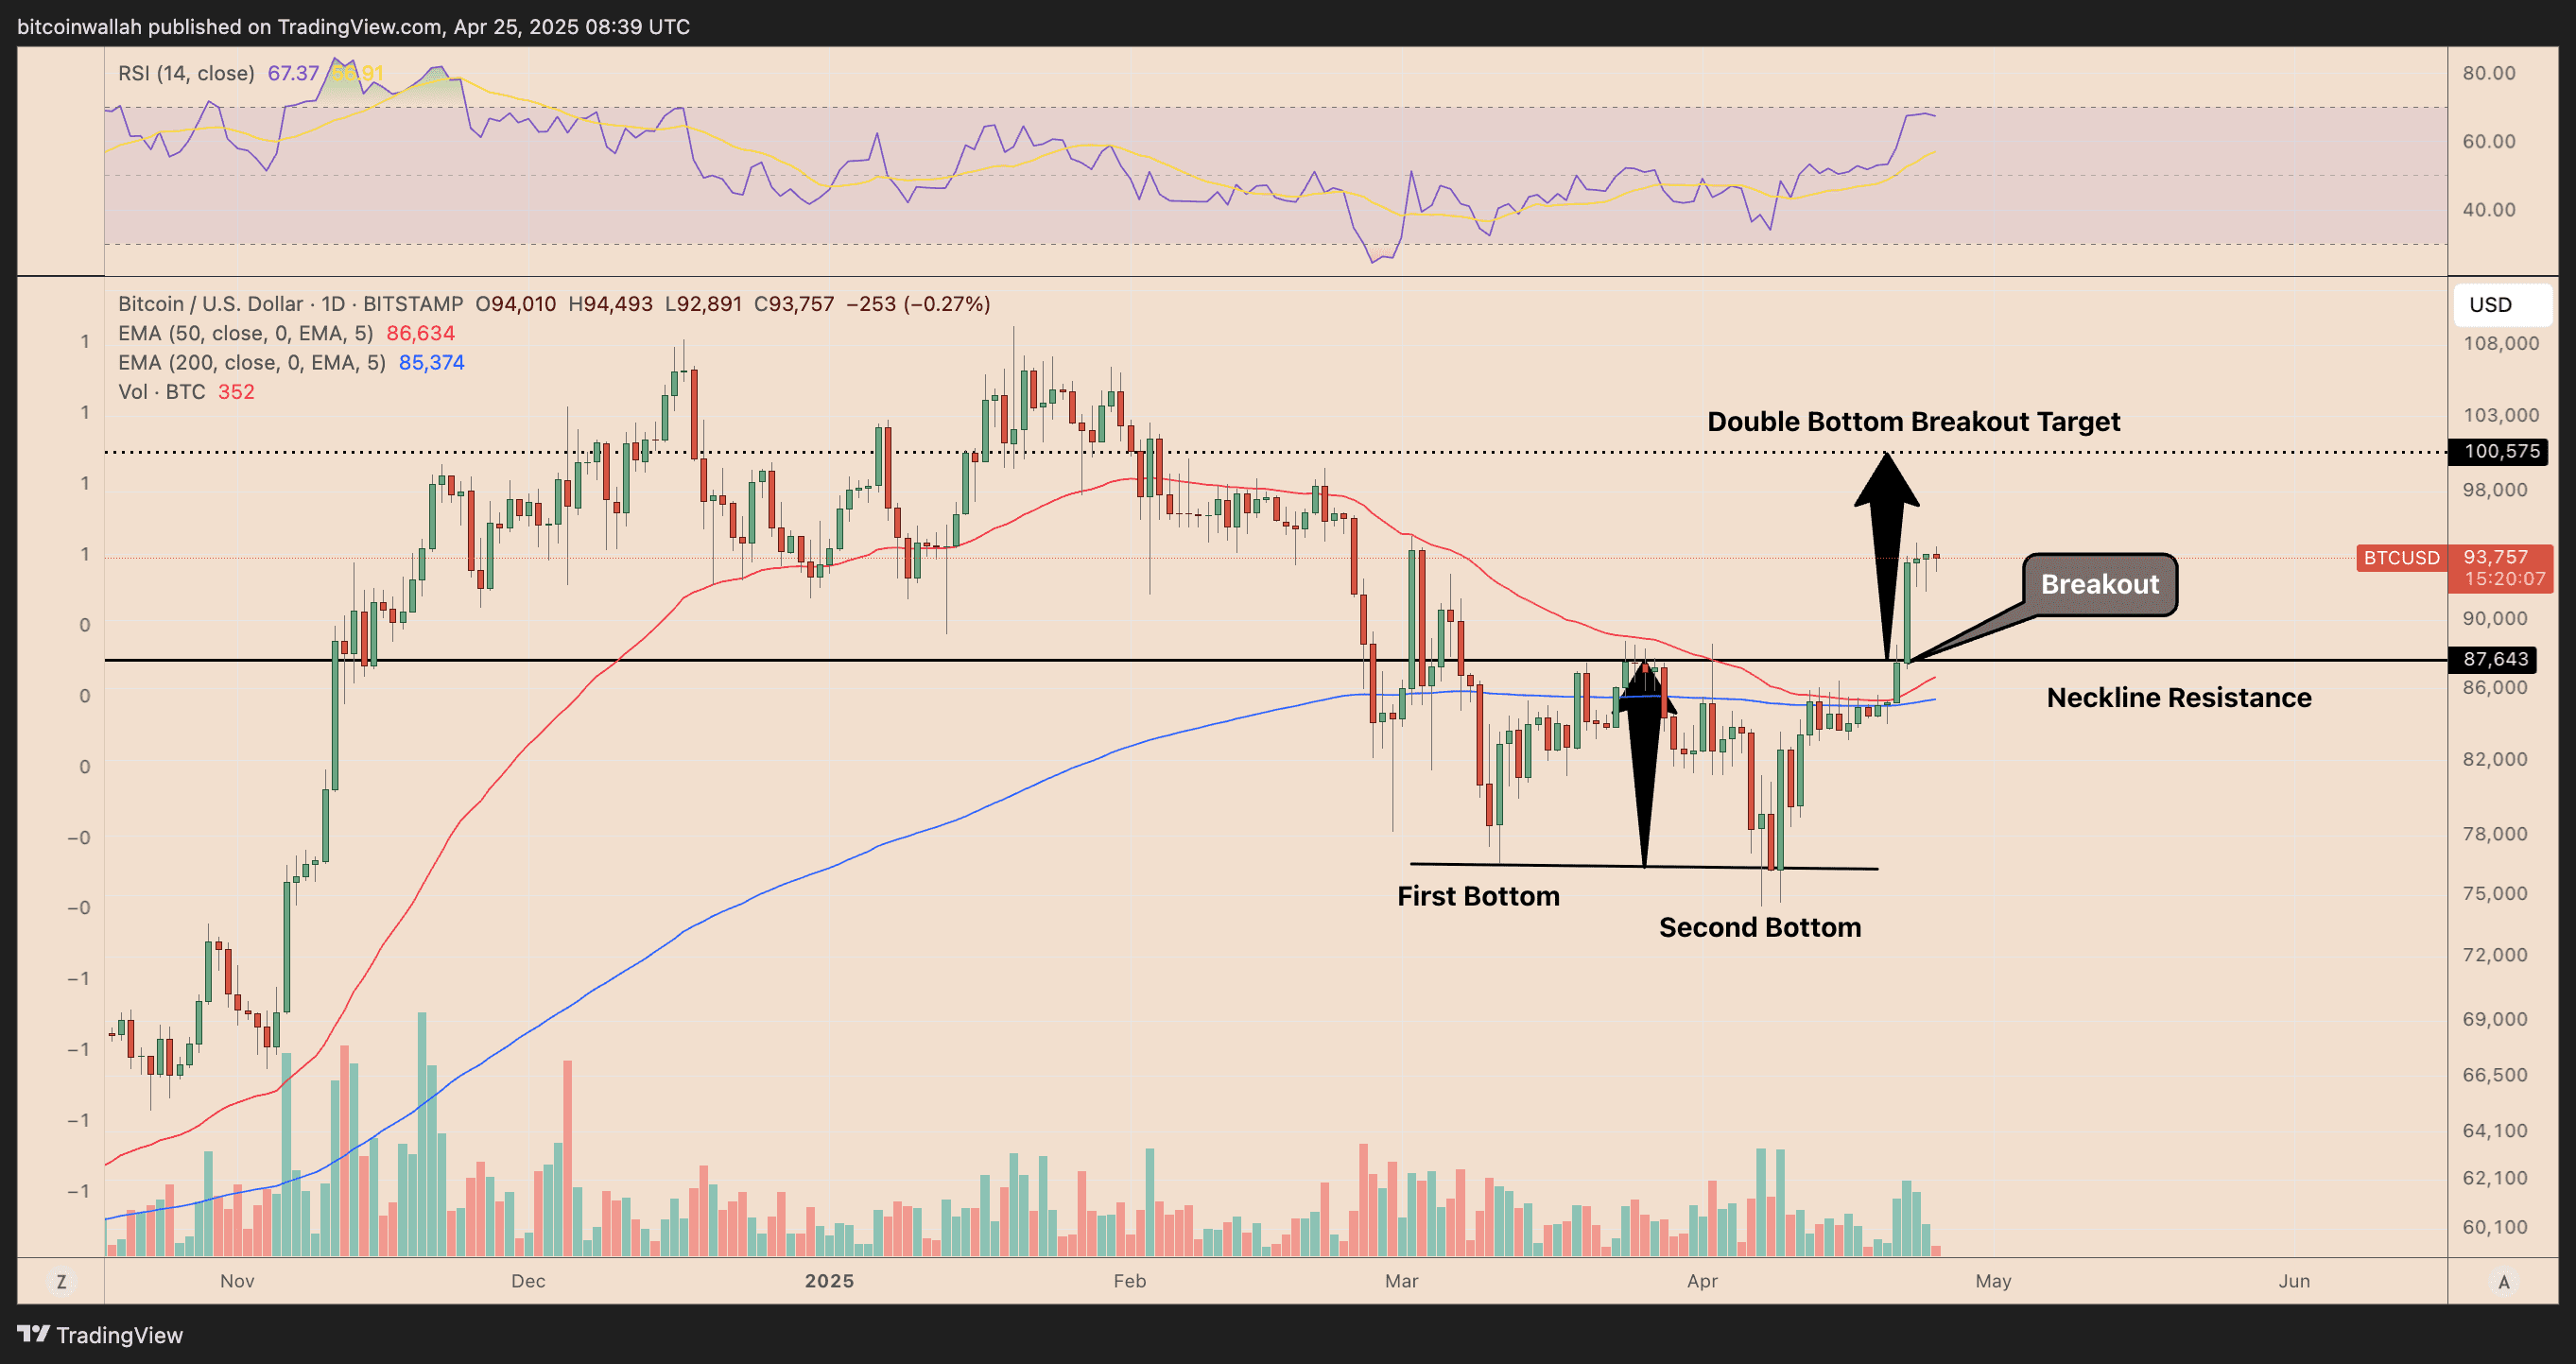
1. Double Bottom Pattern: Targeting $100,600
Bitcoin’s daily chart reveals a double bottom pattern, a classic bullish reversal signal. The breakout above the neckline suggests a potential move towards $100,600 based on the pattern’s measured move. Supporting this outlook, momentum indicators like the Relative Strength Index (RSI) remain in bullish territory, and key moving averages (50-day and 200-day EMAs) are acting as support levels.
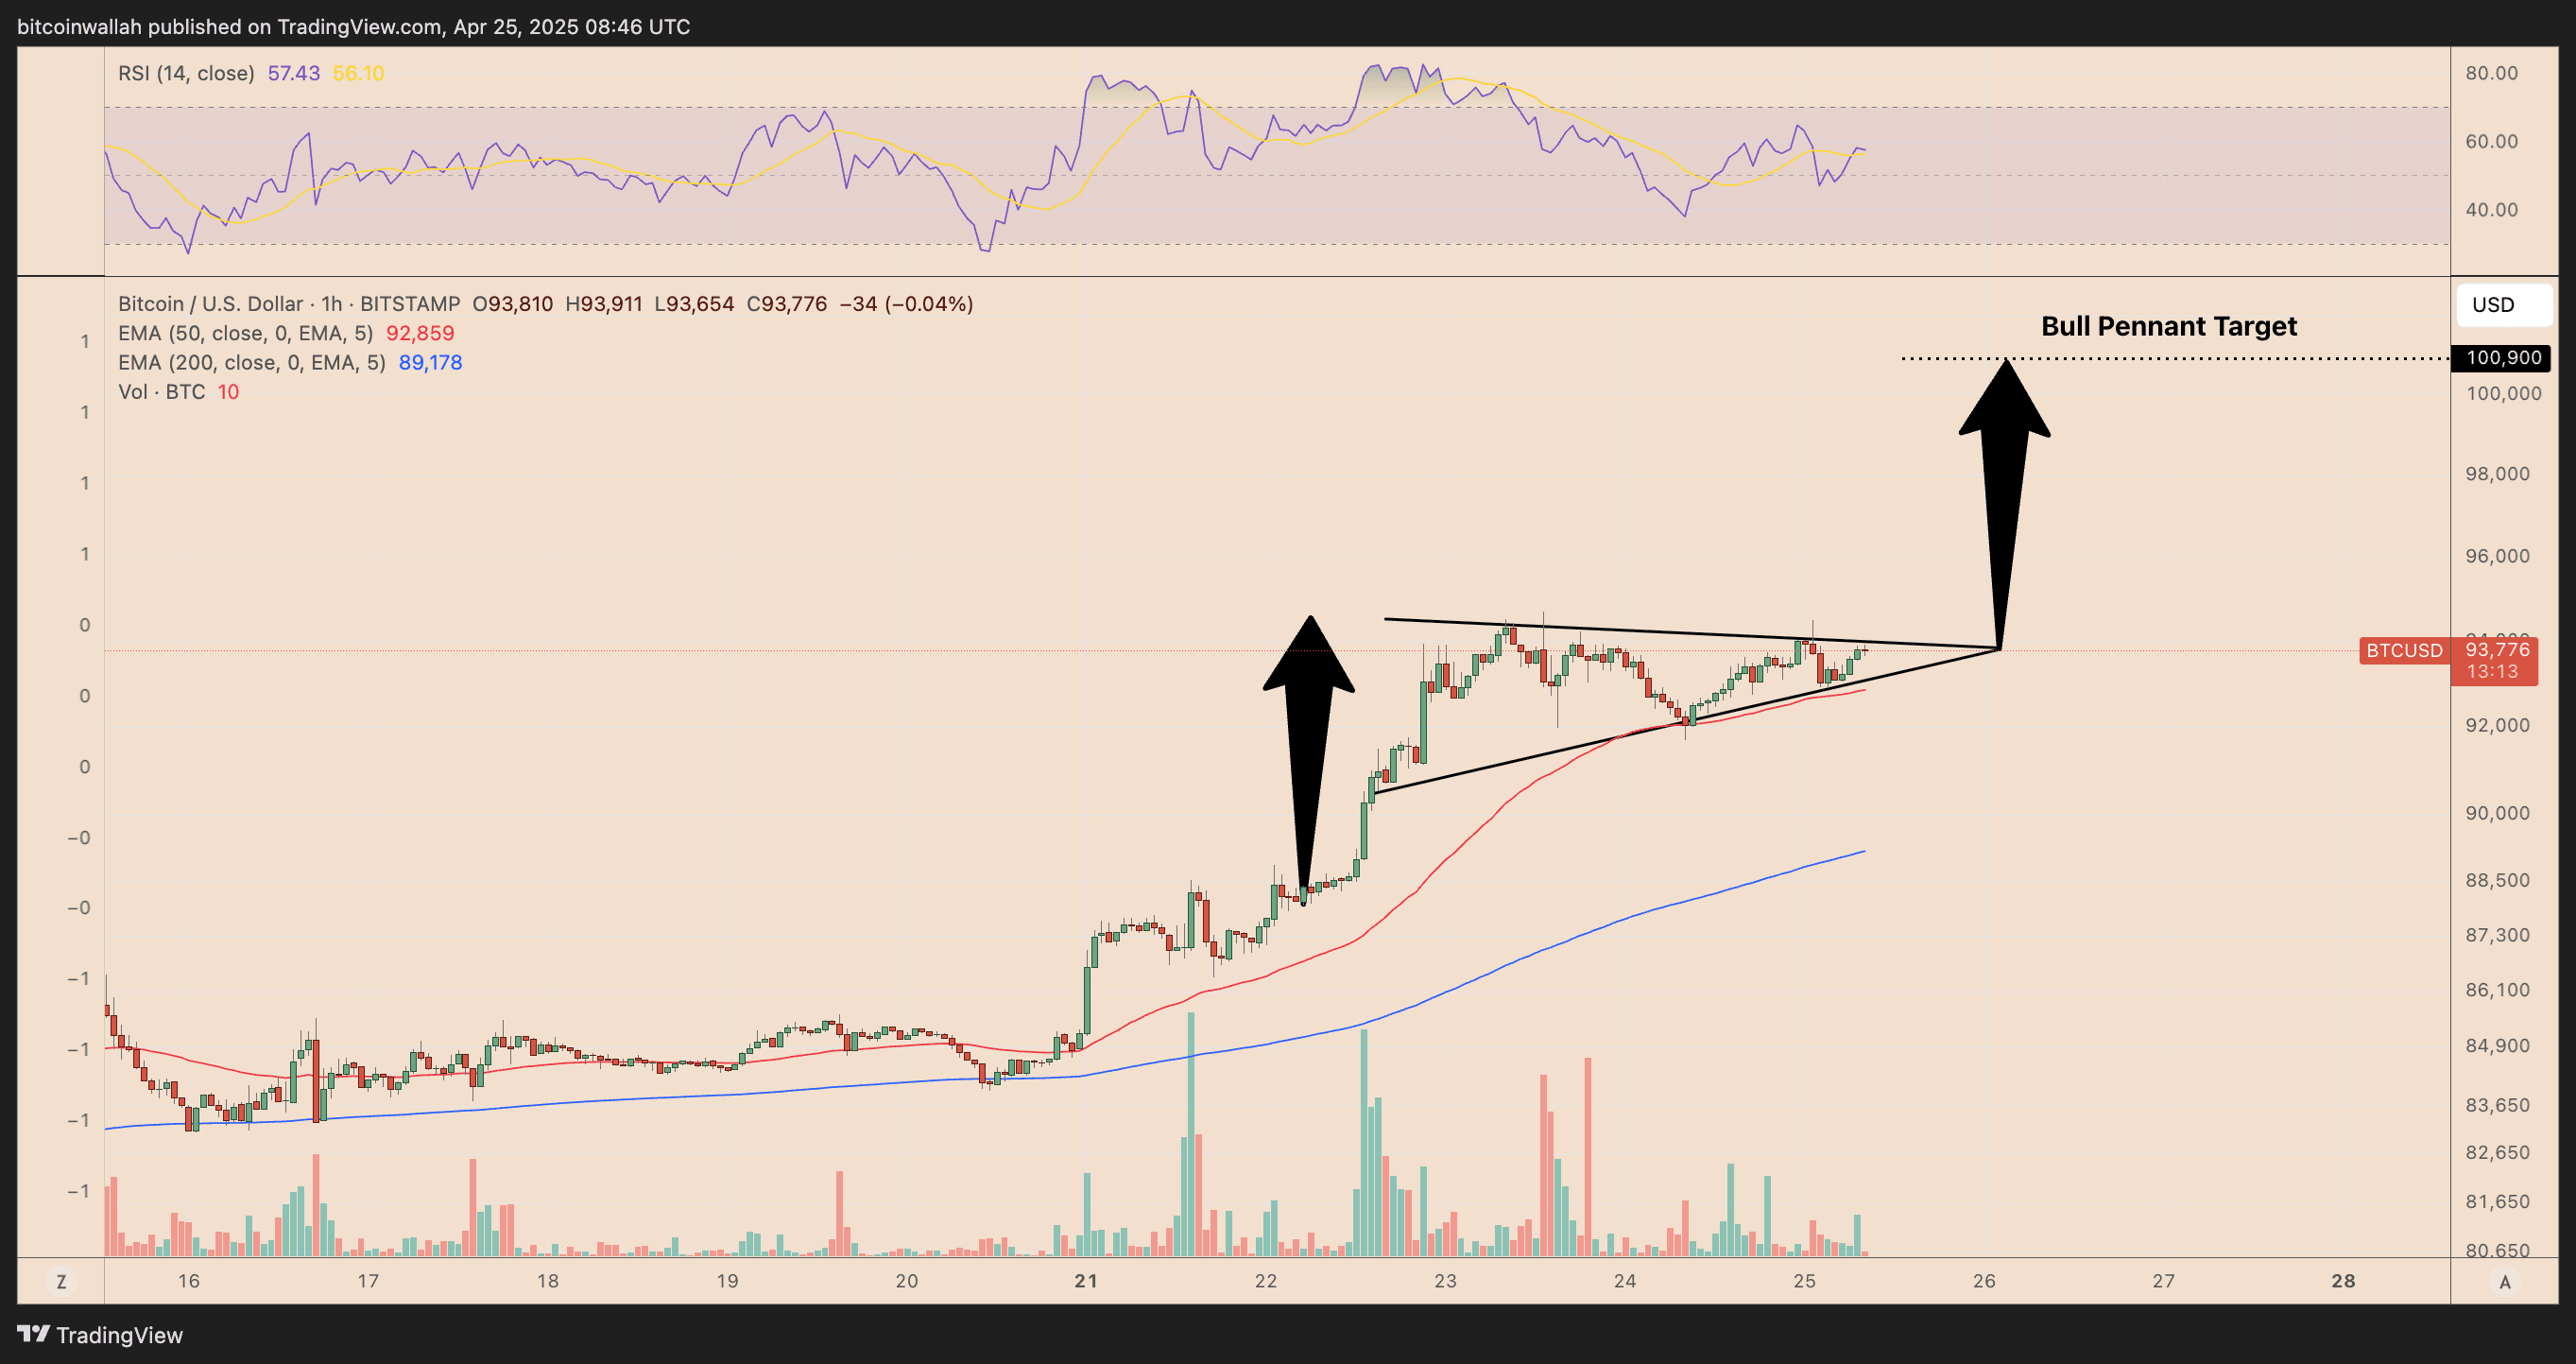
2. Bull Pennant: Consolidating Before the Next Leg Up
On the hourly timeframe, BTC is consolidating within a bull pennant after a strong upward move. This pattern typically signifies a pause before another surge higher, with a target near $100,900. The pennant formation indicates that the price is coiling up for a potential breakout.
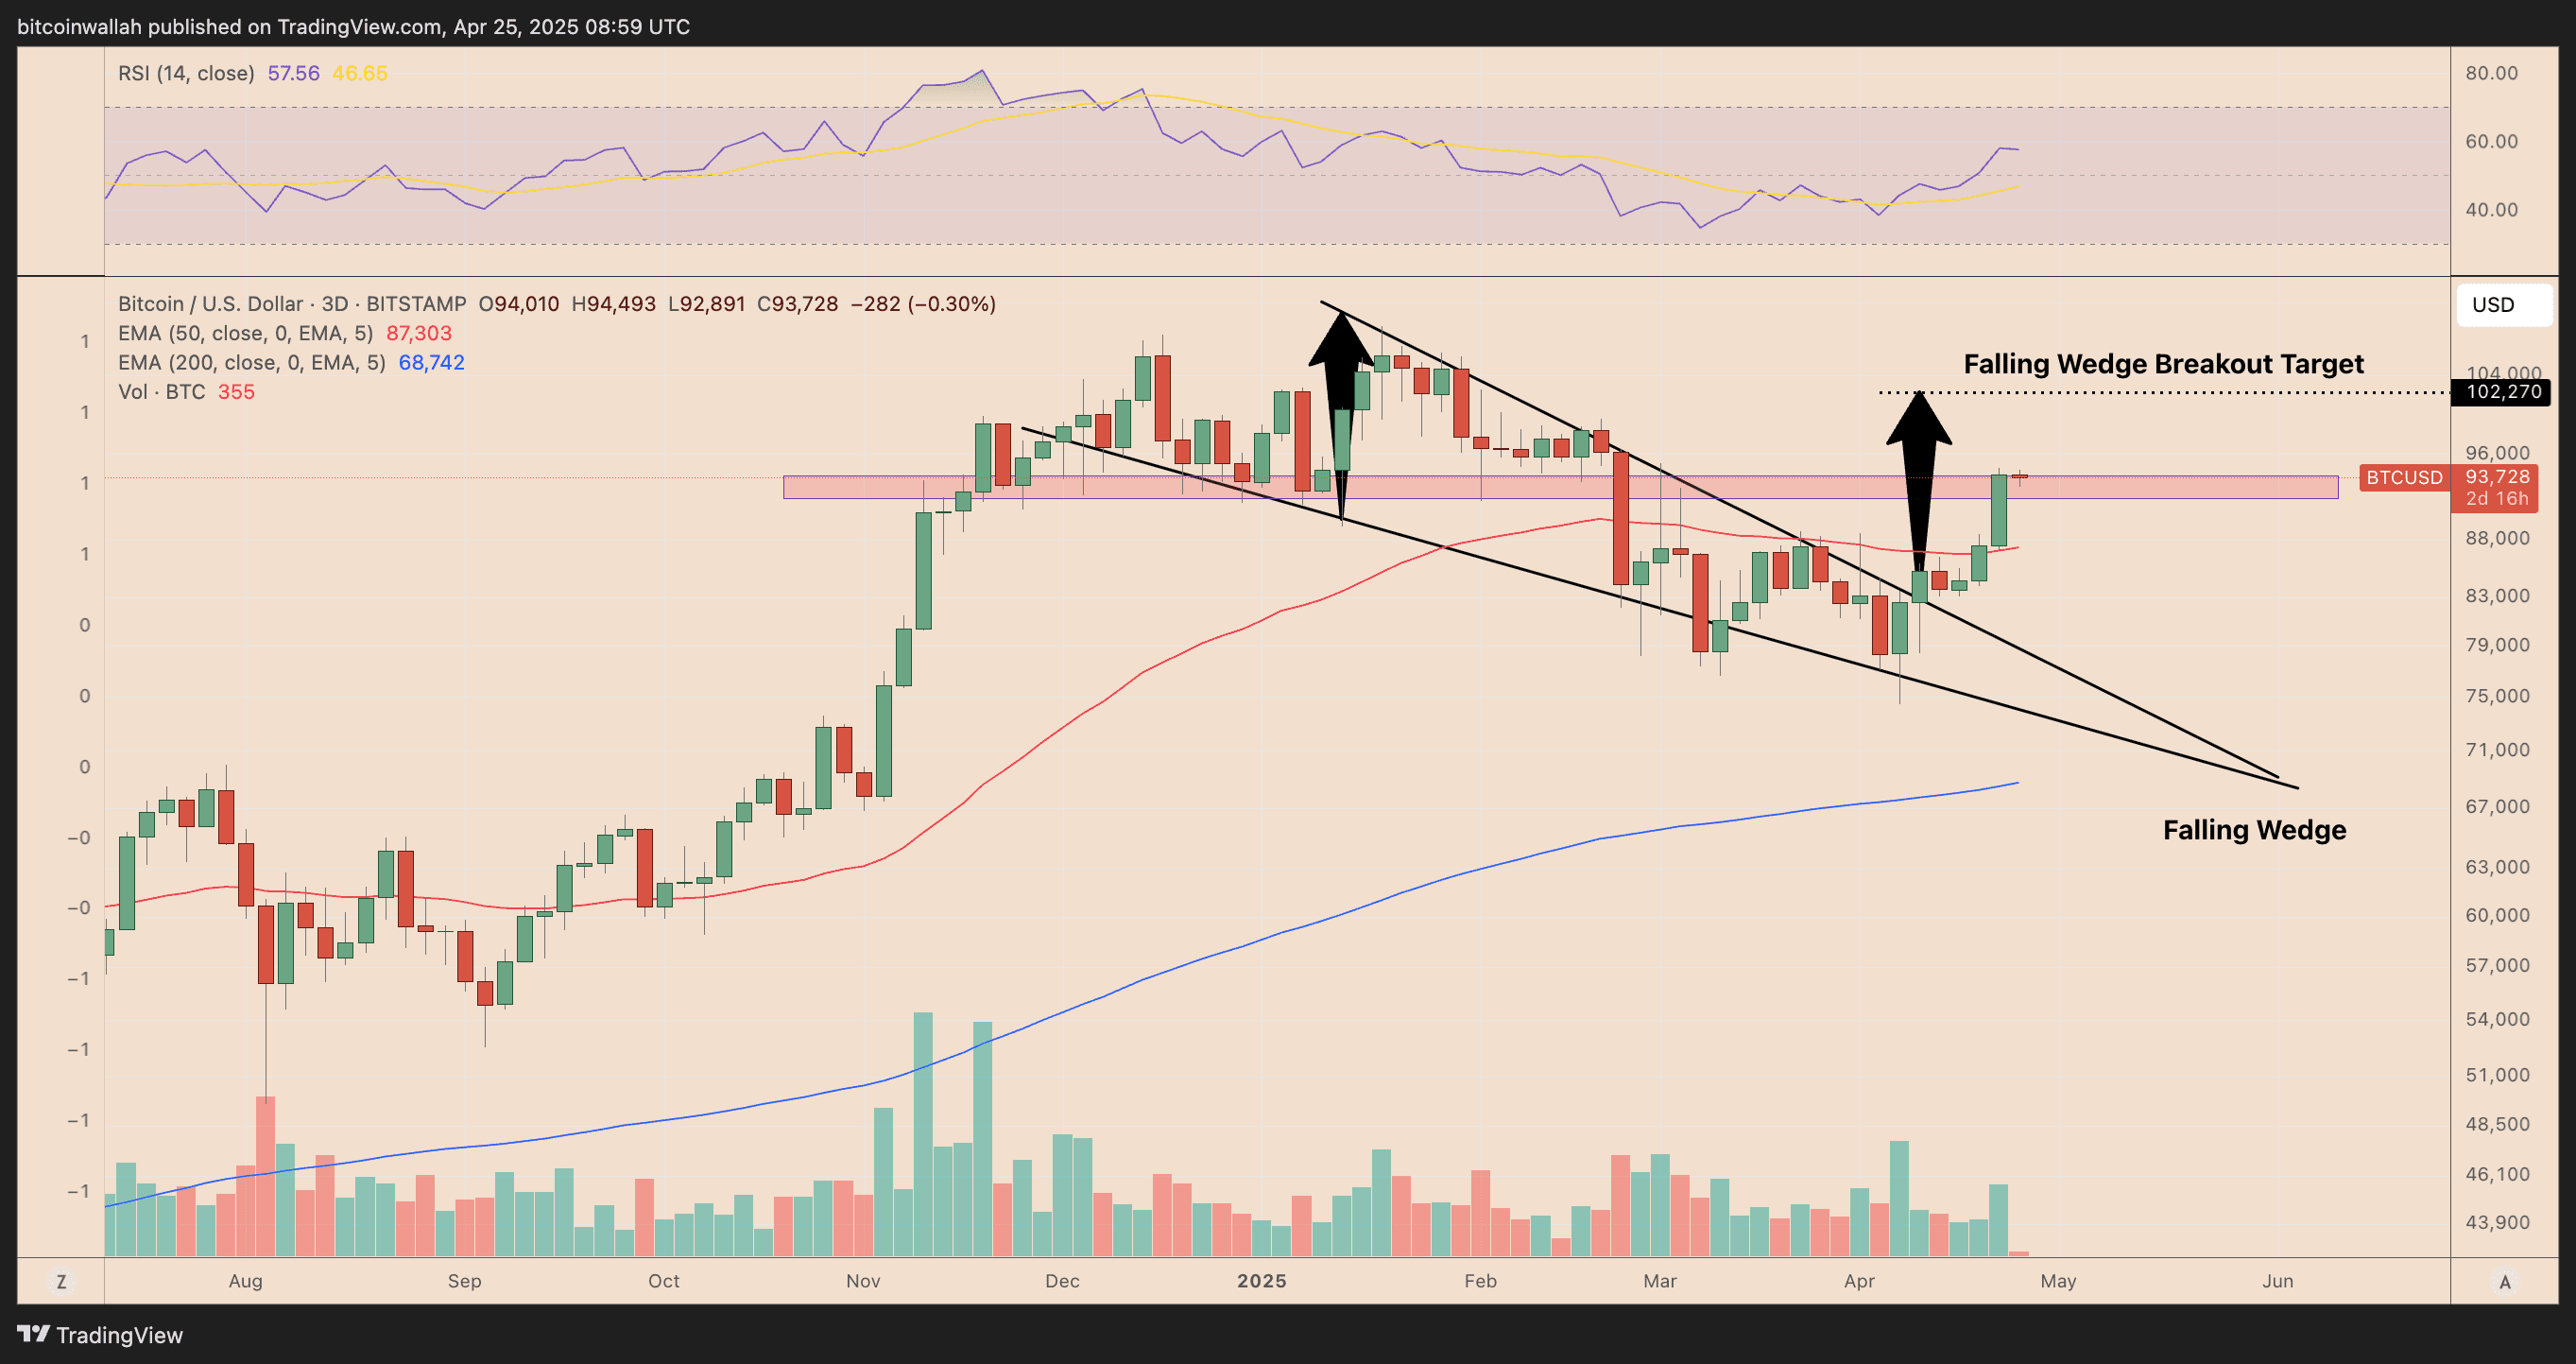
3. Falling Wedge Breakout: Aiming for $102,000
The three-day chart shows a completed falling wedge breakout. This bullish reversal pattern has broken through resistance near $94,000, with a projected move towards $102,270. The strong volume during the breakout further validates this upward trajectory.
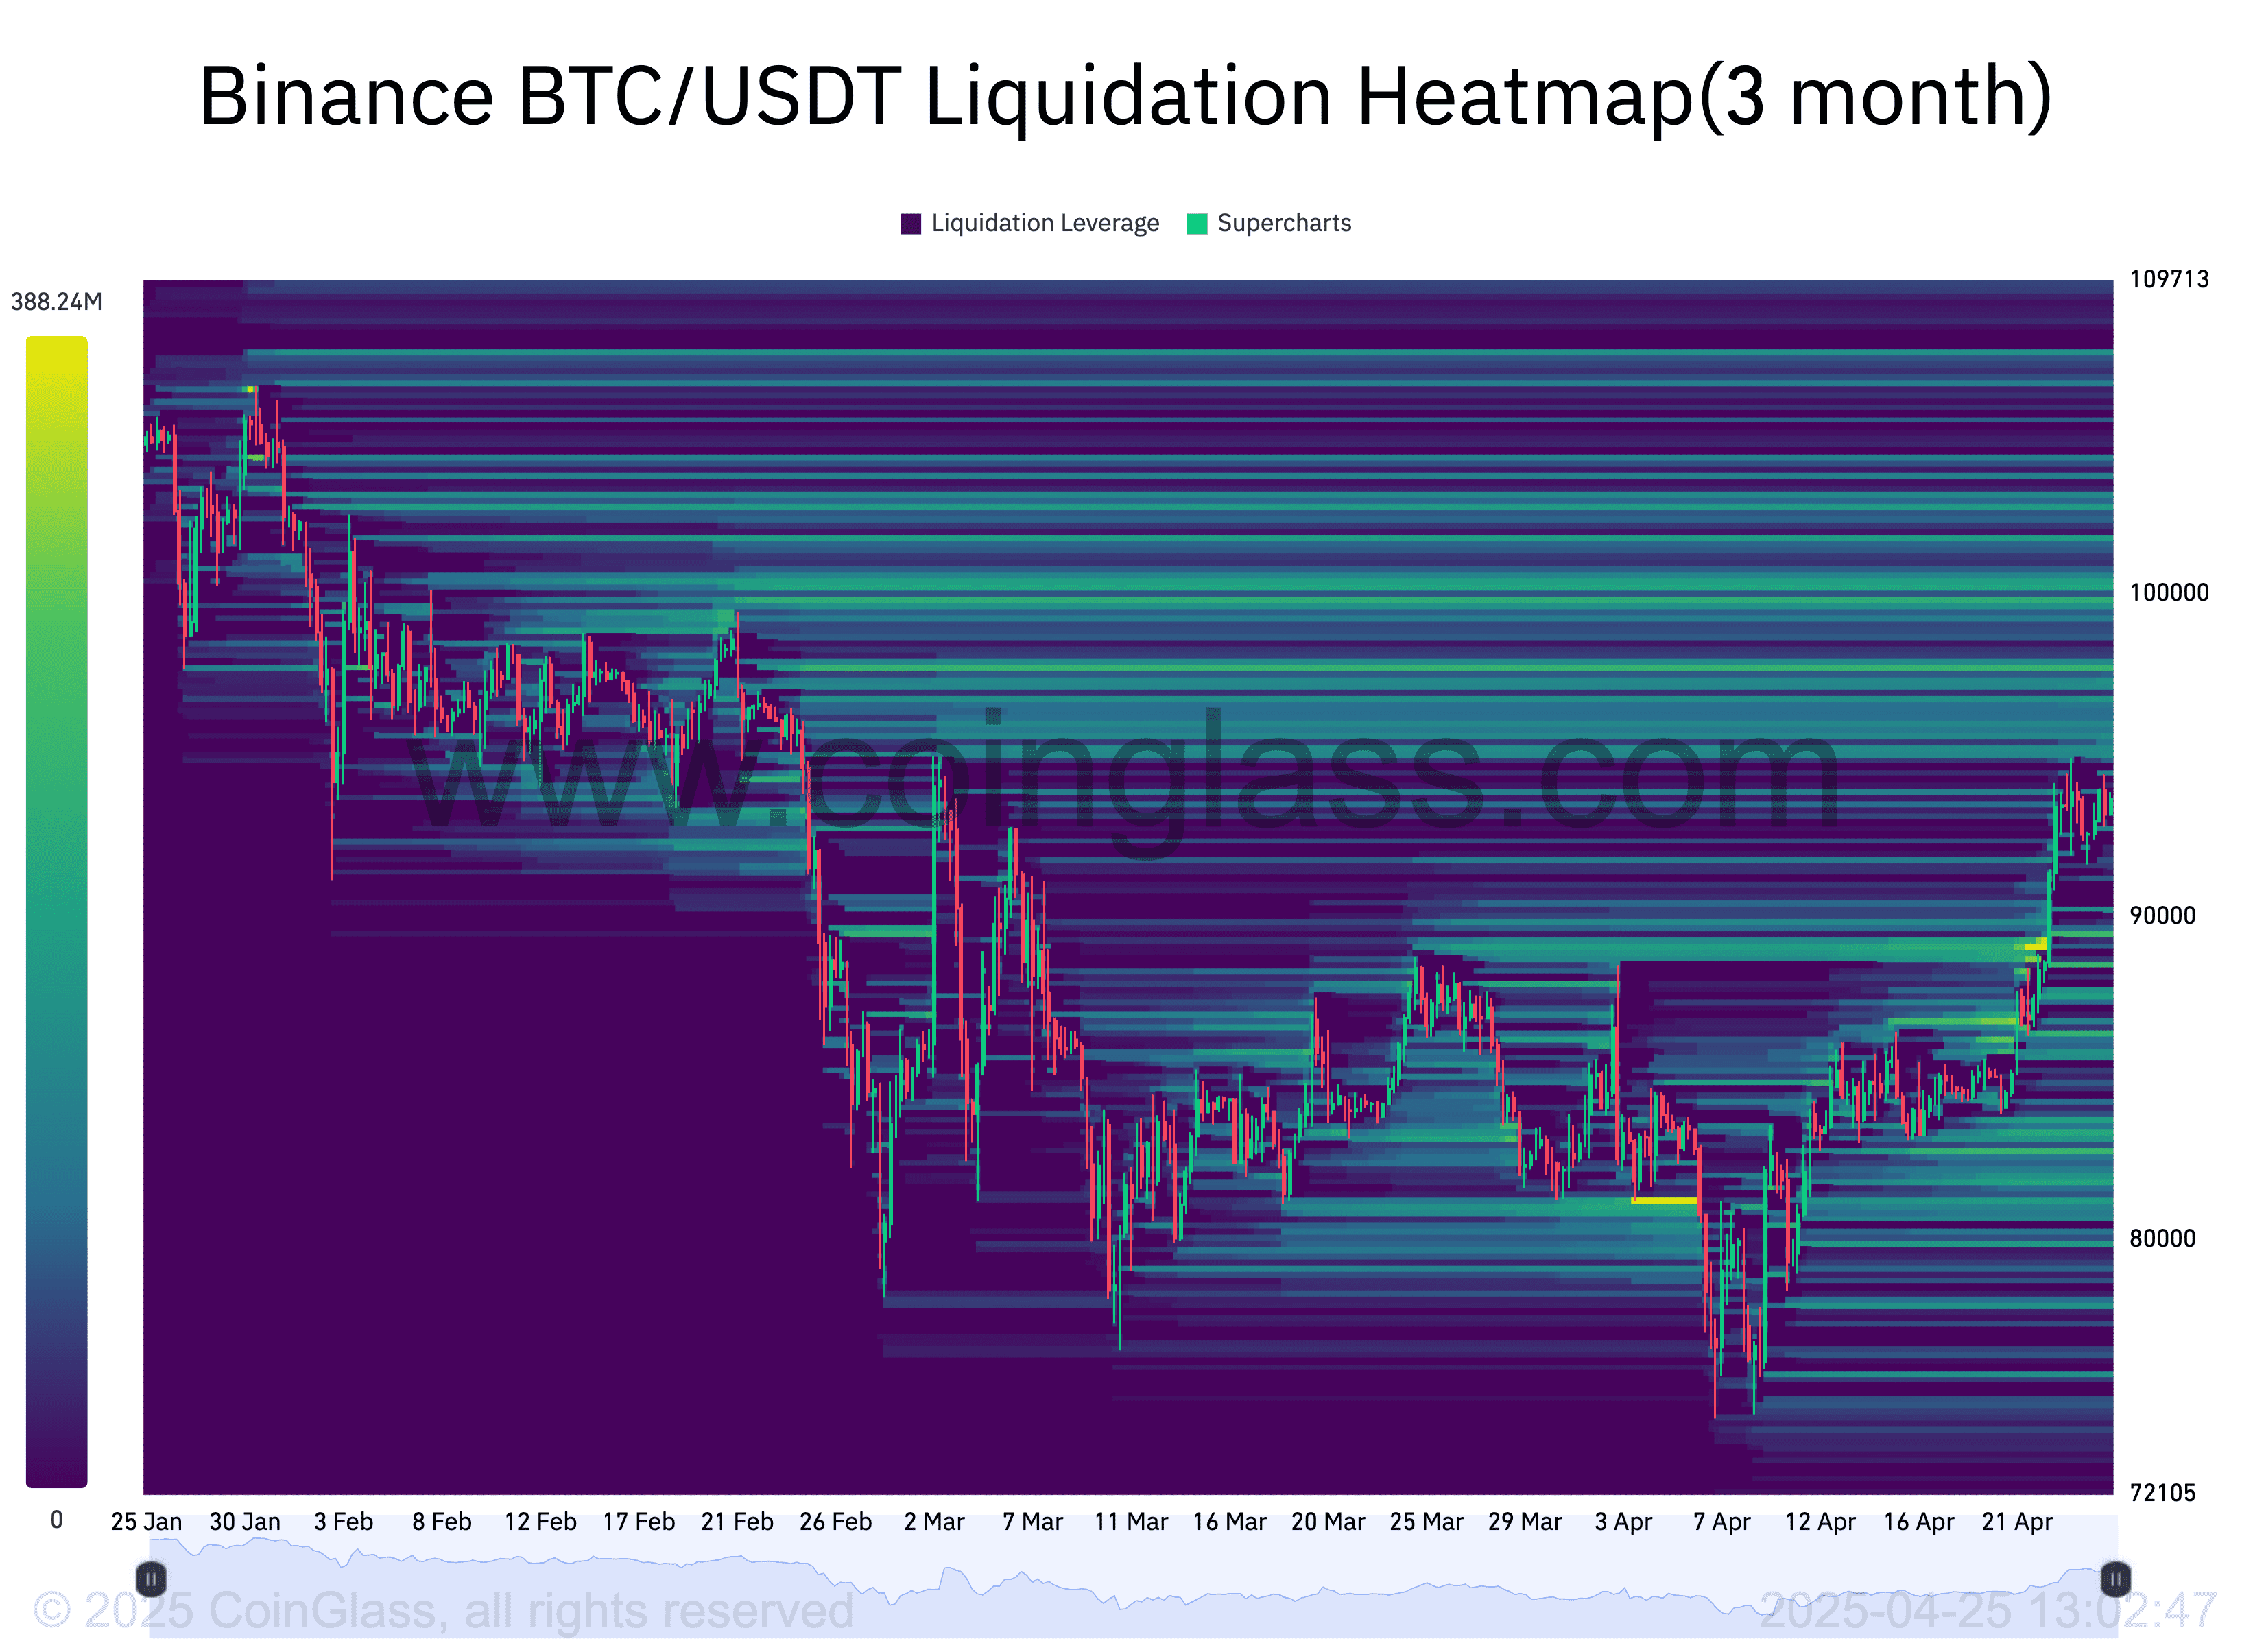
4. Liquidation Heatmap: A Magnet at $100,000
Liquidation data reveals a significant concentration of short positions around the $100,000 level. These positions can act as a magnet, pulling the price upwards as market makers target these liquidation points. If Bitcoin continues its ascent, it could trigger a short squeeze, accelerating the price increase.
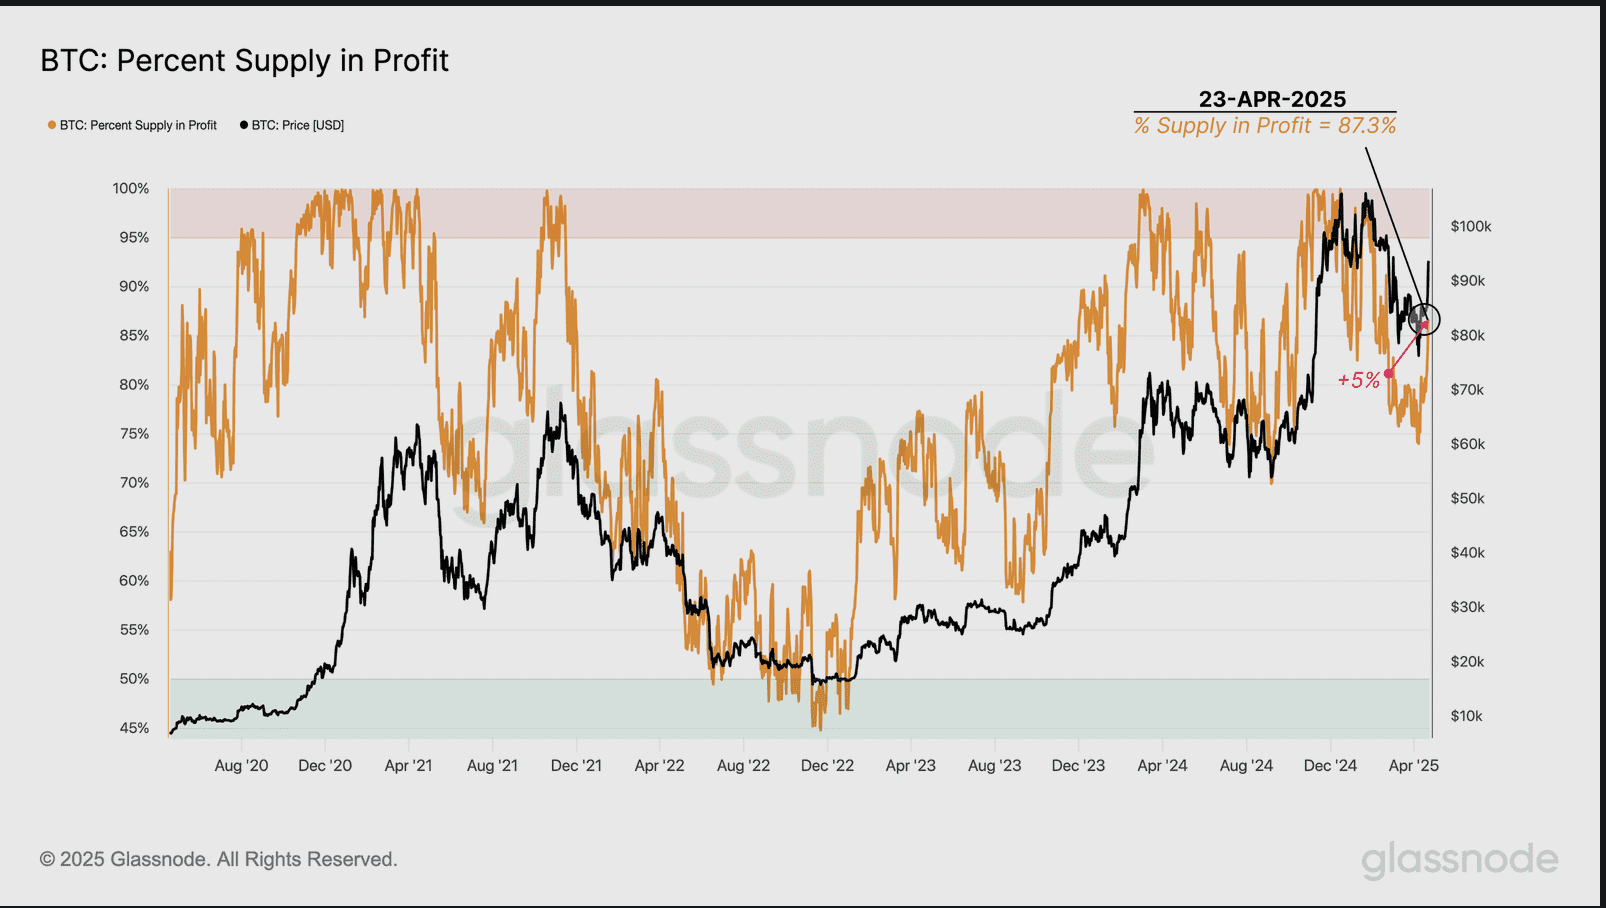
5. Bitcoin Profitability: Increasing Market Confidence
As of April 23, a substantial 87.3% of Bitcoin’s circulating supply is in profit, a notable increase from 82.7% when BTC traded near $94,000 in early March, based on Glassnode data. This increase suggests that a significant portion of Bitcoin was accumulated during the March correction, reflecting renewed market confidence. Historically, when the Percent Supply in Profit remains above 90% for an extended period, markets often enter a euphoric phase.
Factors That Could Hinder the Rally:
- Regulatory Uncertainty: Sudden changes in regulations can impact market sentiment negatively.
- Macroeconomic Factors: Global economic downturns or interest rate hikes could reduce investor appetite for risk assets like Bitcoin.
- Black Swan Events: Unforeseen events, such as major security breaches or geopolitical crises, could trigger significant market corrections.
Conclusion: Bullish Momentum Building
In conclusion, Bitcoin is exhibiting a confluence of bullish signals, including favorable technical chart patterns, positive on-chain data, and potential short squeeze dynamics in the derivatives market. While the $100,000 target by May remains a possibility, it’s important to acknowledge the inherent risks and uncertainties in the cryptocurrency market. Investors should conduct thorough research and exercise caution when making investment decisions.
Disclaimer: This analysis is for informational purposes only and should not be considered financial advice. Cryptocurrency investments are highly speculative and can result in significant losses. Always consult with a qualified financial advisor before making any investment decisions.