Bitcoin’s Path to $100K: ETF Inflows, Resistance Levels, and Expert Opinions
Bitcoin (BTC) has shown resilience, recovering from lows around $74,400. Recent gains have been fueled by significant inflows into spot Bitcoin ETFs. However, the question remains: can Bitcoin break through resistance at $95,000 and ultimately reach $100,000, or will these inflows signal a local top?
Key Factors Influencing Bitcoin’s Price
Several factors are at play in determining Bitcoin’s next move:
- ETF Inflows: Spot Bitcoin ETFs have seen substantial inflows, indicating strong investor demand. The recent weekly inflows of $3.06 billion are the largest since December 2025.
- Resistance Levels: Bitcoin faces significant resistance around $95,000 and $100,000. Breaking these levels will be crucial for further upward momentum.
- Market Sentiment: Expert opinions are divided, with some analysts predicting a push to $100,000 followed by a pullback, while others doubt Bitcoin’s ability to sustain gains above $95,000.
ETF Inflows: Bullish Signal or Warning Sign?
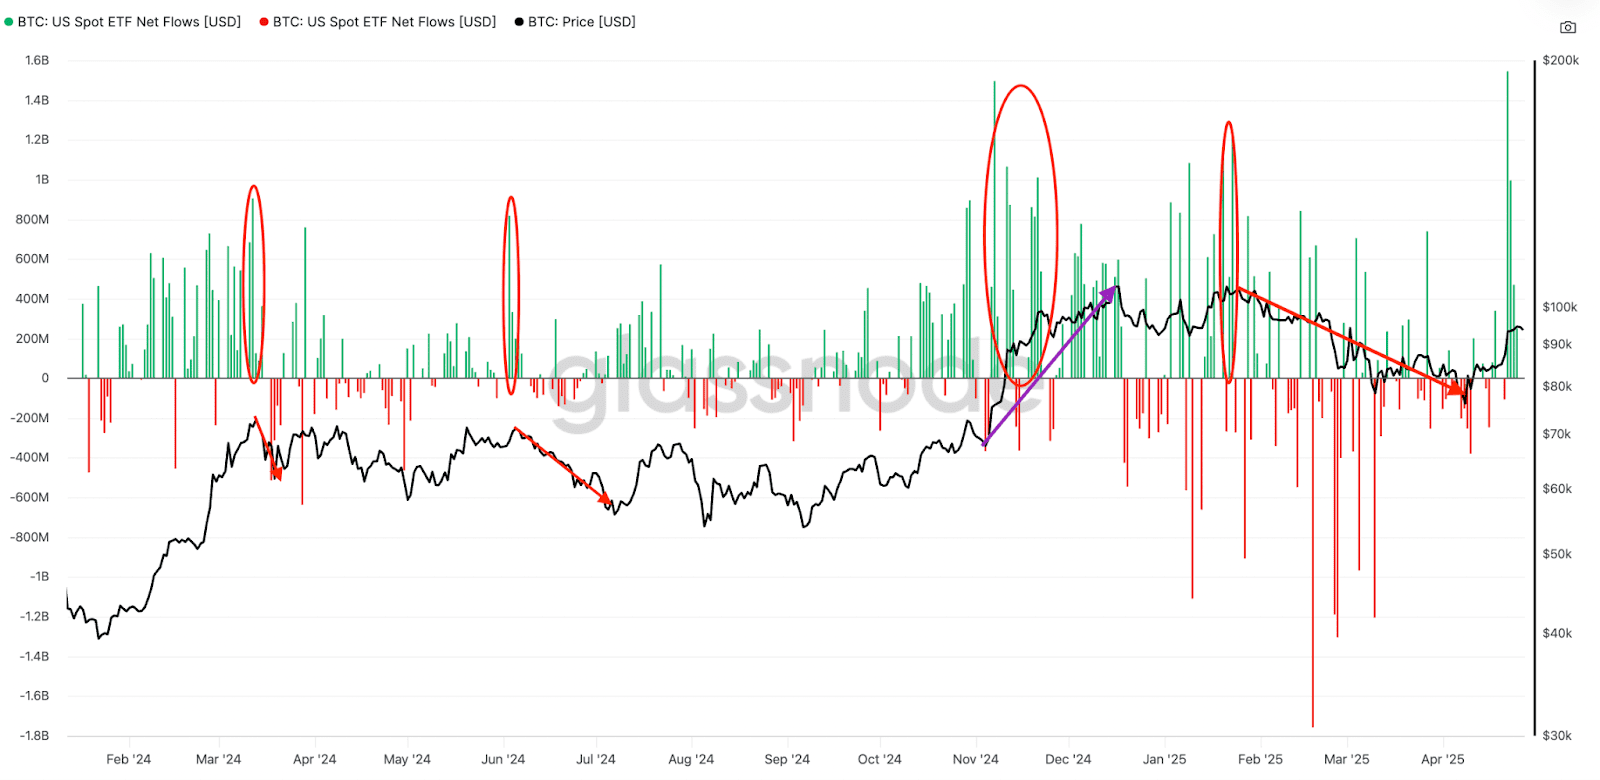
The impact of ETF inflows on Bitcoin’s price is complex. While large inflows often precede short-term price increases, they don’t always indicate a market top. Analyzing historical data provides valuable insights. For instance:
- March 2024: Record ETF inflows preceded Bitcoin’s all-time high of approximately $73,300.
- June 2024: Significant inflows coincided with a rally from $67,000 to $72,000, followed by a subsequent correction.
- November 2024: Substantial weekly inflows occurred as Bitcoin reached new all-time highs, eventually exceeding $100,000.
These examples demonstrate that the relationship between ETF inflows and Bitcoin’s price is not always straightforward. FalconX analysis suggests that inflows have short-term predictive power for price increases but not necessarily reversals.
Analyzing Resistance Levels
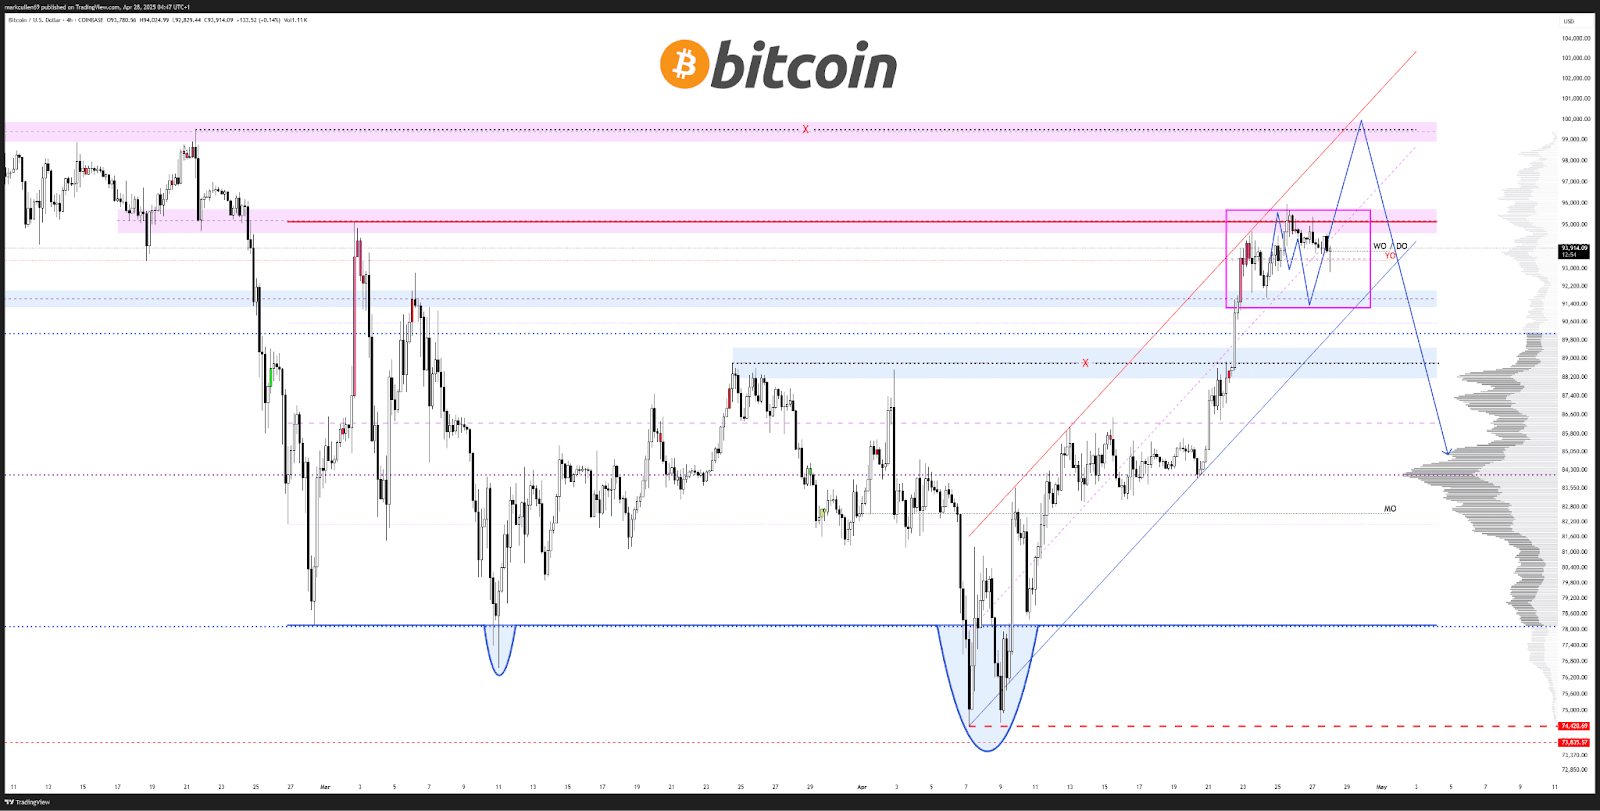
Bitcoin has successfully flipped key levels into support, including the 50-day, 100-day, and 200-day simple moving averages (SMA). However, it continues to consolidate under the $95,000 resistance level.
Popular analyst AlphaBTC notes that the $95,000 level has acted as a barrier to Bitcoin’s price. Overcoming this resistance is essential for continued upward movement.
Expert Opinions and Market Sentiment
The cryptocurrency community is actively debating Bitcoin’s potential to reach $100,000. AlphaBTC anticipates a push to $100,000, followed by a significant pullback. However, other analysts are more cautious. Keith Alan, co-founder of Material Indicators, expresses doubts about Bitcoin’s ability to sustain a move above $95,000. Trading firm QCP Capital suggests that Bitcoin currently lacks the catalyst needed to propel it toward $100,000.
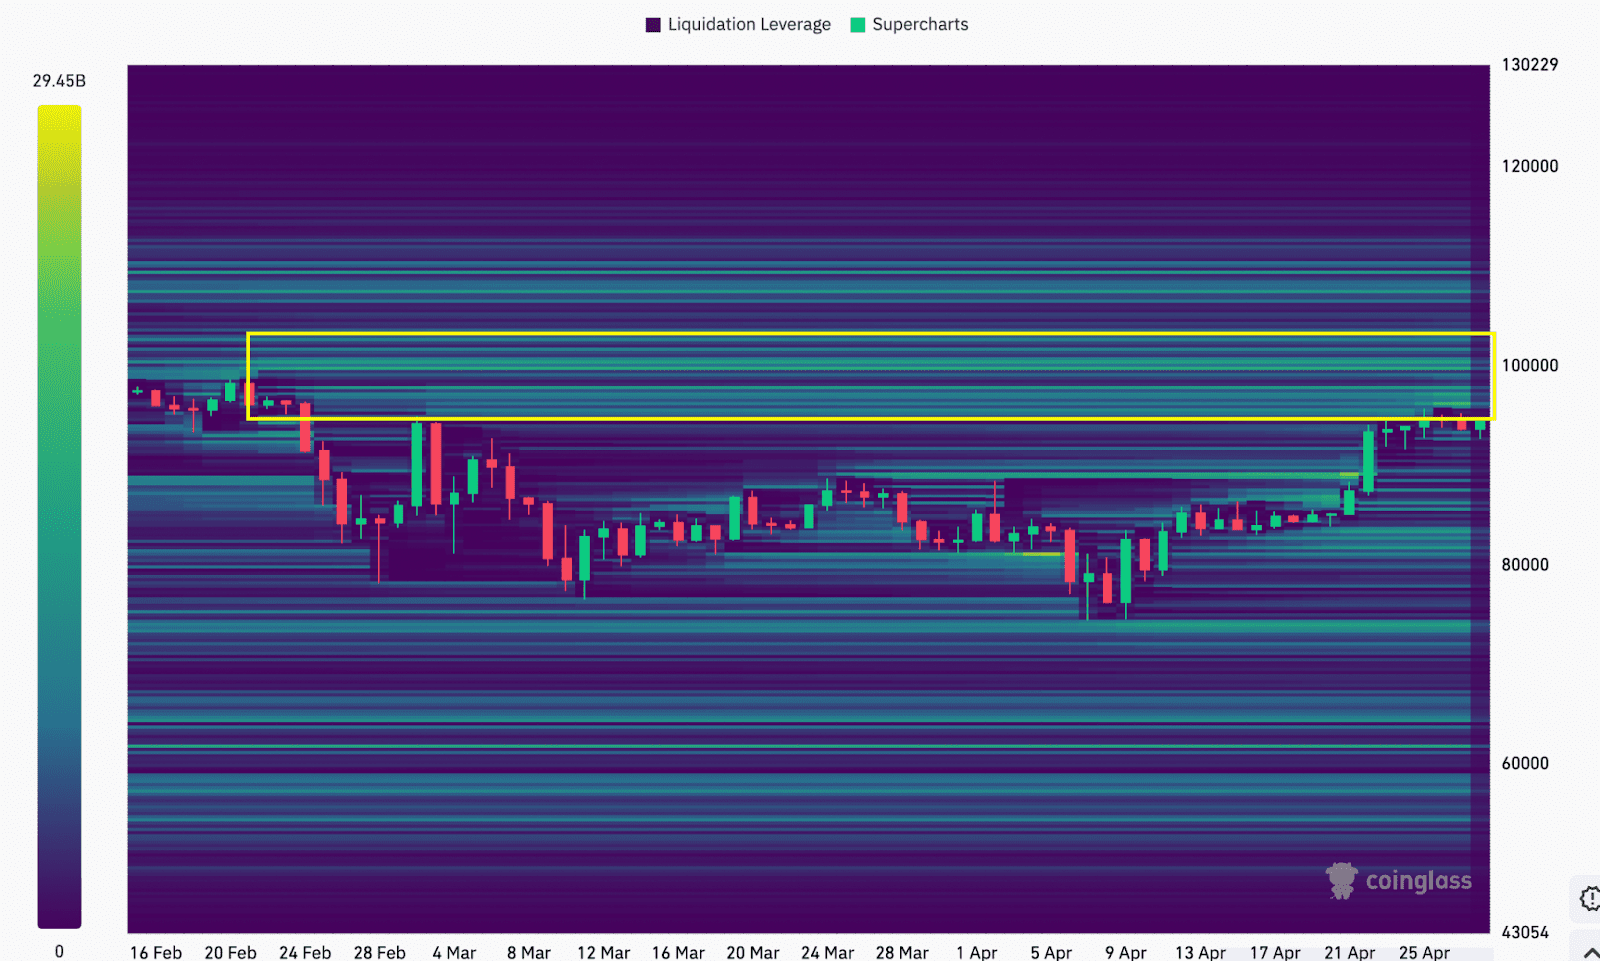
Data from CoinGlass reveals substantial seller interest in the $97,000-$100,000 range, indicating potential headwinds for Bitcoin’s price.
Conclusion: A Cautious Outlook
Bitcoin’s recent rally and substantial ETF inflows present a mixed picture. While the bullish momentum is undeniable, significant resistance levels and divided expert opinions suggest caution. Bitcoin’s ability to break through the $95,000 and $100,000 barriers will be crucial in determining its short-term trajectory. Investors should carefully monitor market sentiment, ETF flows, and key resistance levels to make informed decisions. A pullback after reaching 100k is highly possible.