Bitcoin (BTC) is showing signs of a potential surge towards $140,000, driven by several key factors. While the price has seen some retracement, strong fundamentals and market dynamics suggest significant upside potential.
Key Indicators Suggesting a Bullish Bitcoin Future
- Strong ETF Inflows: Spot Bitcoin ETFs have seen substantial net inflows, mirroring patterns observed during past rallies.
- Whale Accumulation: Large Bitcoin holders are actively increasing their holdings, signaling confidence in future price appreciation.
- Declining Exchange Balances: The amount of Bitcoin held on exchanges is decreasing, indicating a reduced willingness to sell.
- Rising Network Activity: Increased transaction volumes suggest growing interest and participation in the Bitcoin network.
- Risk-On Sentiment: Market volatility is decreasing, creating a favorable environment for risk assets like Bitcoin.
- Technical Analysis: Chart patterns suggest a potential breakout towards the $140,000 target.
Spot Bitcoin ETF Inflows Mirroring Past Rallies
Spot Bitcoin ETFs have played a crucial role in the recent price recovery. Over a two-week period, these ETFs saw $2.9 billion in net inflows. This trend echoes previous rallies, demonstrating the significant impact of institutional investment.
Following the launch of US-based spot Bitcoin ETFs in January 2024, these investment products experienced net inflows of approximately $8.5 billion between February 13, 2024, and March 13, 2024. A record single-day inflow of $1.045 billion was observed on March 12, 2024.
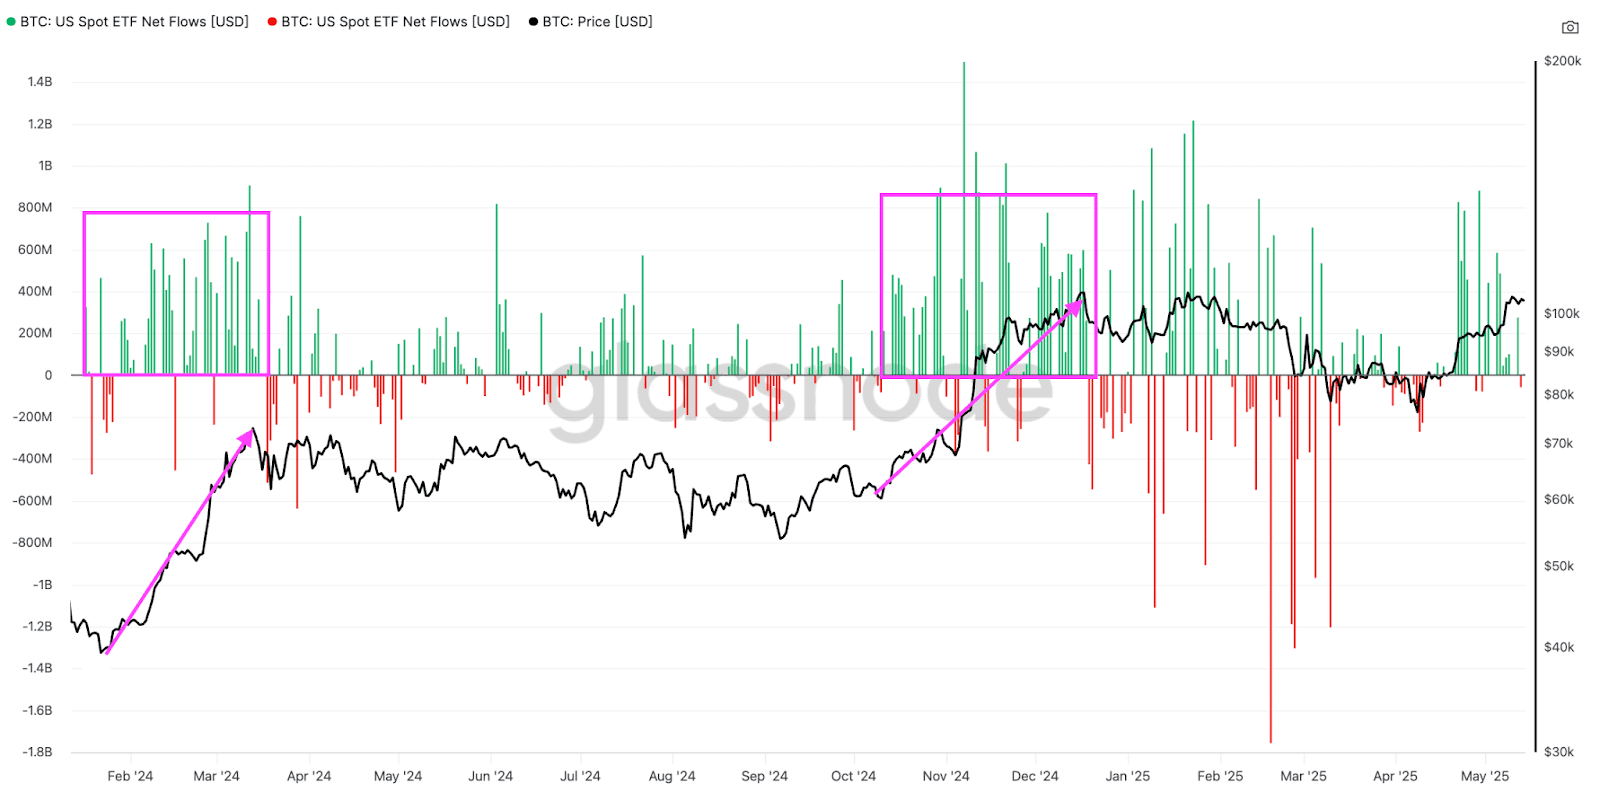
Between November 6, 2024, and December 16, 2024, cumulative daily inflows reached $5.7 billion, coinciding with Bitcoin’s 60% rally from $67,000 to $108,000. Continued ETF inflows could propel Bitcoin towards new all-time highs.
Market Volatility and Risk-On Sentiment
The CBOE Volatility Index (VIX), which measures market volatility expectations, has dropped significantly. A VIX score below 18 indicates a “risk-on” environment, favoring assets like Bitcoin. This decreased volatility suggests increased confidence among investors.
Bitcoin network economist Timothy Peterson highlighted the substantial drop in the VIX index, noting that it signals a favorable environment for Bitcoin’s growth.
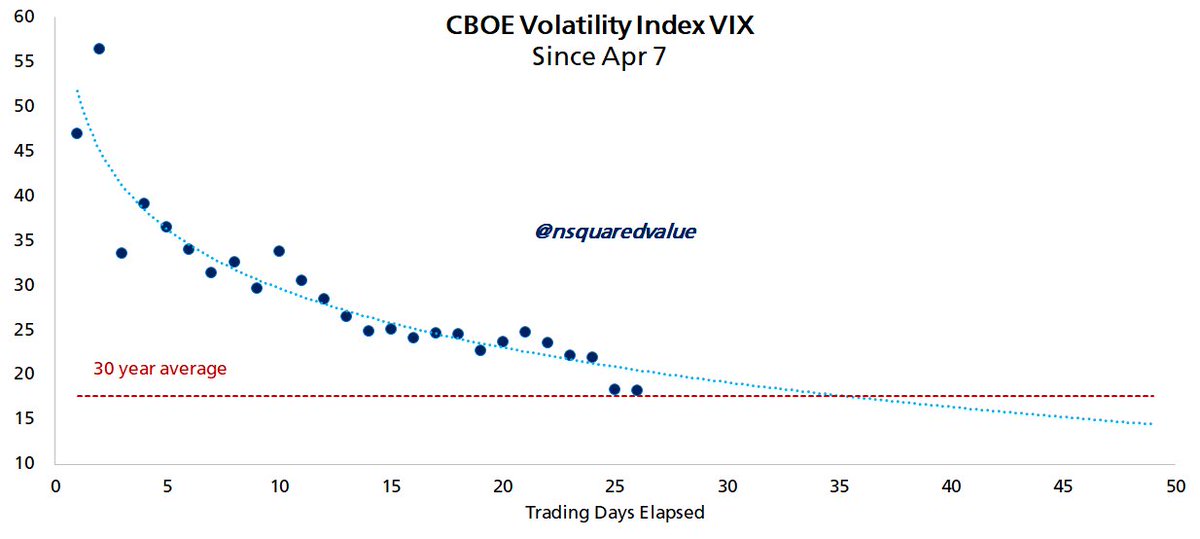
Peterson’s model predicts a $135,000 target within the next 100 days if the VIX remains low, further reinforcing the bullish outlook.
Bitcoin Whale Accumulation
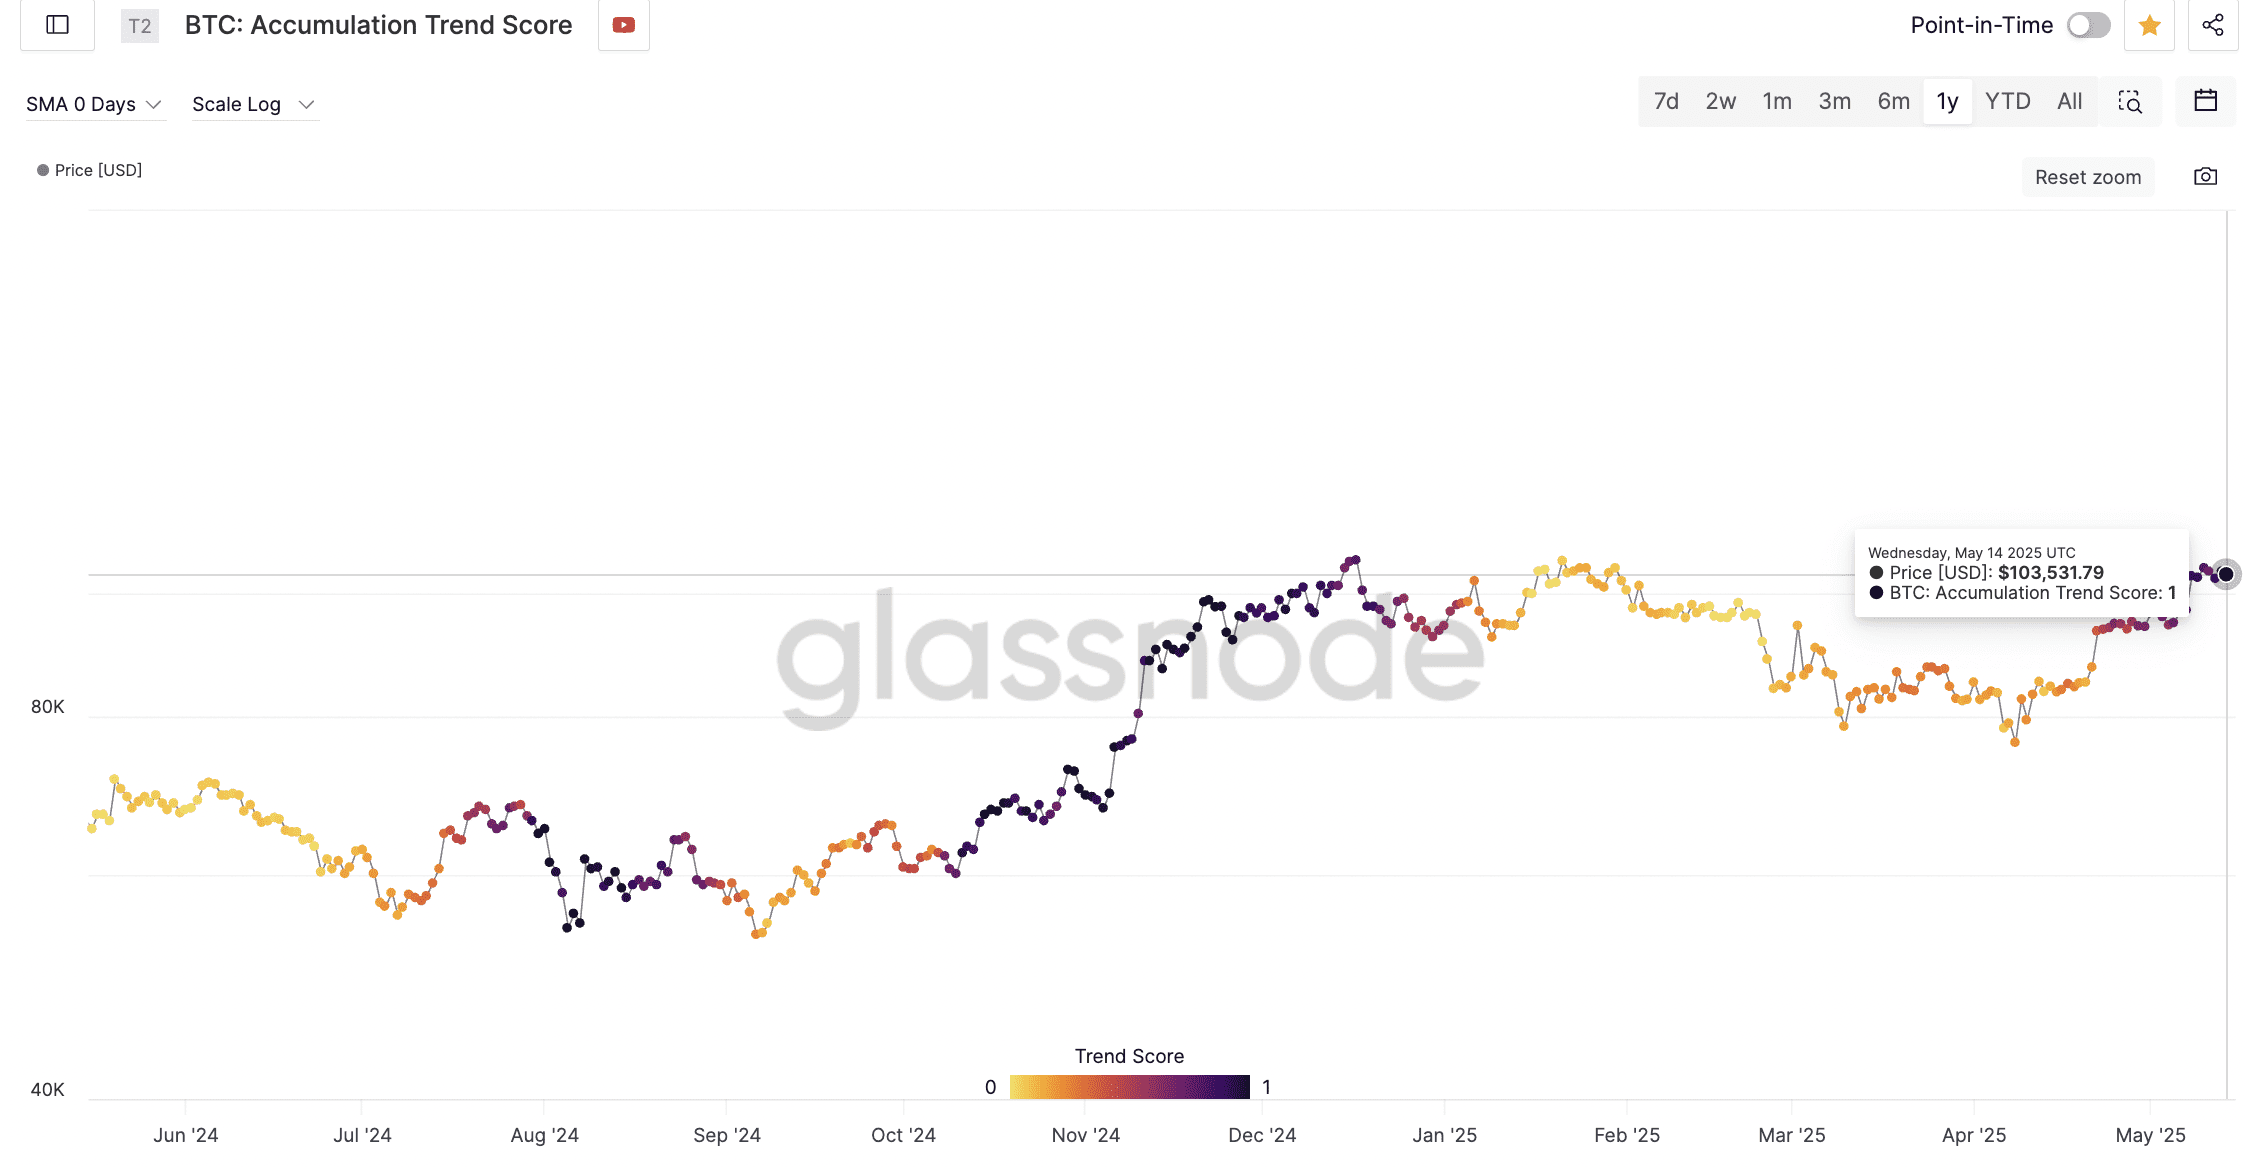
Bitcoin whales have been actively accumulating BTC, even as the price has increased. The Bitcoin Accumulation Trend Score (ATS) is currently at 1, indicating intense accumulation by large investors. This suggests a strong belief in Bitcoin’s long-term potential.
Glassnode data shows a transition from distribution to accumulation across most investor cohorts. This pattern mirrors a similar accumulation phase in October 2024, which preceded a significant price increase.
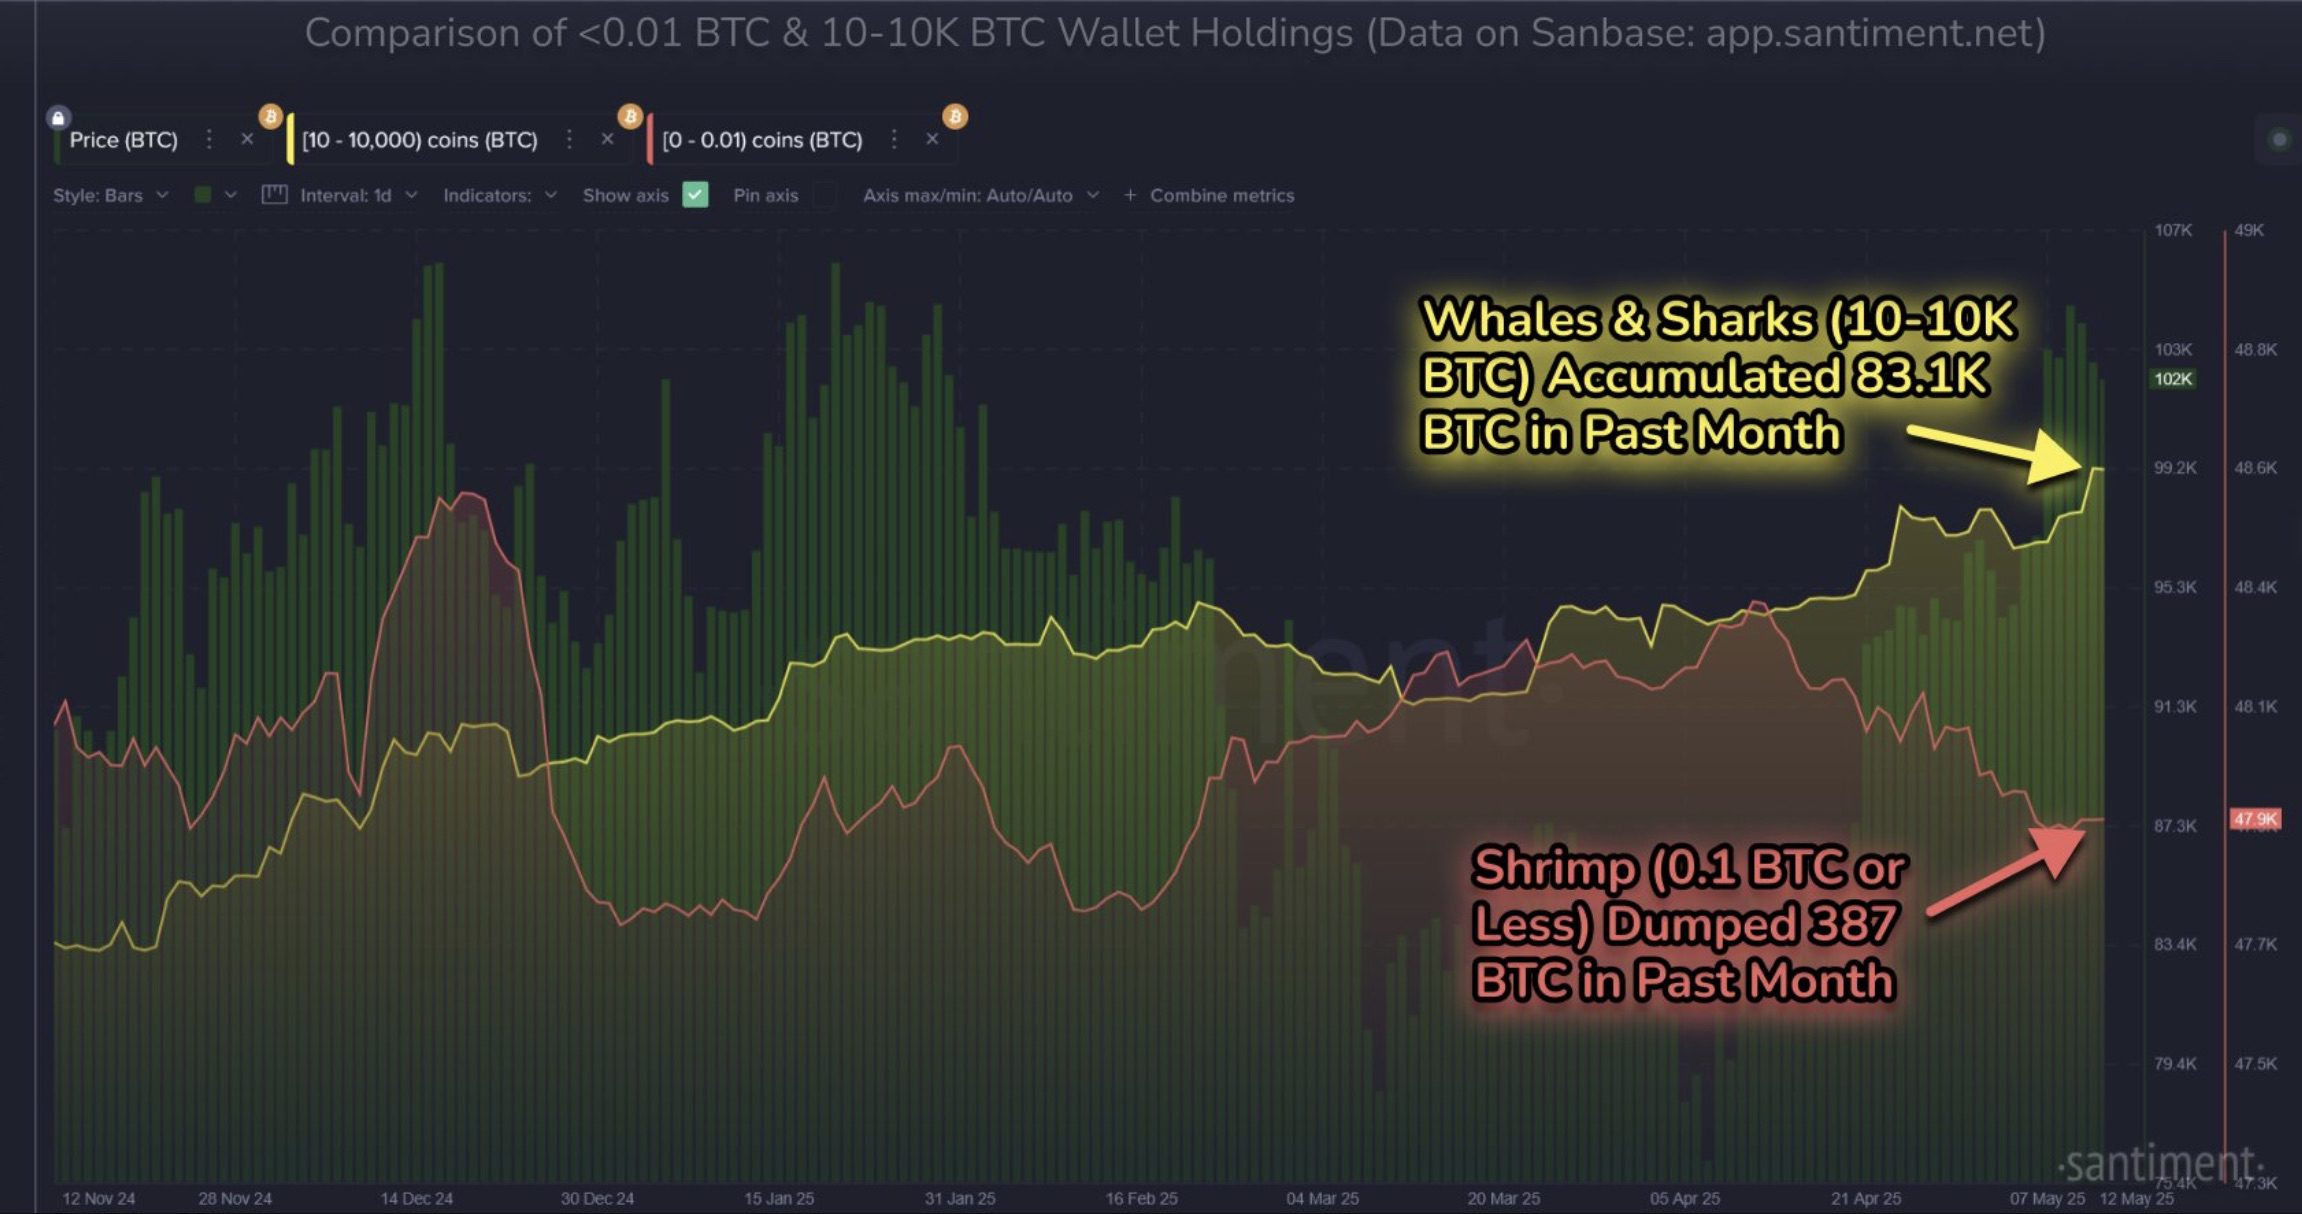
Addresses holding between 10 BTC and 10,000 BTC have accumulated 83,105 more BTC in the past 30 days, according to data from Santiment. This aggressive accumulation from large wallets suggests a potential breach of the $110,000 all-time high.
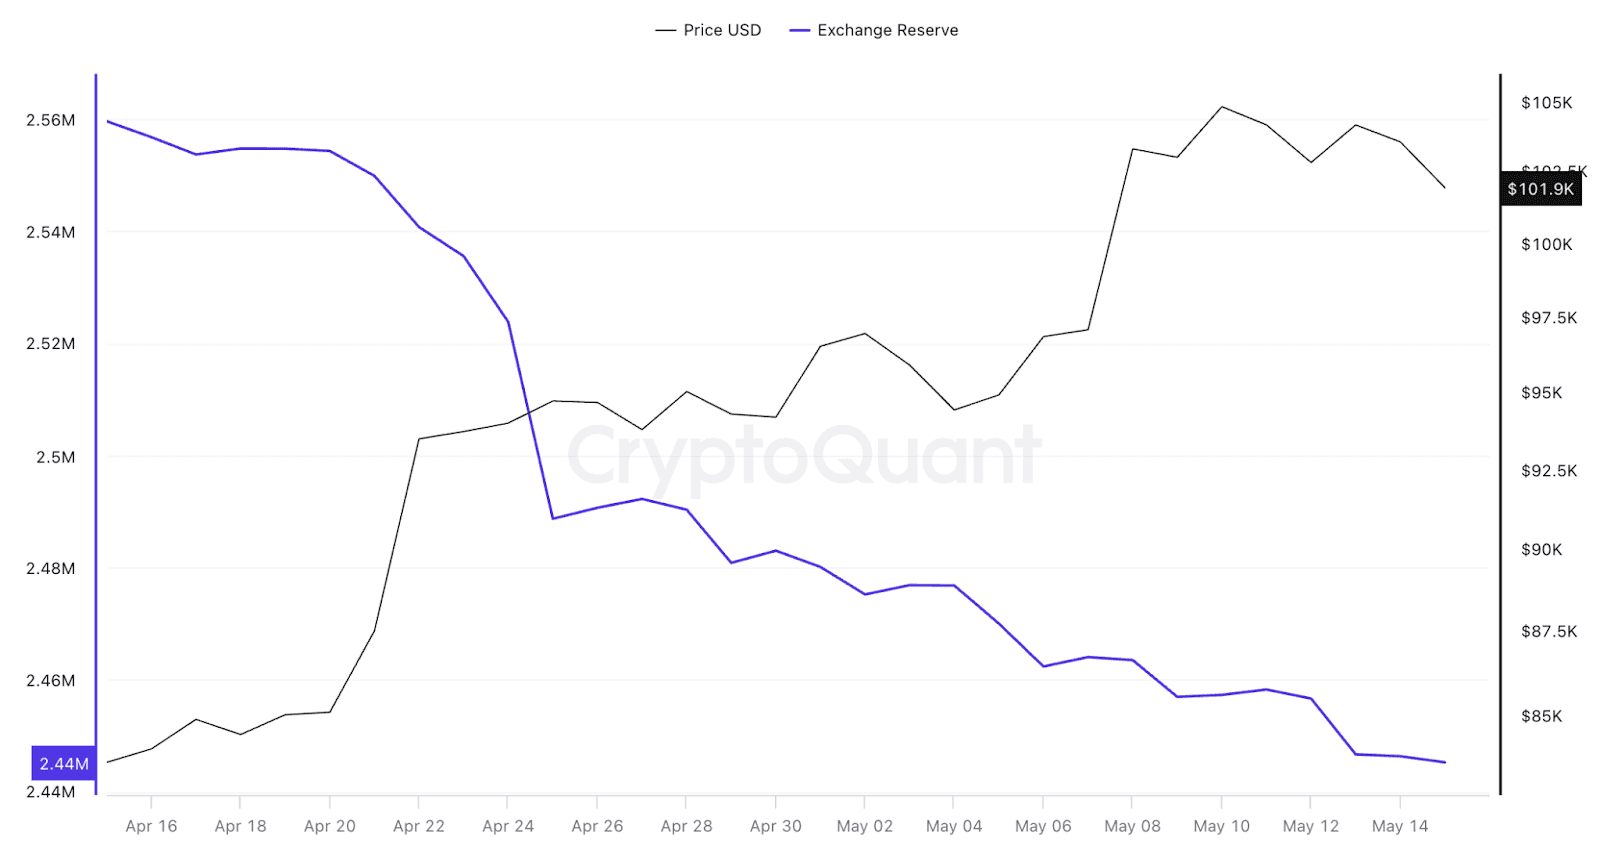
Decreasing Bitcoin Balance on Exchanges
The BTC balance on exchanges has reached a six-year low, with over 110,000 BTC moved off exchanges in the last 30 days. This suggests that investors are withdrawing their tokens into self-custody wallets, indicating a long-term holding strategy rather than an intention to sell.
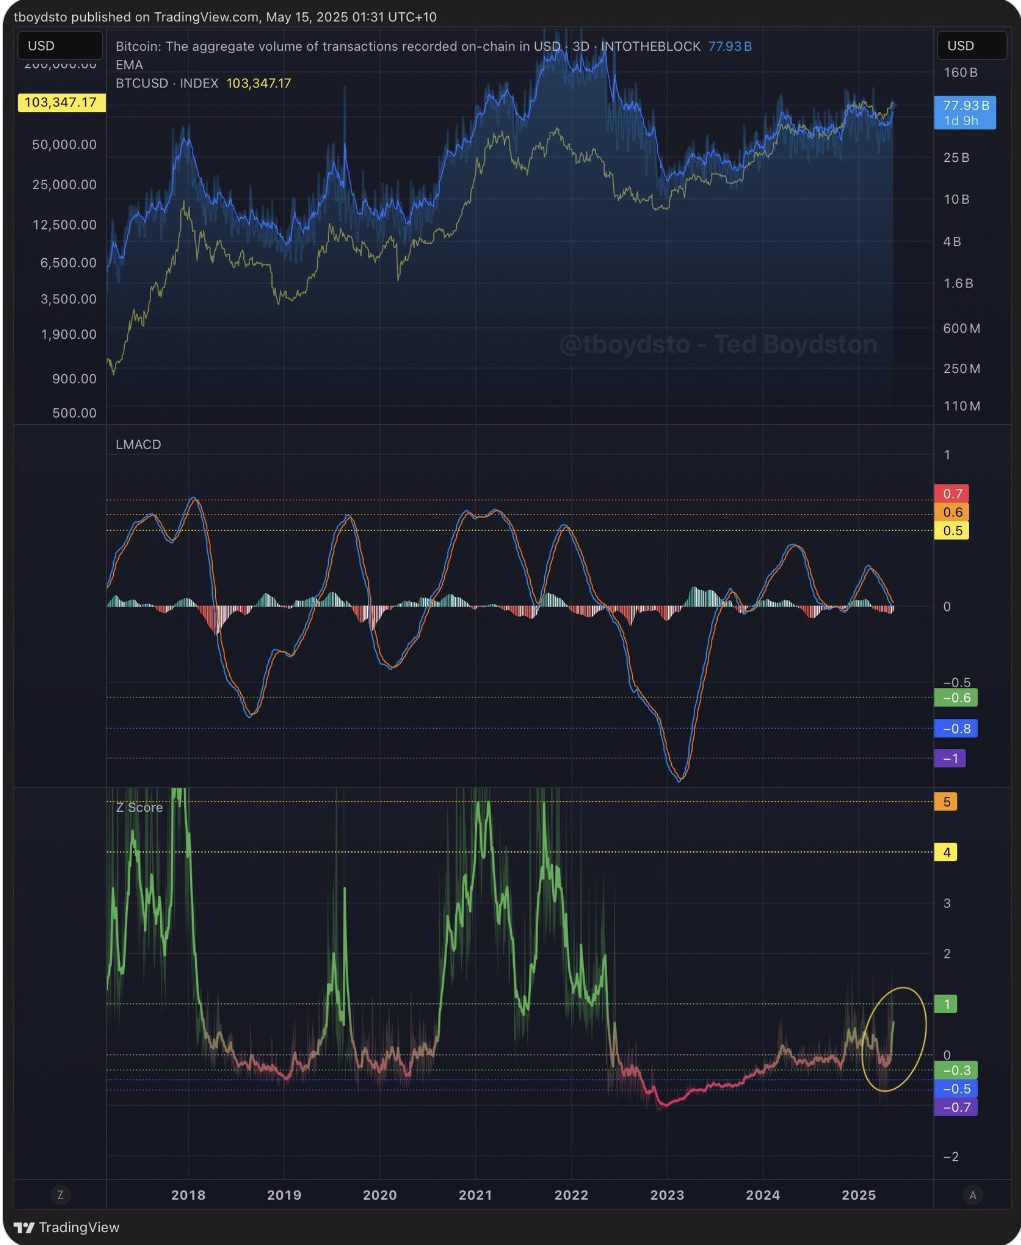
Increased Bitcoin Network Activity
Increased network activity further supports Bitcoin’s potential price increase. The Bitcoin transaction volume Z-score, which measures the difference between current and average transaction volume, is rising sharply.
A rising transaction volume Z-score, particularly when it approaches or exceeds 1, is historically associated with Bitcoin price rallies, indicating growing interest and participation in the network.
Technical Analysis: Rounded Bottom Pattern Targets $140K
From a technical analysis perspective, Bitcoin’s price has formed a rounded bottom chart pattern on the daily chart. A daily candlestick close above the neckline of this pattern at $106,660 would confirm a bullish breakout, potentially driving BTC towards a $140,000 target. This represents a 37% increase from current levels.
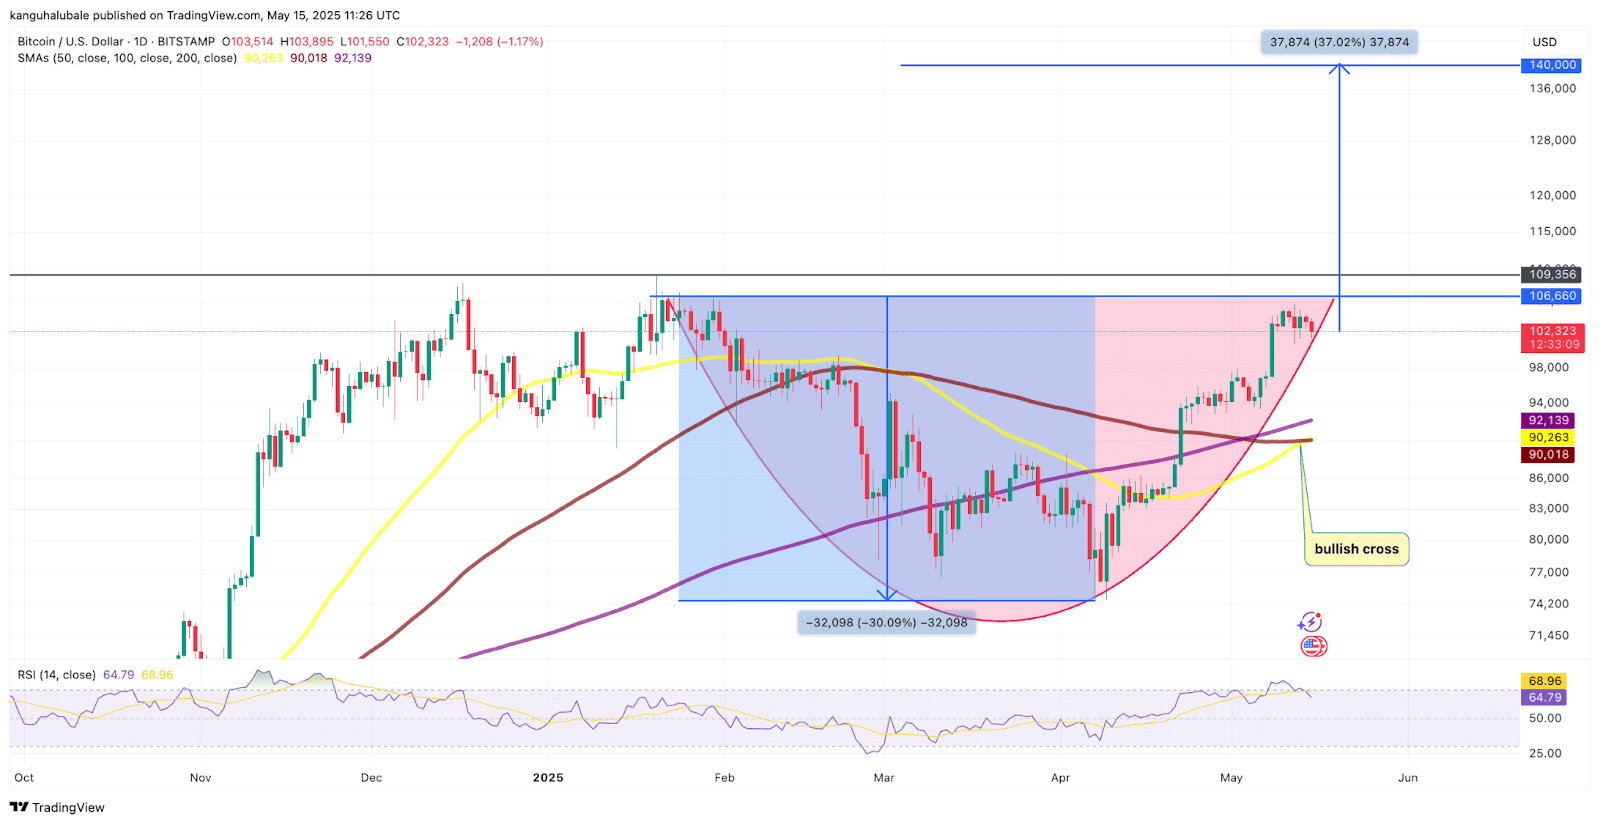
The relative strength index (RSI) is at 70, and a bullish cross from the SMAs suggests that market conditions still favor the upside, potentially exceeding $140,000. Furthermore, Bitcoin has broken out of a bull flag in the weekly timeframe, projecting a rally to $150,000.
Disclaimer: This article is for informational purposes only and should not be considered financial advice. Cryptocurrency investments are highly volatile and risky. Conduct thorough research before making any investment decisions.