Bitcoin (BTC) reached a new all-time high of $111,970 on May 22nd before retracing to around $110,700. This surge has sparked debate among traders and analysts about whether Bitcoin’s price is overheating or if this is a natural correction within a healthy upward trend.
Key Takeaways:
- New All-Time High: Bitcoin peaked at $111,970 on May 22nd.
- Mixed Signals: Analysts disagree on whether the current price level indicates an overheated market.
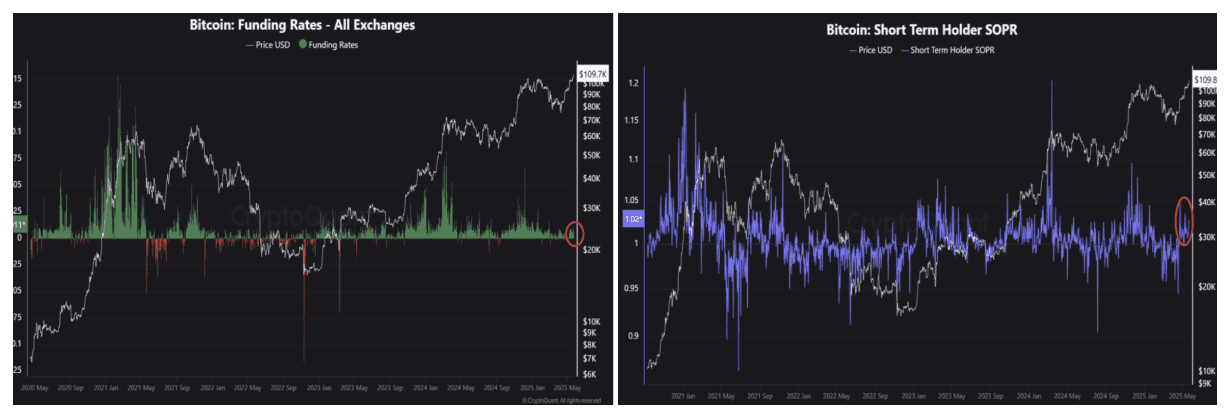
- Funding Rates: Funding rates suggest a healthy upward phase.
- RSI: Bitcoin’s relative strength index, or RSI, displays overbought conditions.
Is Bitcoin Overheated? Analyst Perspectives
CryptoQuant analyst Crypto Dan suggests Bitcoin is “still not overheated,” citing low funding rates and limited profit-taking by short-term investors compared to previous peaks.
Funding Rate Analysis:
The funding rate, which reflects the cost of holding long positions in the futures market, is moderately positive, indicating optimism among traders but not excessive speculation. This suggests that buyers are willing to pay a fee to hold their positions, which supports the upward price trend.
Short-Term Holder (STH) SOPR:
The STH Spent Output Profit Ratio (SOPR) metric shows that while short-term holders are returning to profit, few are taking profits at the current levels. This indicator, currently valued at 1.02%, suggests a moderate level of profit realization compared to significant profit-taking events in the past, such as March 2024.
MVRV Z-Score:
The MVRV Z-score, which compares Bitcoin’s market value to its realized value, has surged recently but remains below the overvalued red zone. Historically, Bitcoin bull runs start with a surge in MVRV Z-score and end when the metric enters the red zone. The current score of 2.8 indicates that the market top is not yet in, suggesting further potential for price appreciation.
Technical Indicators: RSI and Fear & Greed Index
While fundamental metrics suggest continued growth, technical indicators present a more cautious outlook:
Relative Strength Index (RSI): Bitcoin’s RSI shows overbought conditions in shorter timeframes (12-hour and daily charts), indicating potential exhaustion in the current rally. An RSI above 70 typically suggests that an asset is overbought and may be due for a correction.
Crypto Fear & Greed Index: The index is currently at 78, signaling “extreme greed” in the market. Historically, extreme greed levels have often preceded market corrections, as investors become overly optimistic and prices become unsustainable.
The RSI measures the speed and change of price movements. RSI values over 70 is usually interpreted as a sign of overbought conditions.
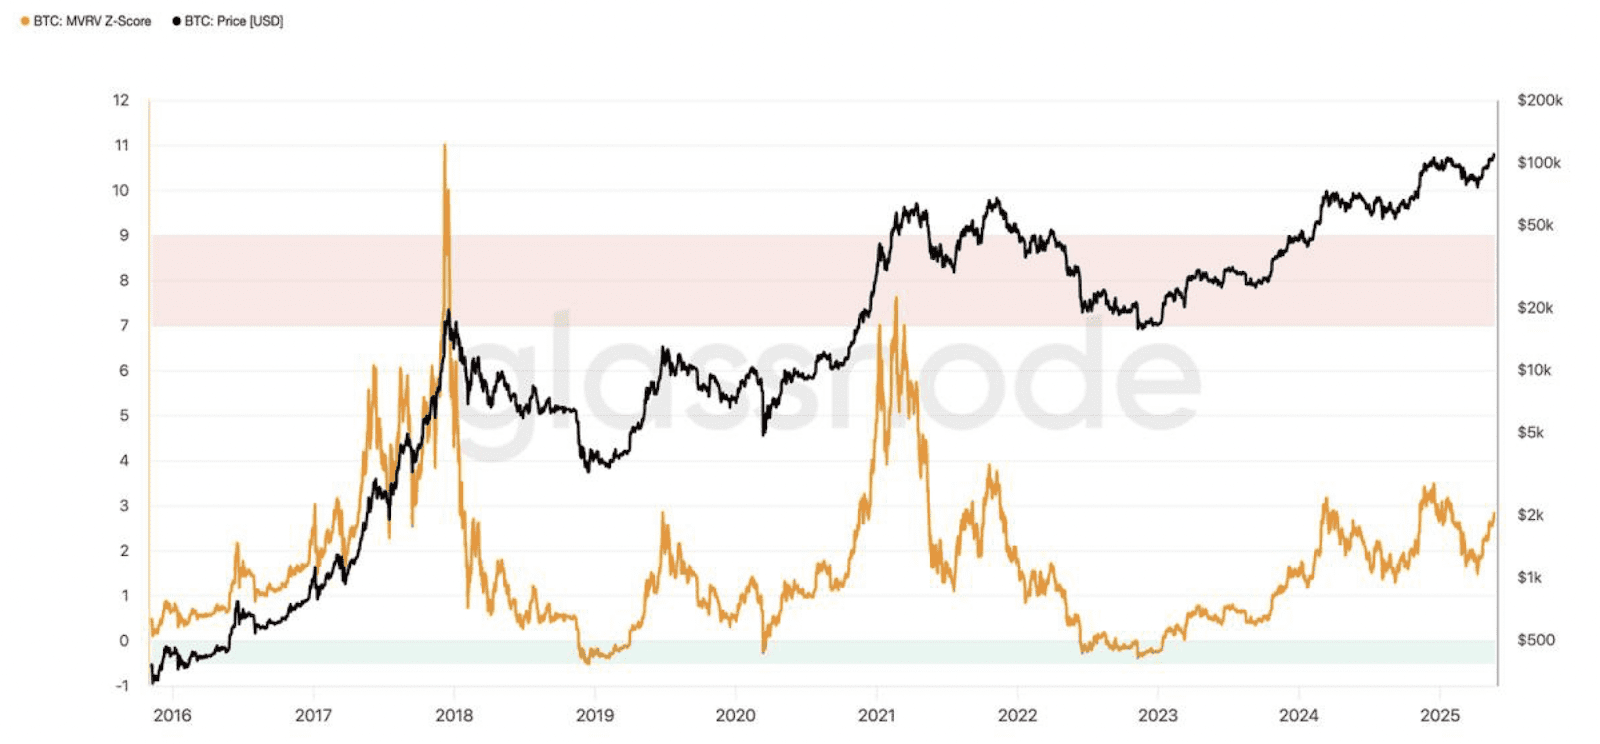
Bitcoin’s MVRV Z-score is a metric that compares BTC’s market value to its realized value and adjusts for volatility.
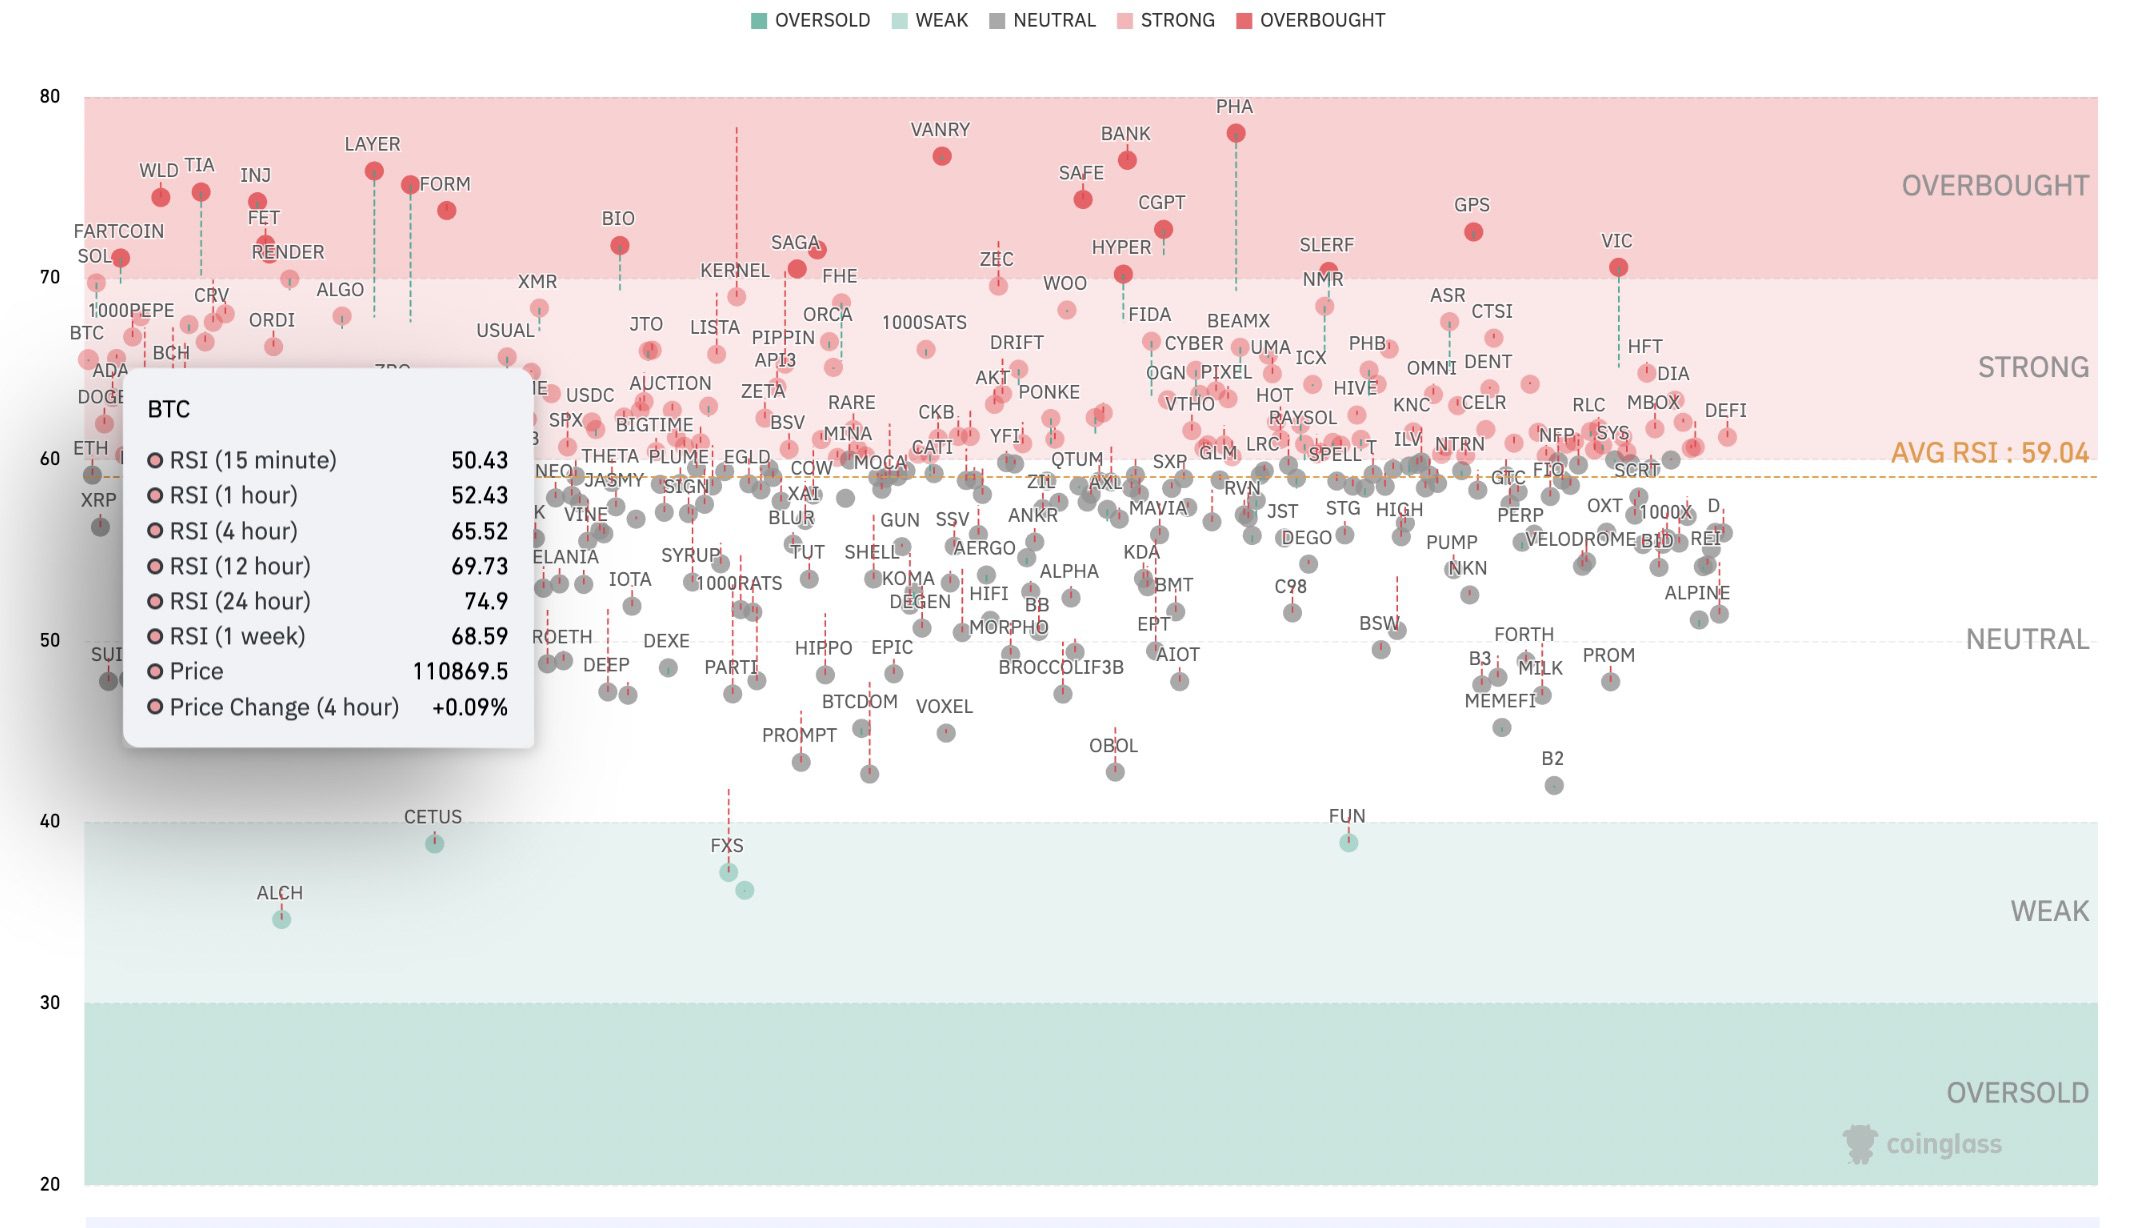
The RSI measures the speed and change of price movements.
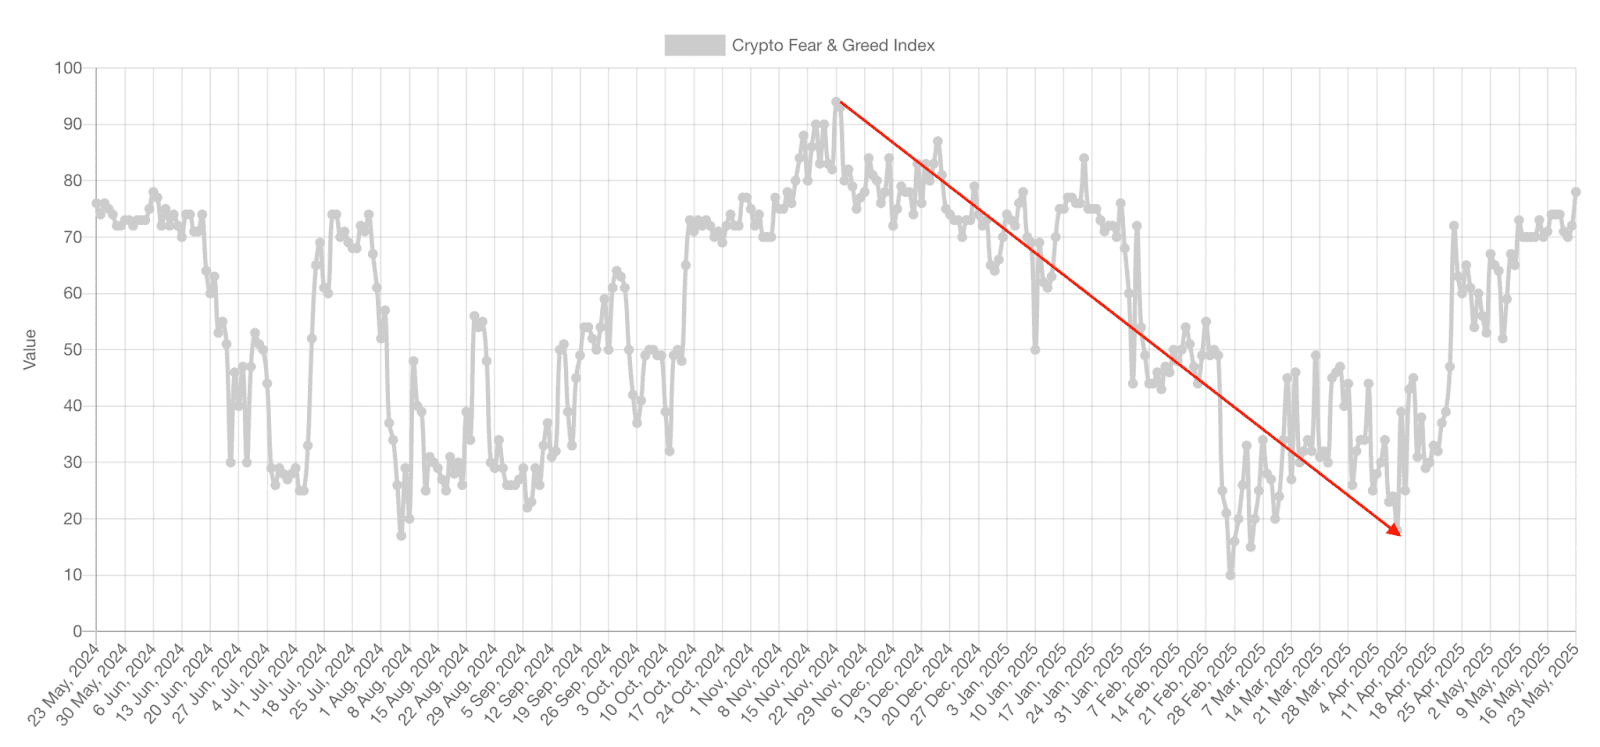
The Crypto Fear and Greed Index is an index that measures the emotions and sentiments of market participants.
The Role of ETFs and Trade Tensions
Despite potential risks, Bitcoin’s price could continue to rally due to factors like:
- Increasing Spot ETF Demand: The growing popularity of Bitcoin spot ETFs suggests strong institutional and retail interest.
- Easing Trade War Tensions: A more stable global economic environment could further support Bitcoin’s price.
Conclusion: A Balanced Perspective
Bitcoin’s new all-time high presents a complex picture. While fundamental indicators suggest continued upward potential, technical indicators caution against excessive optimism. Traders should manage risks carefully, considering both the positive momentum and the potential for a correction.
Ultimately, whether Bitcoin’s price is overheating remains a subject of debate. Investors should conduct their own research and consider their individual risk tolerance when making investment decisions.
This article does not contain investment advice or recommendations. Every investment and trading move involves risk, and readers should conduct their own research when making a decision.