Key Takeaways:
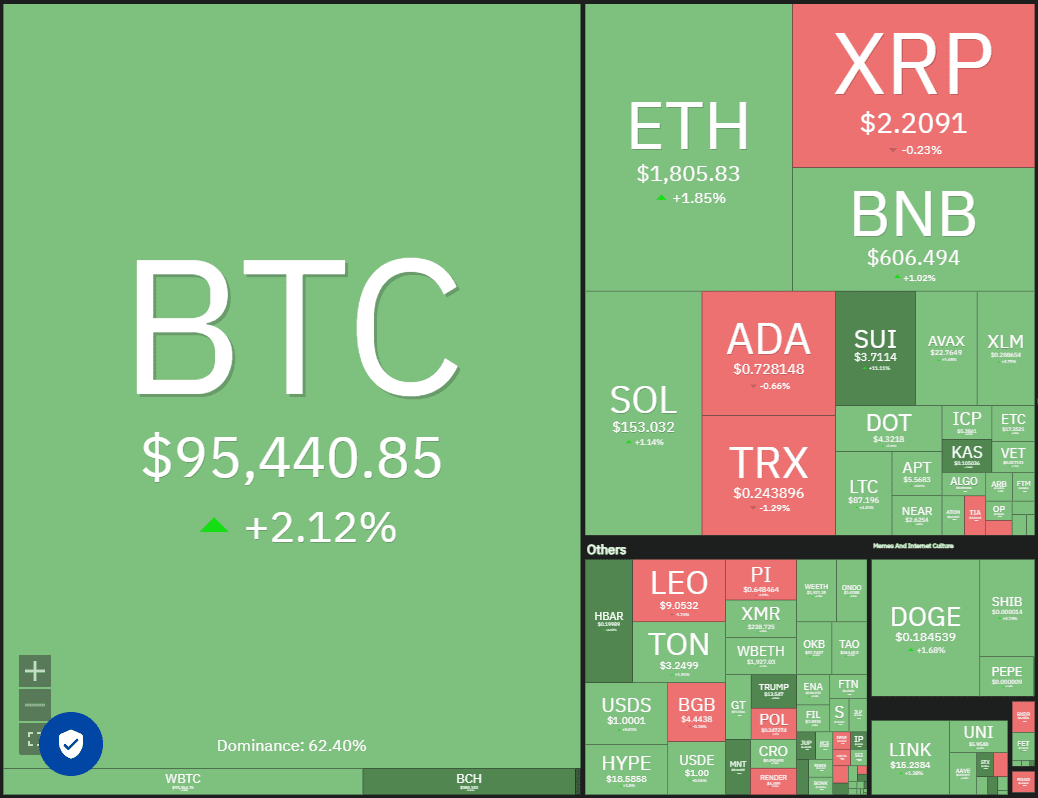
- Bitcoin’s price is testing $95,000, fueled by renewed institutional demand, increasing the likelihood of a surge to $100,000.
- A strong Bitcoin performance could trigger breakouts in select altcoins.
- Analysis of top 10 cryptocurrencies reveals potential price movements based on key technical indicators.
Bitcoin (BTC) is attempting to maintain its position above $95,000, a level that is attracting significant attention from both bulls and bears. The primary question on traders’ minds is whether Bitcoin can overcome resistance and reach the coveted $100,000 mark or if a pullback is imminent.
Recent data from Farside Investors shows increased inflows into US spot Bitcoin exchange-traded funds since April 21st, signaling renewed institutional interest. According to Coinbase Institutional’s head of strategy, John D’Agostino, this surge in Bitcoin purchases by institutions is driven by a desire to hedge against currency inflation and macroeconomic uncertainty. Bitcoin is increasingly being viewed as a digital equivalent to gold.
However, some analysts caution against assuming the sustainability of the current Bitcoin rally. The Crypto Fear & Greed Index, a measure of market sentiment, has declined from 72 on April 23rd to 60 on April 25th, despite Bitcoin trading near $95,000. This suggests a degree of hesitancy among investors. Some analysts anticipate a potential Bitcoin pullback towards the $87,000 level.
The critical question is: Can Bitcoin sustain its momentum above $95,000 and ignite a broader rally in altcoins? The following analysis examines the charts of the top 10 cryptocurrencies to identify potential trading opportunities.
Bitcoin (BTC) Price Prediction
Bitcoin is consolidating around $95,000, indicating that bulls are holding their positions, anticipating further upside.
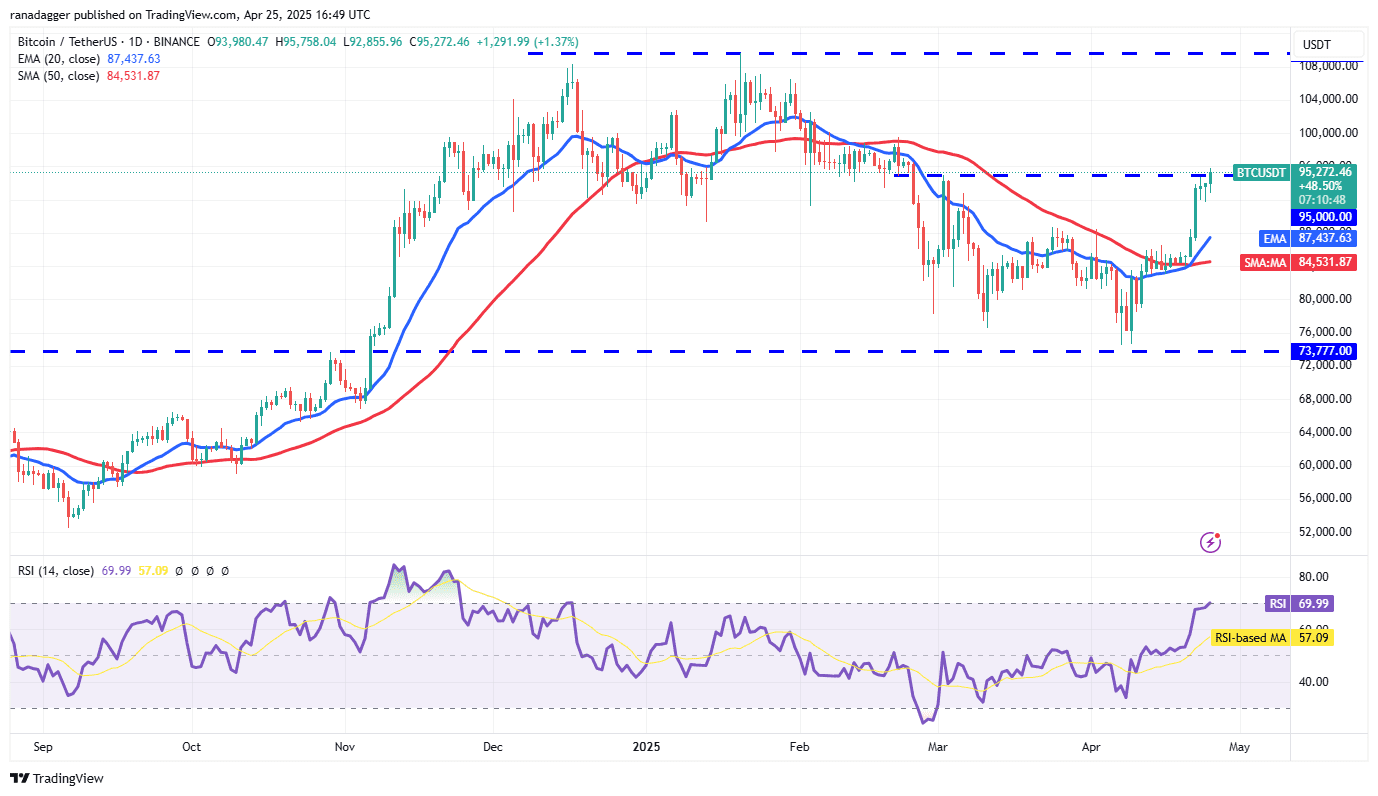
The 20-day exponential moving average (EMA) at $87,437 is trending upwards, and the relative strength index (RSI) is nearing overbought territory, signaling bullish momentum. A decisive close above $95,000 could propel BTC/USDT towards $100,000. Sellers are likely to present resistance at $100,000; however, if bulls maintain the price above $95,000, the likelihood of a breakout increases, potentially leading to a rally towards $107,000. Conversely, a break below the moving averages would give bears control.
Ether (ETH) Price Prediction
Ether’s (ETH) recovery is facing resistance at the 50-day simple moving average (SMA) at $1,812. However, the price has not dipped below the 20-day EMA ($1,696), which is a positive sign.
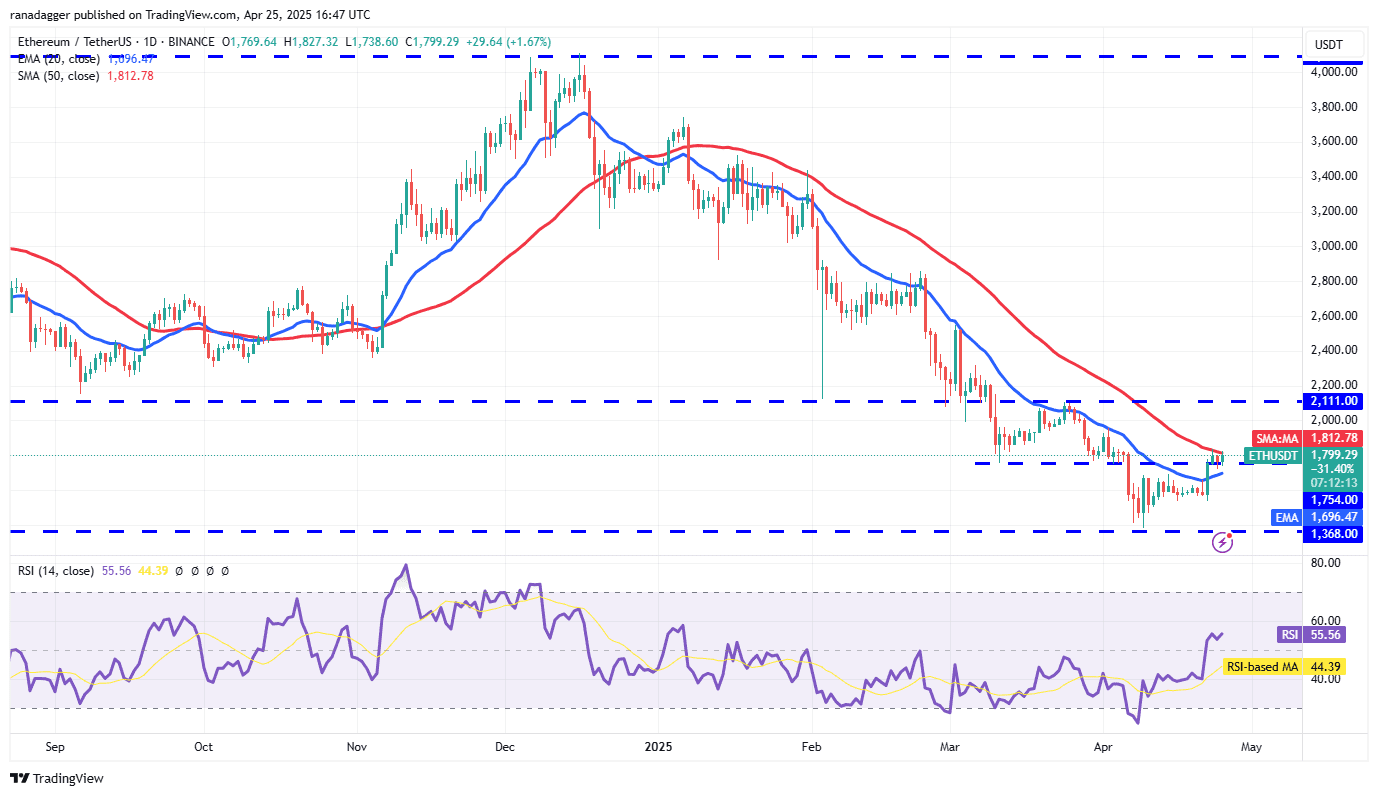
The 20-day EMA is relatively flat, but the RSI has moved into positive territory, giving bulls a slight advantage. If the price manages to break above the 50-day SMA, the ETH/USDT pair could rally to the $2,111 level. Strong resistance is expected at $2,111; however, a successful break above this level could trigger a surge to $2,550. Alternatively, a drop below the 20-day EMA could lead to a decline towards $1,537.
XRP Price Prediction
XRP is trading near the 50-day SMA ($2.18), indicating strong resistance at this level.
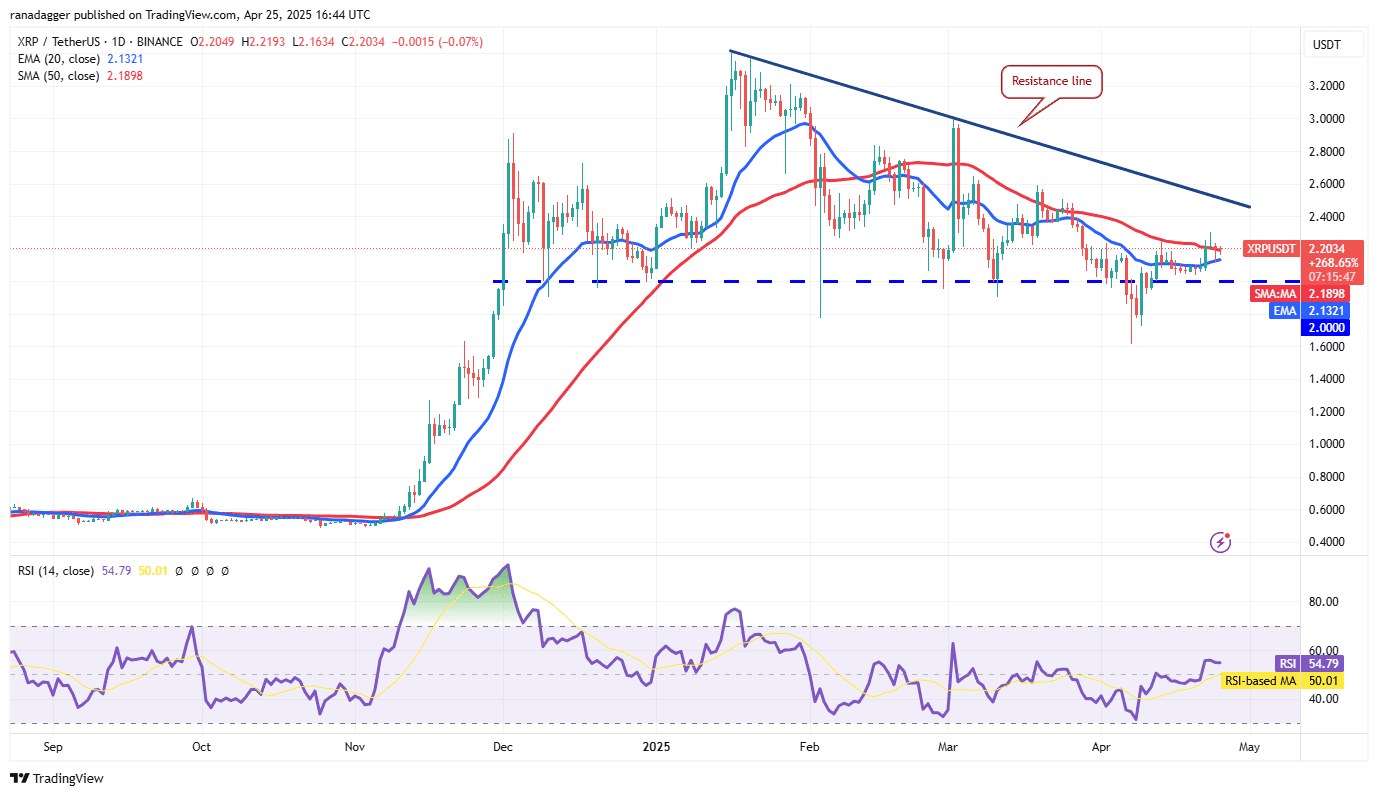
Bulls have prevented a decline below the 20-day EMA ($2.13), which is a minor positive development. Another attempt to push XRP/USDT towards the resistance line is likely. A successful break above the resistance line could lead to a rally towards $3. A break and close below the 20-day EMA would suggest bearish control, potentially leading to a decline towards $1.60.
BNB Price Prediction
BNB experienced a rejection at $620 but is finding support at the moving averages, suggesting a shift from selling on rallies to buying on dips.
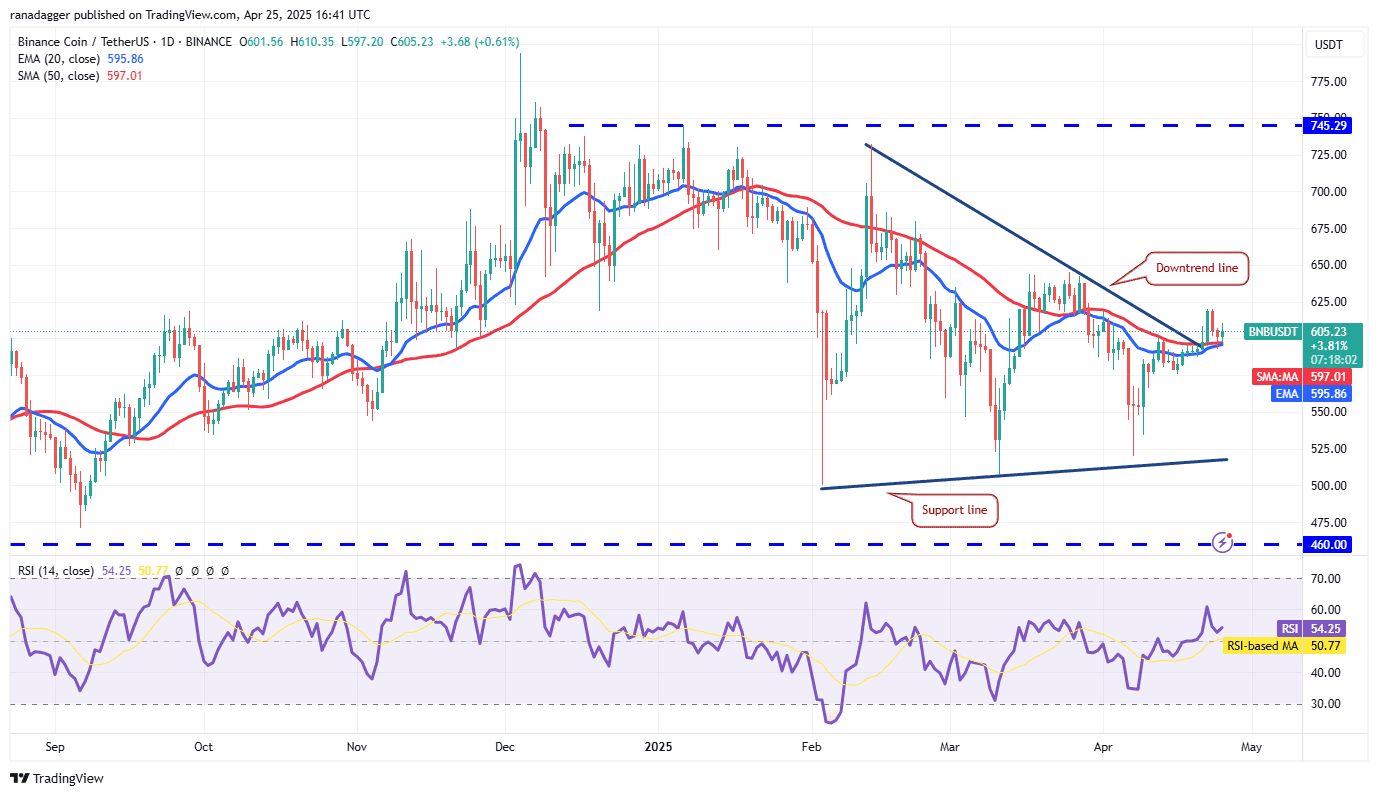
Buyers will attempt to push the price above $620. A successful break above this level could lead to a rally towards $644. Sellers are expected to defend the $644 level, but a breakout could trigger a surge to $680. However, a break below the moving averages would invalidate this bullish outlook, potentially leading to a decline towards $566.
Solana (SOL) Price Prediction
Solana (SOL) is struggling to stay above the $153 level, indicating that the bears are active at higher levels.
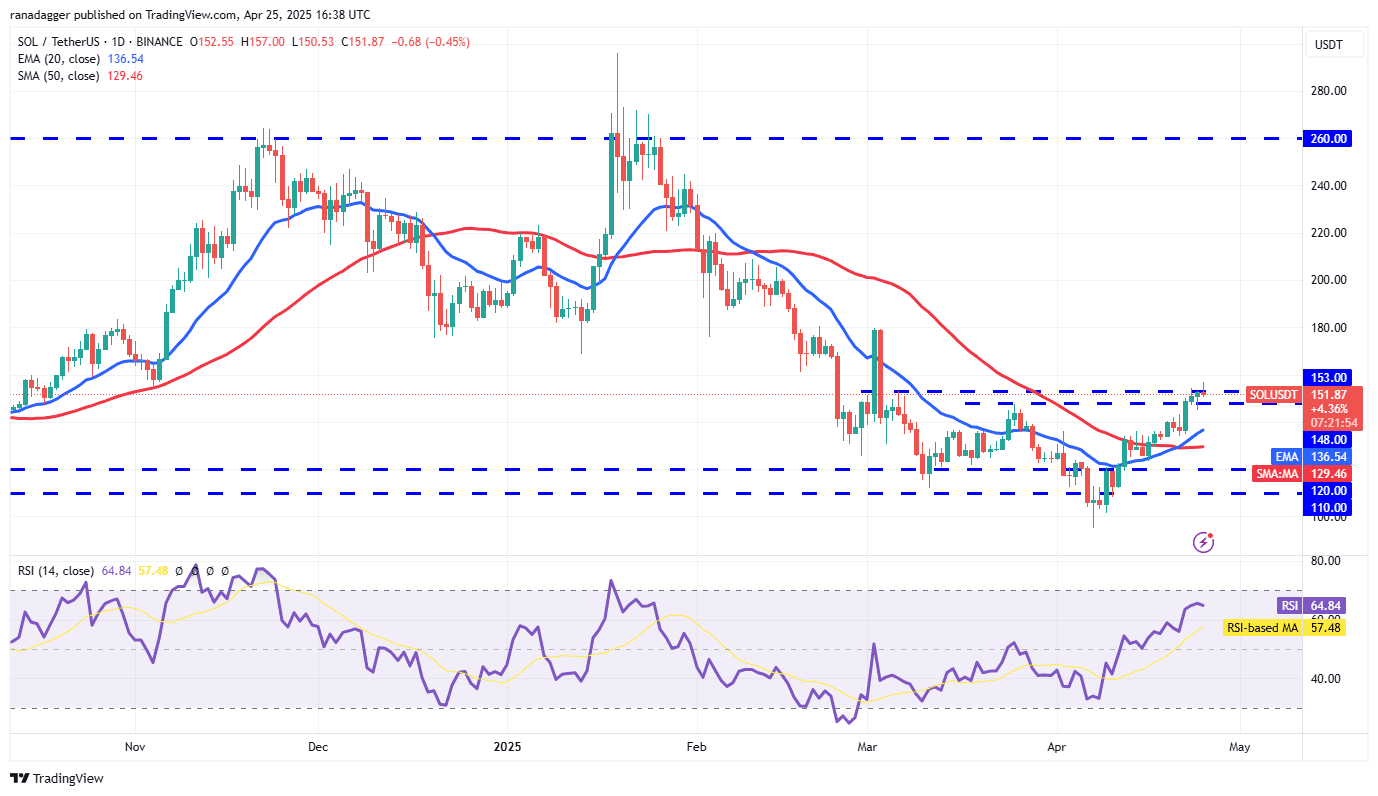
The upsloping 20-day EMA ($136) and the RSI in the positive zone indicate that the bulls are in control. If buyers push and maintain the price above $153, the SOL/USDT pair could jump to $180.
The moving averages are the crucial support on the downside. A break and close below the 50-day SMA ($129) suggests that the pair could consolidate between $153 and $110 for a few days.
Dogecoin (DOGE) Price Prediction
Dogecoin (DOGE) bounced off the 20-day EMA ($0.16) on April 24, indicating that the bulls are buying on dips.
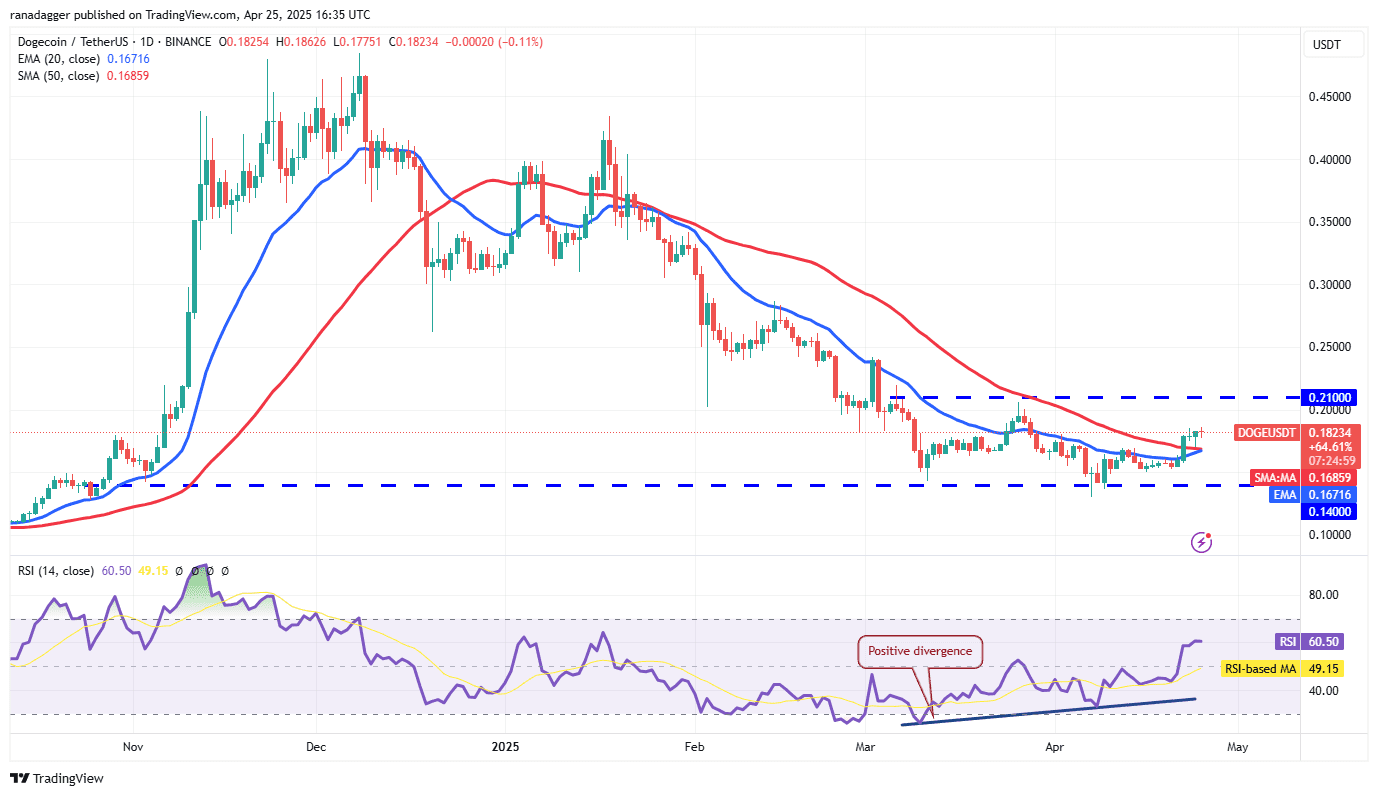
The DOGE/USDT pair could reach $0.21, which is a crucial resistance to watch out for. If buyers pierce the $0.21 level, the pair will complete a double-bottom pattern. This bullish setup has a target objective of $0.28.
Contrarily, if the price turns down and breaks below the moving averages, the pair may remain range-bound between $0.21 and $0.14 for a while. The advantage will tilt in favor of the bears on a break below the $0.14 support.
Cardano (ADA) Price Prediction
Cardano (ADA) closed above the 50-day SMA ($0.68) on April 23, signaling that the bears are losing their grip.
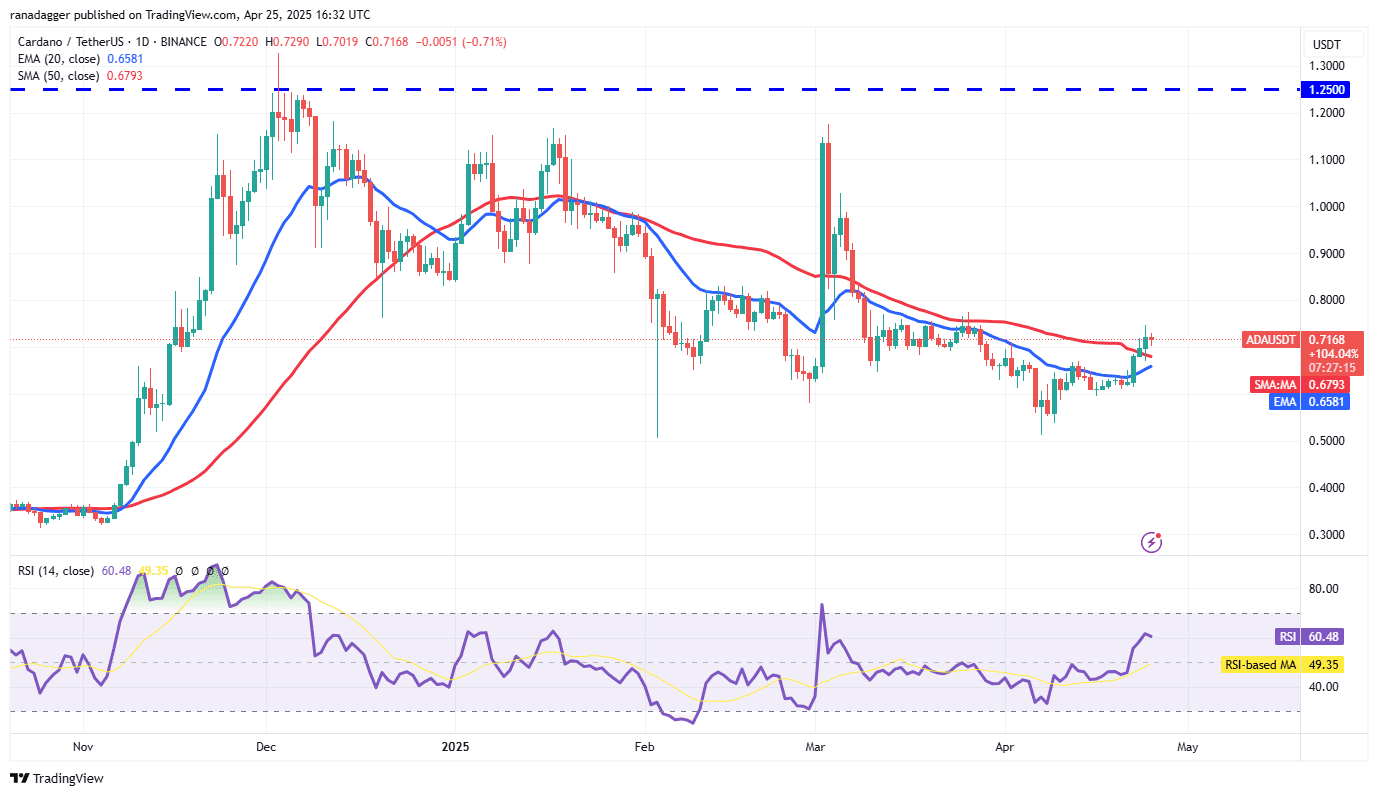
The 20-day EMA ($0.65) has started to turn up, and the RSI is in the positive zone, suggesting that the path of least resistance is to the upside. The ADA/USDT pair could rally to $0.83, where the bears may step in.
Any pullback is expected to find support at the 20-day EMA. If the price rebounds off the 20-day EMA, it signals a bullish sentiment. Sellers will have to drag the price below the 20-day EMA to sink the pair to $0.58.
Sui (SUI) Price Prediction
Sui (SUI) picked up momentum after buyers pushed the price above the moving averages on April 22.
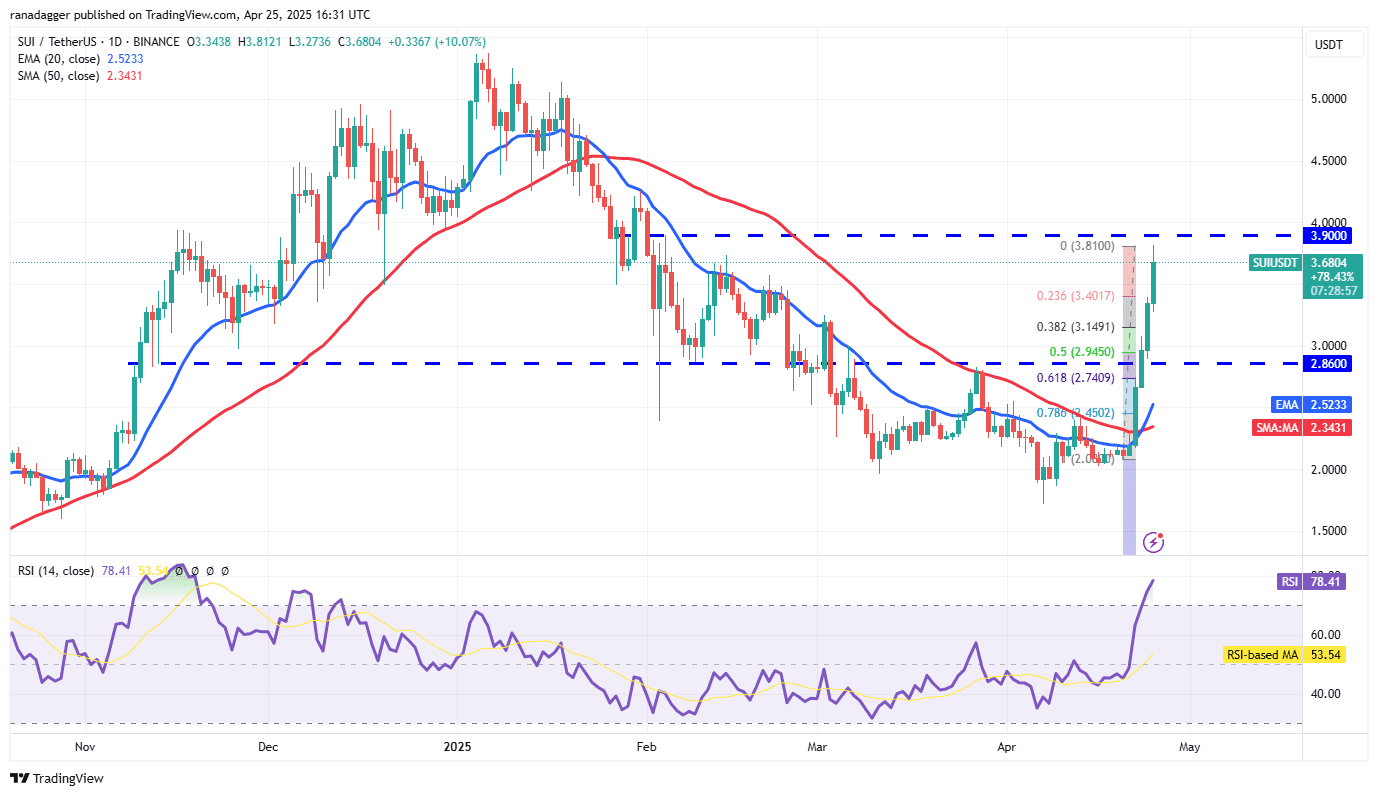
The rally of the past few days has pushed the RSI into the overbought territory, suggesting a minor consolidation or correction in the next few days. Any pullback is expected to find support in the zone between the 38.2% Fibonacci retracement level of $3.14 and the 50% retracement of $2.94.
A shallow pullback increases the possibility of a rally to $4.25 and then to $5. Sellers will be back in the driver’s seat if they pull the SUI/USDT pair below $2.86.
Chainlink (LINK) Price Prediction
Chainlink (LINK) has started a recovery, which is expected to face strong selling at the overhead resistance of $16.
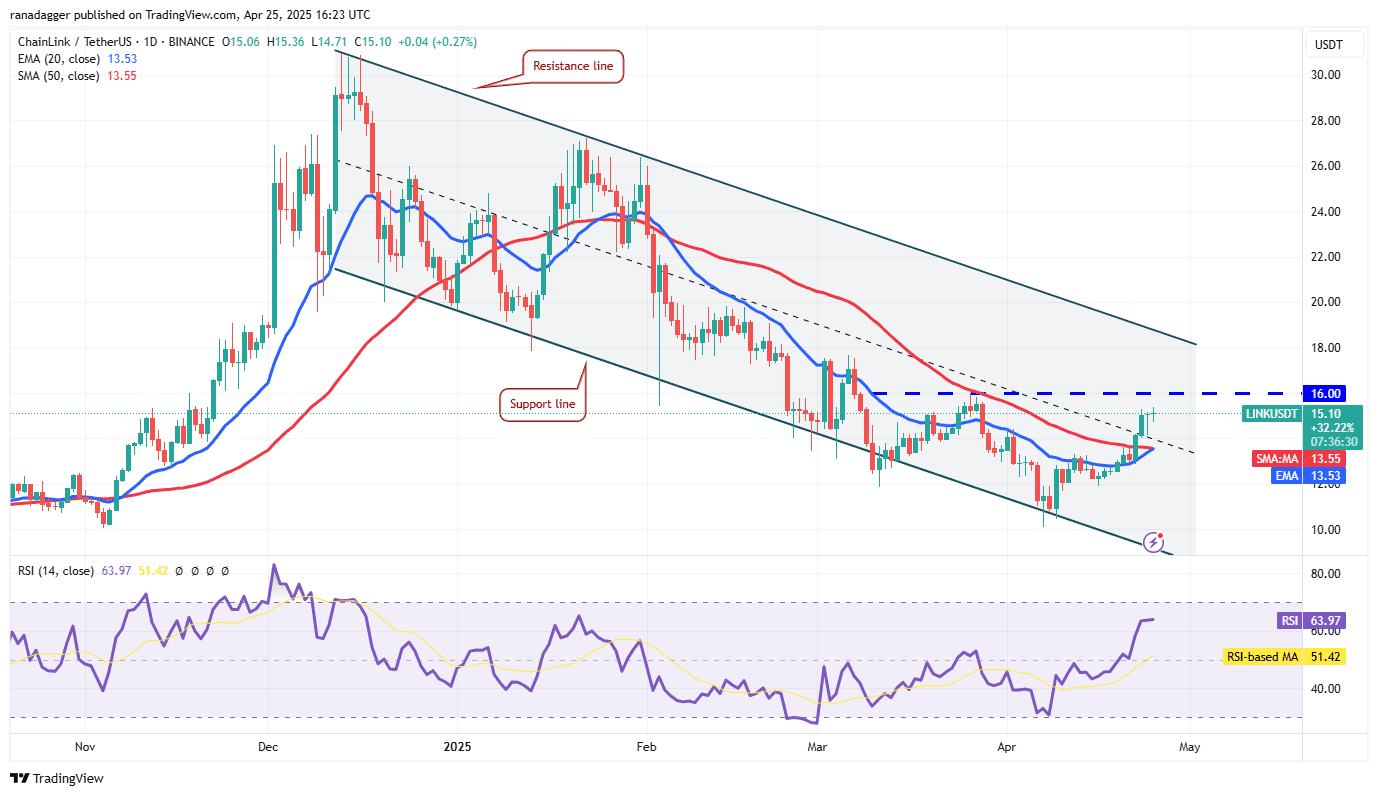
If the price turns down from $16, it is expected to find support at the 20-day EMA ($13.53). A solid bounce off the 20-day EMA increases the likelihood of a break above $16. The LINK/USDT pair may then climb to the resistance line of the descending channel pattern. A break above the channel signals a potential trend change.
Sellers will have to tug the price below the moving averages to regain control. The pair may then drop to $11.89 and eventually to the support line.
Avalanche (AVAX) Price Prediction
Avalanche (AVAX) is facing resistance at the overhead resistance of $23.50, but a positive sign is that the bulls have not ceded much ground to the bears.
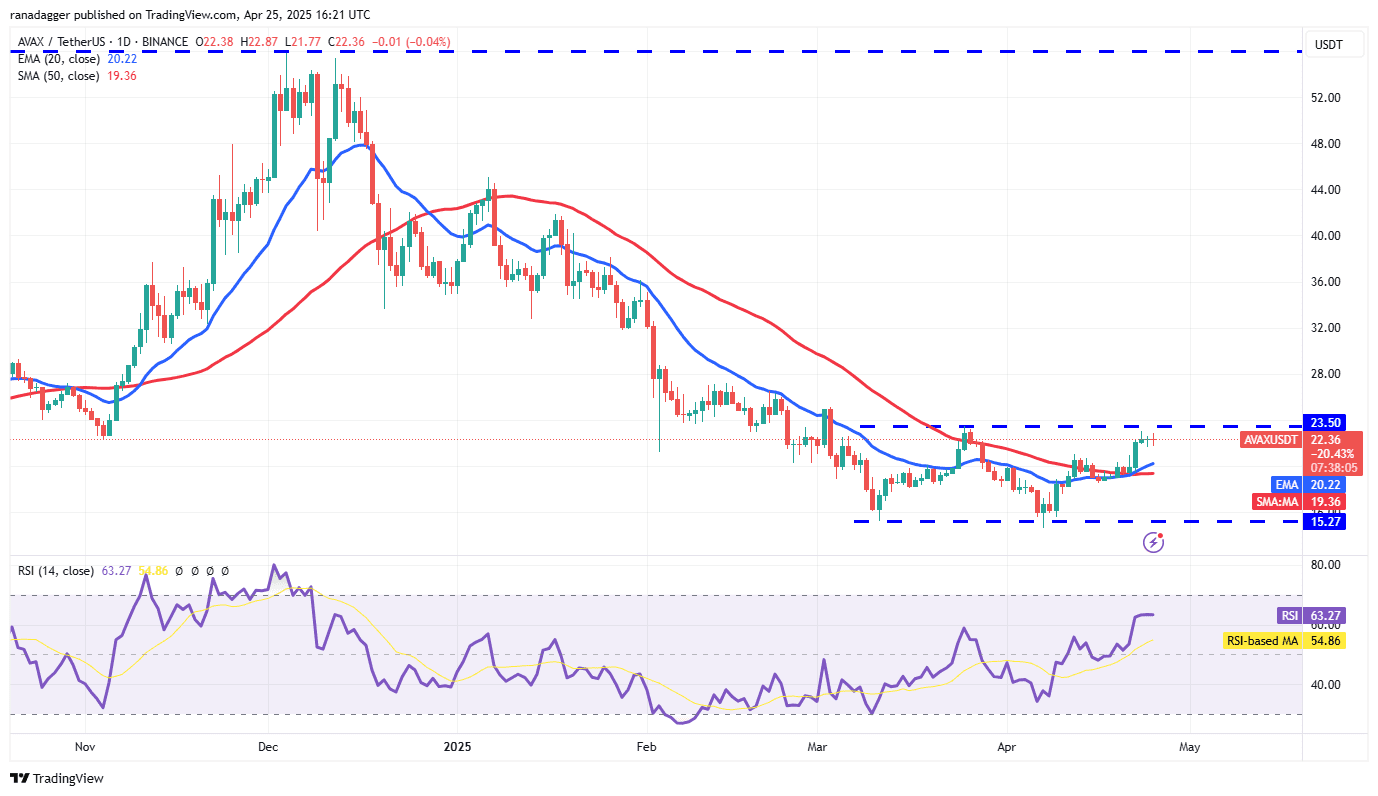
The 20-day EMA ($20.22) has started to turn up, and the RSI is in the positive territory, indicating that buyers have the edge. If the price breaks and closes above $23.50, the AVAX/USDT pair will complete a double-bottom pattern. That could open the doors for a rally to the pattern target of $31.73.
Alternatively, if the price turns down and breaks below the moving averages, the pair could remain stuck inside the $23.50 to $15.27 range for a few days.
Disclaimer: This analysis is for informational purposes only and should not be considered financial advice. Trading cryptocurrencies involves significant risk. Conduct thorough research and consult a financial advisor before making any investment decisions.