Cryptocurrency Price Predictions for May 16th: A Detailed Analysis
This report provides an in-depth technical analysis of Bitcoin (BTC) and nine prominent altcoins: Ethereum (ETH), XRP, Binance Coin (BNB), Solana (SOL), Dogecoin (DOGE), Cardano (ADA), Sui (SUI), Chainlink (LINK), and Avalanche (AVAX). Our analysis focuses on key support and resistance levels, potential breakout points, and overall market trends to provide informed price predictions.
Key Takeaways:
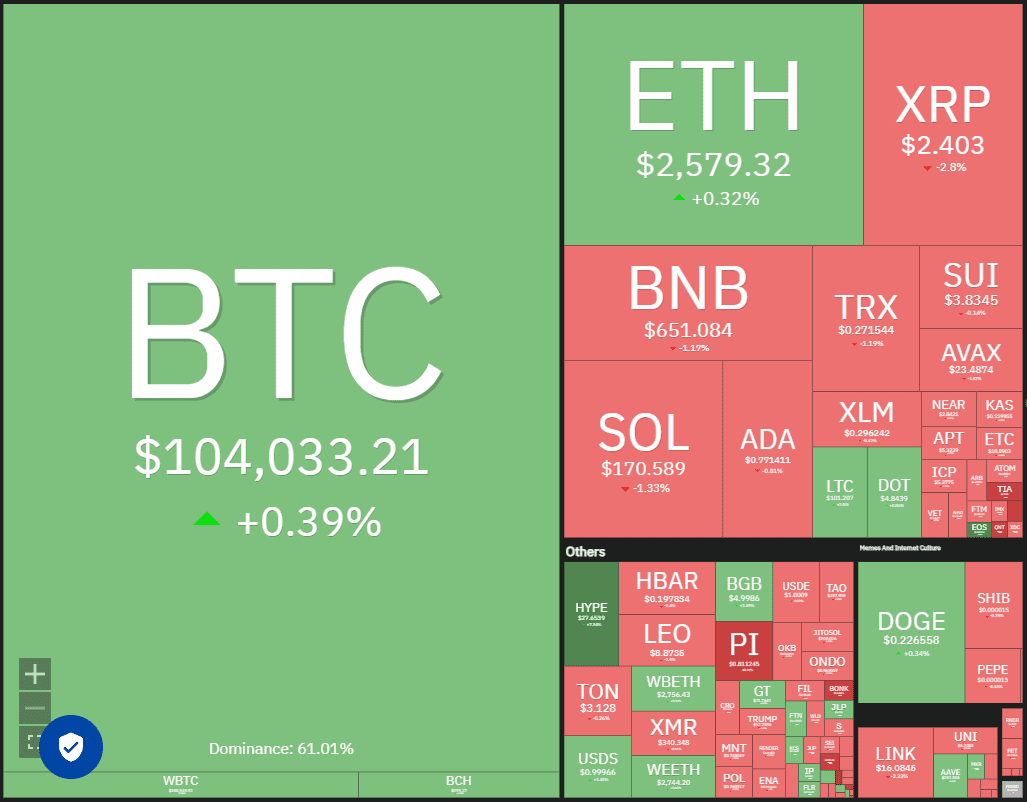
- Bitcoin (BTC): Consolidation continues between $100,718 and $105,819. A decisive break above $105,000 could trigger a rally towards $130,000. Failure to hold $100,000 could lead to a deeper pullback.
- Ethereum (ETH): Showing strength, mirroring altcoin gains. A break above $2,750 could propel it to $3,000. Crucial support lies at $2,400.
Bitcoin (BTC) Price Analysis
Bitcoin has been consolidating between $100,718 and $105,819, reflecting a balance between buyers and sellers. The critical $100,000 support level has held, indicating bullish sentiment. However, repeated failures to surpass the all-time high of $109,588 may trigger profit-taking, potentially testing the $100,000 support.
Bullish Scenario: A close above $105,000 could ignite significant momentum, pushing BTC towards $130,000.
Bearish Scenario: A break below $100,000 could initiate a more substantial pullback.
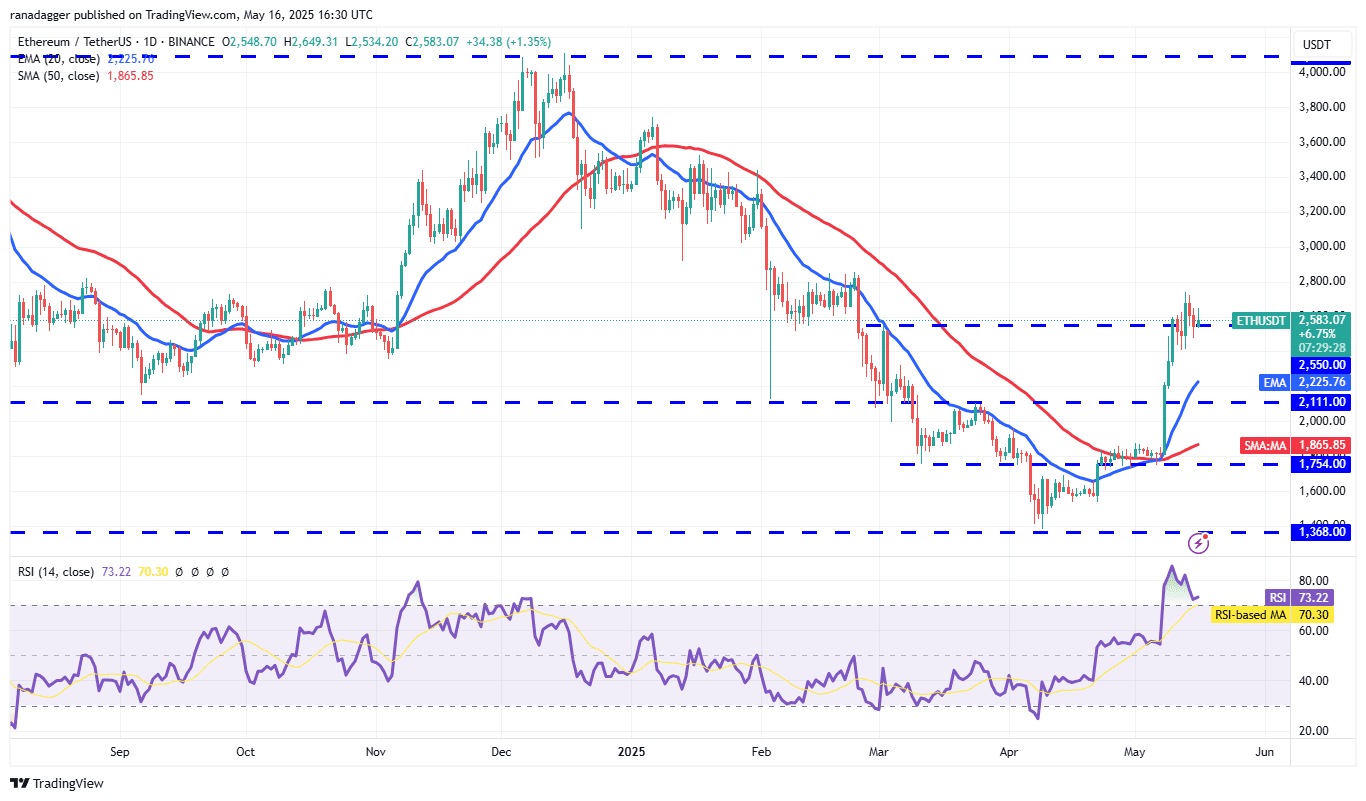
Ethereum (ETH) Price Analysis
Ethereum’s pullback has found support at the $2,550 breakout level, suggesting strong buying interest.
Bullish Scenario: A break above $2,750 could resume the upward trend, targeting $3,000. Resistance is expected at $2,860.
Bearish Scenario: A break below $2,400 could lead to a decline towards the 20-day EMA ($2,225).
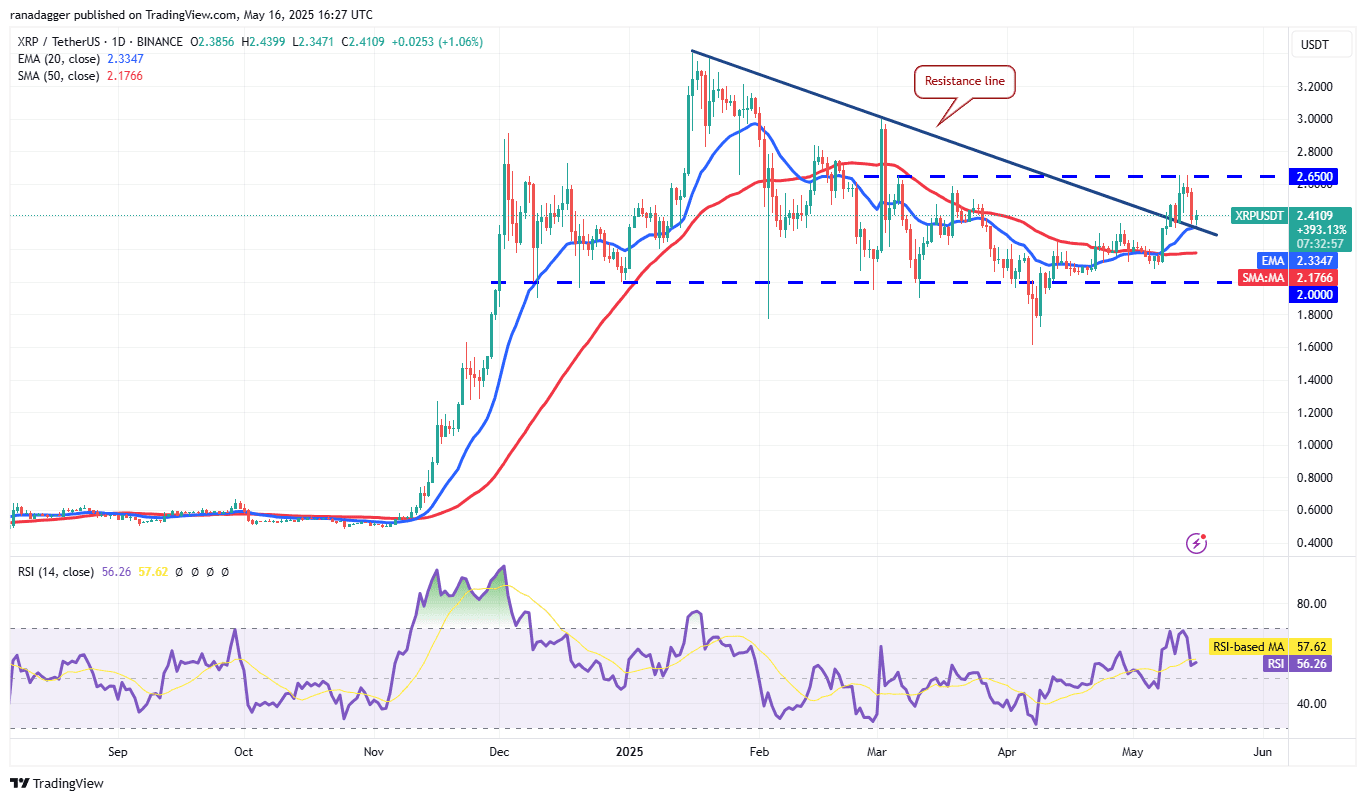
XRP Price Analysis
XRP has encountered resistance at $2.65 after a downturn on May 14.
Bullish Scenario: A strong rebound off the resistance line could flip it into support, potentially leading to a move towards $3.
Bearish Scenario: A dip below the resistance line suggests weakening bullish momentum, potentially leading to range-bound trading between $2.65 and $2.
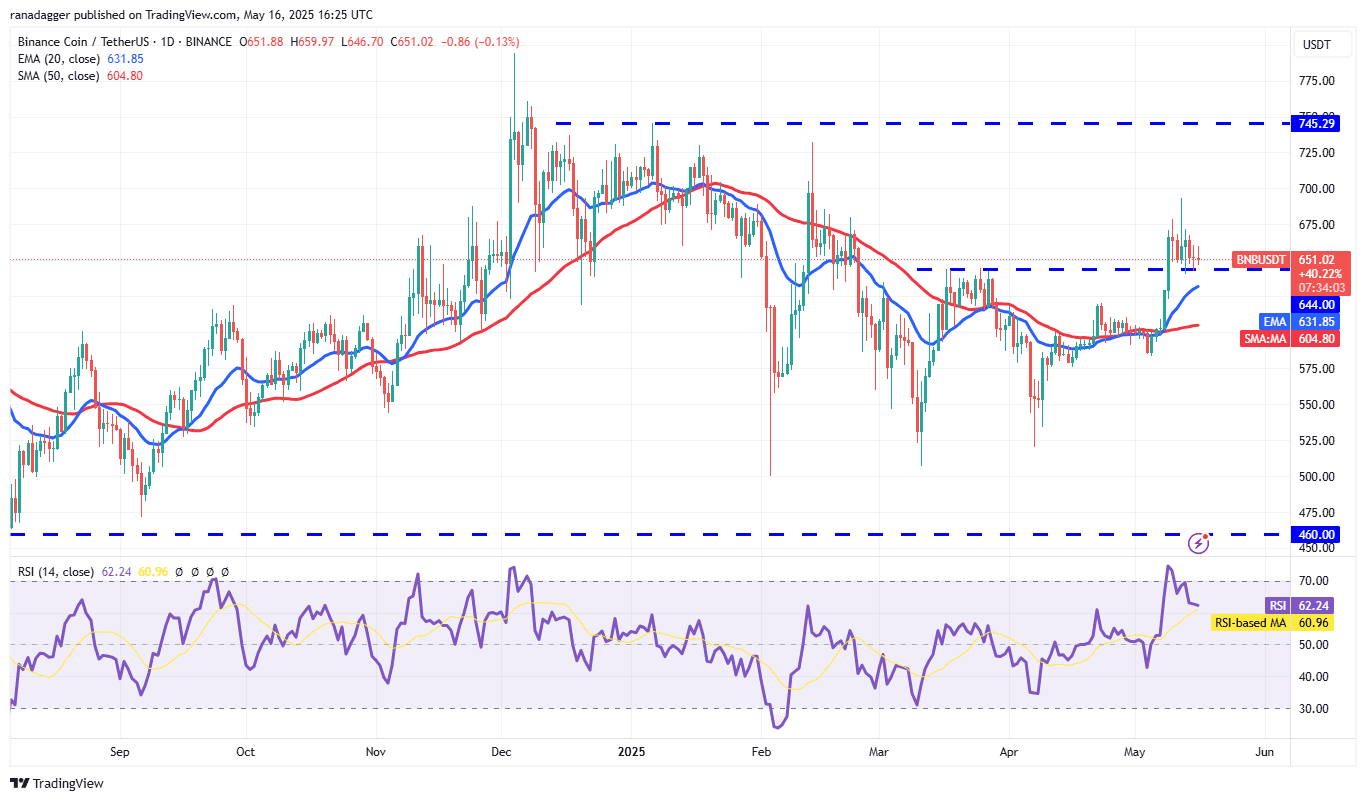
Binance Coin (BNB) Price Analysis
BNB has successfully defended the $644 level, but a strong rebound is lacking.
Bullish Scenario: A turn-up from the $644-$631 support zone could push the price towards the $693 resistance.
Bearish Scenario: A break and close below the 20-day EMA ($631) could trigger a decline to the 50-day SMA ($604).
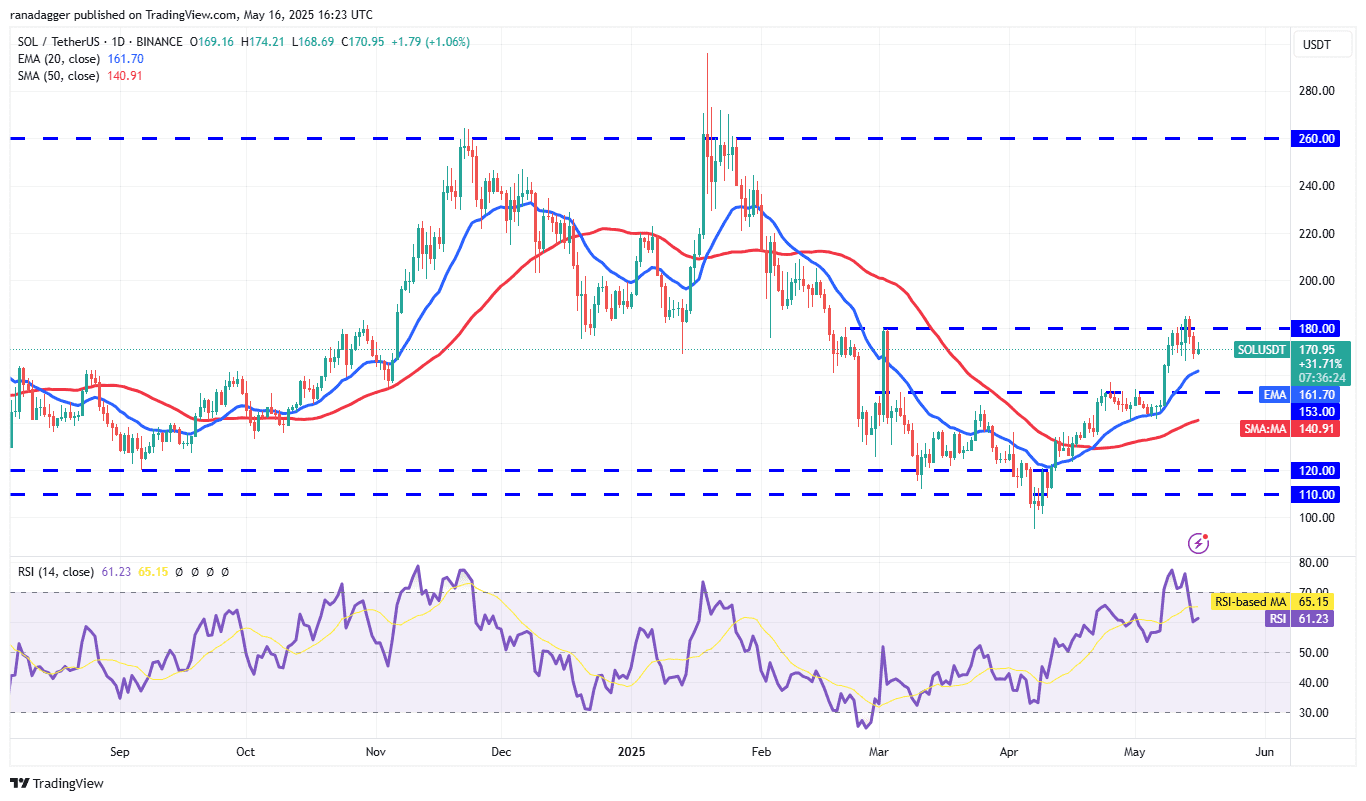
Solana (SOL) Price Analysis
Solana faces resistance at $180, but bulls haven’t ceded much ground.
Bullish Scenario: A break above $185 could resume the uptrend, targeting $210.
Bearish Scenario: A break and close below the 20-day EMA ($161) could lead to a decline to the 50-day SMA ($140).
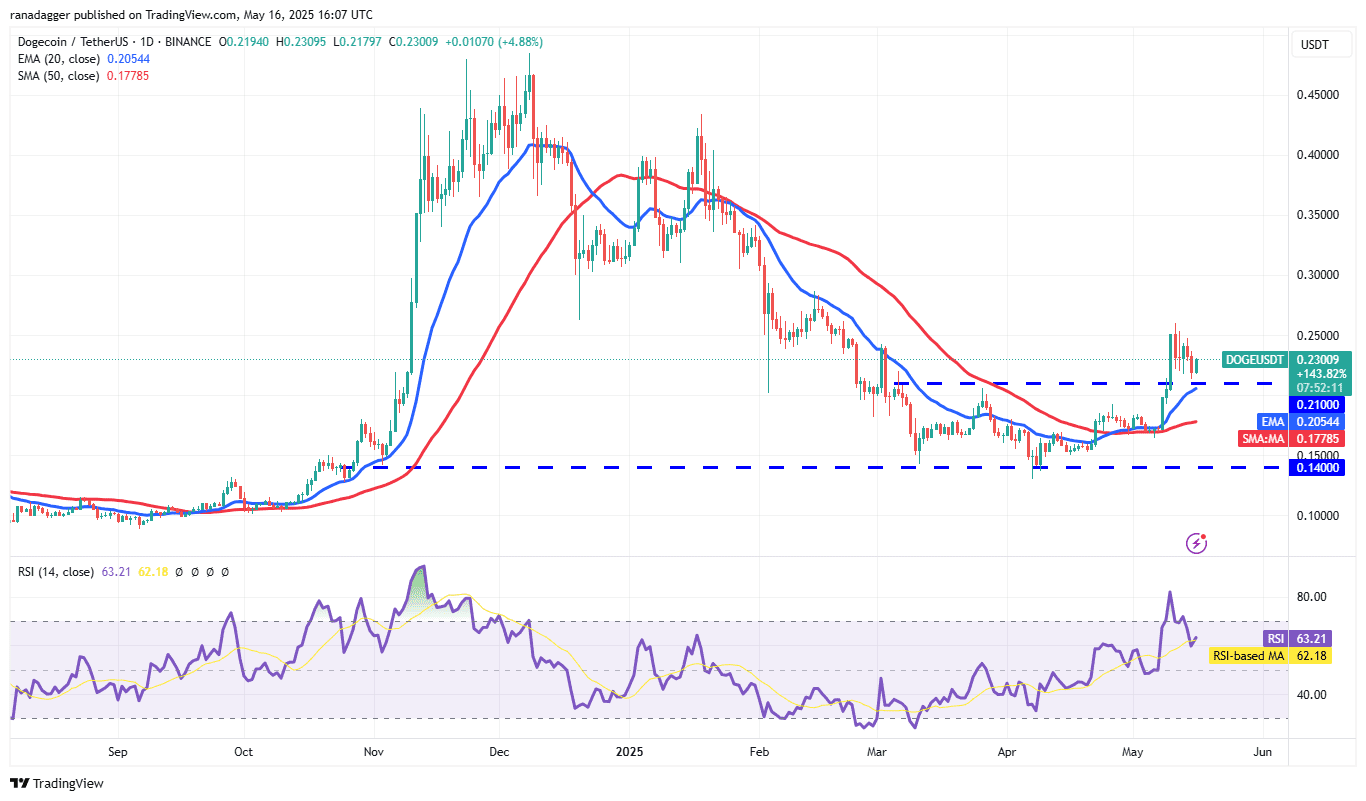
Dogecoin (DOGE) Price Analysis
Dogecoin is attempting to bounce off the $0.21 breakout level.
Bullish Scenario: A break and close above $0.26 could signal the resumption of the uptrend, potentially reaching $0.31.
Bearish Scenario: Sellers need to pull the price below the 20-day EMA ($0.20) to invalidate the bullish view. This could lead to a tumble to the 50-day SMA ($0.17).
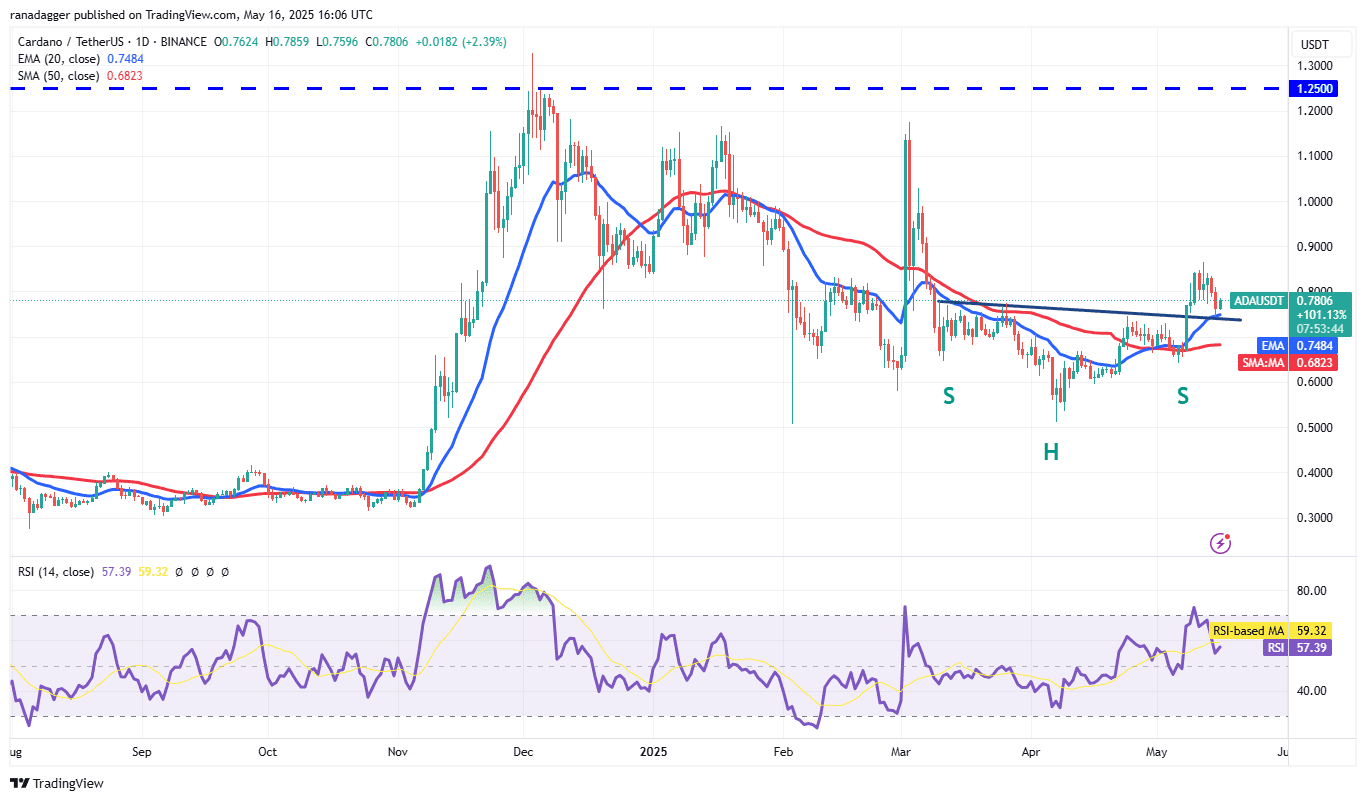
Cardano (ADA) Price Analysis
Cardano turned down from $0.86 on May 12 and dropped to the neckline of an inverted head-and-shoulders pattern.
Bullish Scenario: A strong rebound off the neckline suggests positive sentiment. A shove above $0.86 could surge the price to $1.01.
Bearish Scenario: A break and close below the neckline suggests a bearish takeover, potentially descending to the 50-day SMA ($0.68) and $0.60 support.
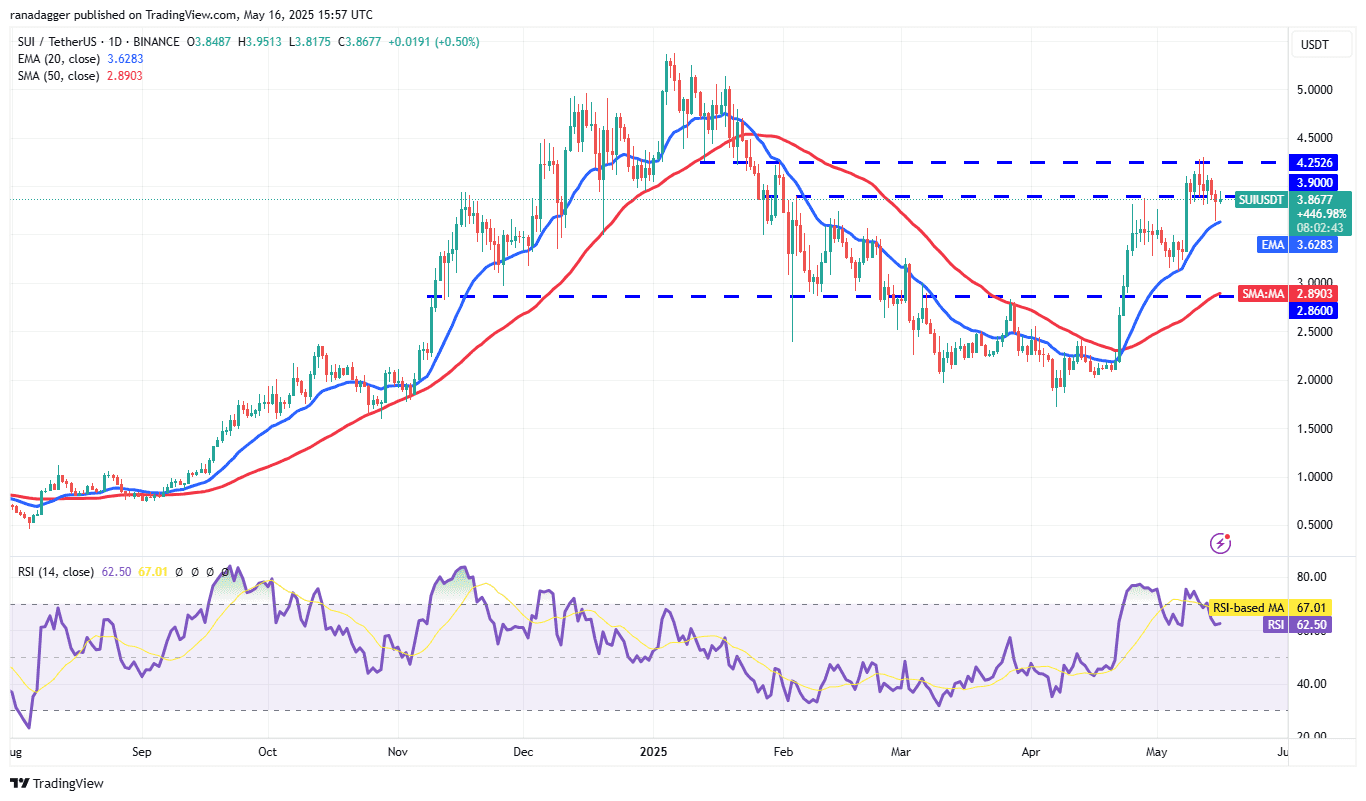
Sui (SUI) Price Analysis
Sui pulled back to the 20-day EMA ($3.62) on May 15, showing buying at lower levels.
Bullish Scenario: A push above the $4.25 resistance could soar the price to $5, with potential challenges in the $5-$5.37 zone.
Bearish Scenario: A turn down and break below the 20-day EMA suggests profit-booking, potentially pulling the price down to $3.12.
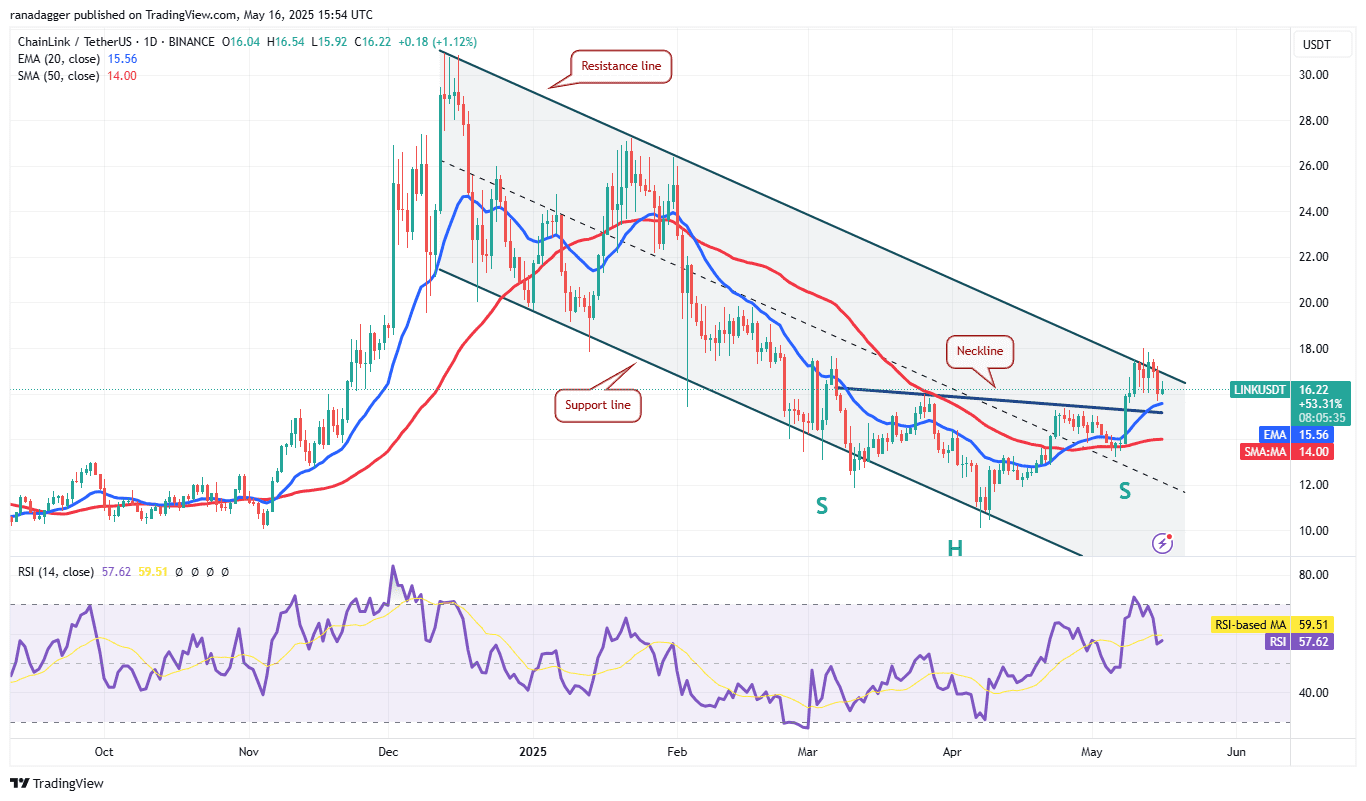
Chainlink (LINK) Price Analysis
Chainlink turned down from the resistance line of a descending channel pattern.
Bullish Scenario: A push above the resistance line could rally the price to $19.80 and then $21.30.
Bearish Scenario: A drop below the neckline could lead to a decline to the 50-day SMA ($14), with potential for remaining within the channel.
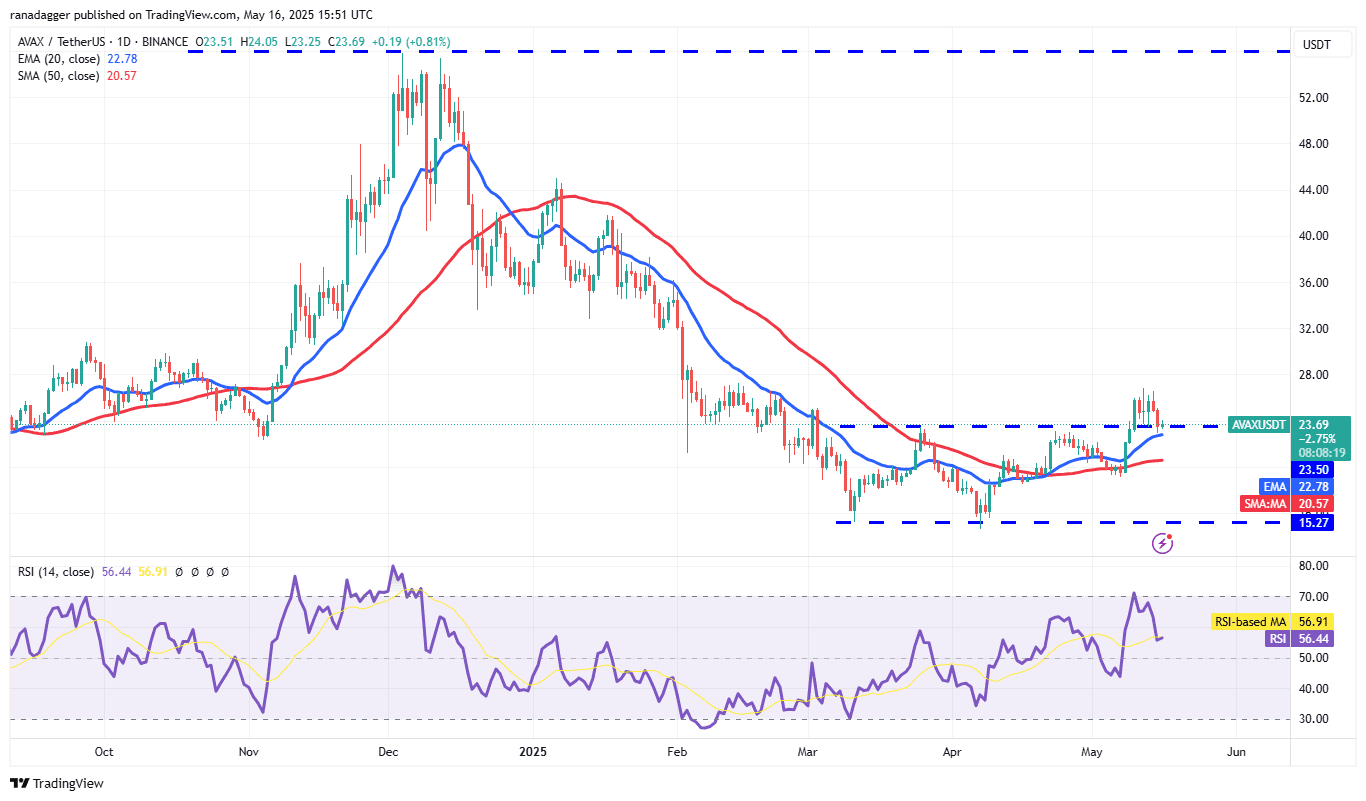
Avalanche (AVAX) Price Analysis
Avalanche found support at the 20-day EMA ($22.78) on May 15.
Bullish Scenario: A drive above $26.84 could open the doors for a rally to $31.73 and then $36.
Bearish Scenario: A pull below the 20-day EMA could indicate rejection of the breakout, potentially slumping to the 50-day SMA ($20.57).
Disclaimer: This analysis is for informational purposes only and does not constitute financial advice. Trading cryptocurrencies involves significant risk. Conduct your own research before making any investment decisions.