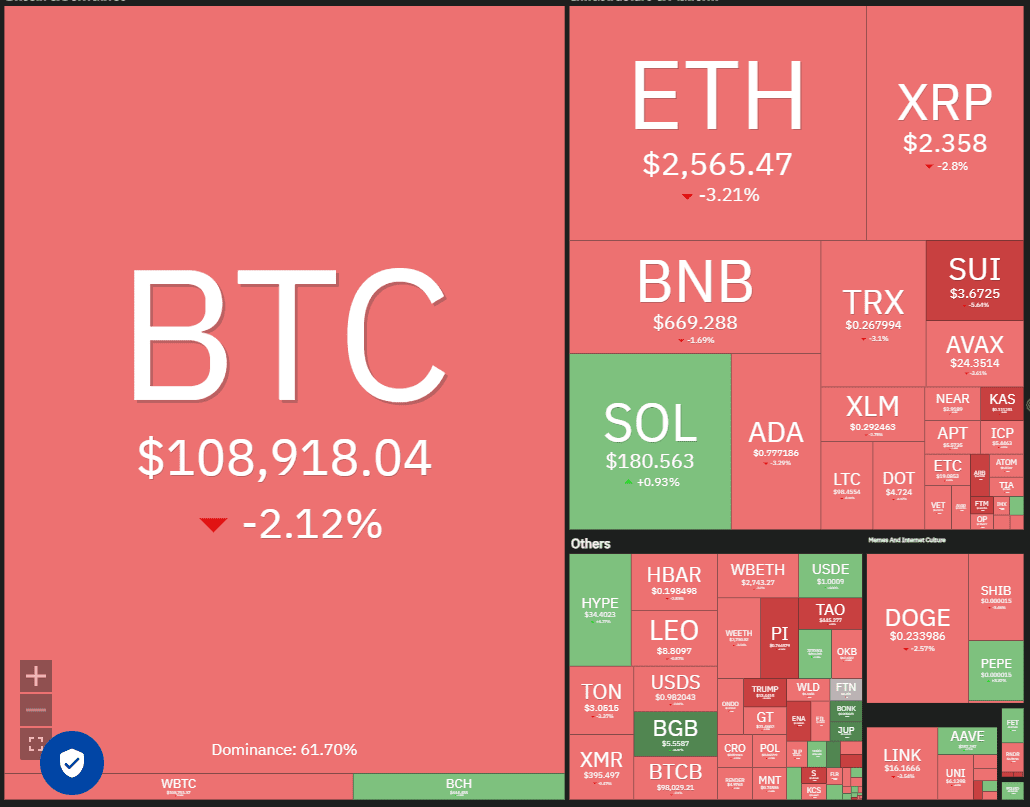
Cryptocurrency markets are known for their volatility, and understanding potential price movements is crucial for investors. This analysis provides insights into the current trends and potential future trajectories of several leading cryptocurrencies, including Bitcoin, Ethereum, and a selection of altcoins. As of May 23rd, the market presents a mixed bag of opportunities and risks. This comprehensive guide breaks down each cryptocurrency, offering key support and resistance levels to watch.
Bitcoin (BTC) Price Analysis
Bitcoin experienced a slight pullback, dipping below $109,588. However, technical indicators suggest that traders are actively buying these dips, indicating underlying bullish sentiment. Strong inflows into US spot Bitcoin ETFs further support this view. Veteran trader Peter Brandt forecasts a potential rise to between $125,000 and $150,000 by the end of August.
Key Support Levels:
- 20-day EMA: $103,652
- Psychological Support: $100,000
- 50-day SMA: $94,001
Key Resistance Levels:
- $111,980
- Target Objective: $130,000
A break below the 20-day EMA would signal weakness, potentially leading to a test of the $100,000 support level.
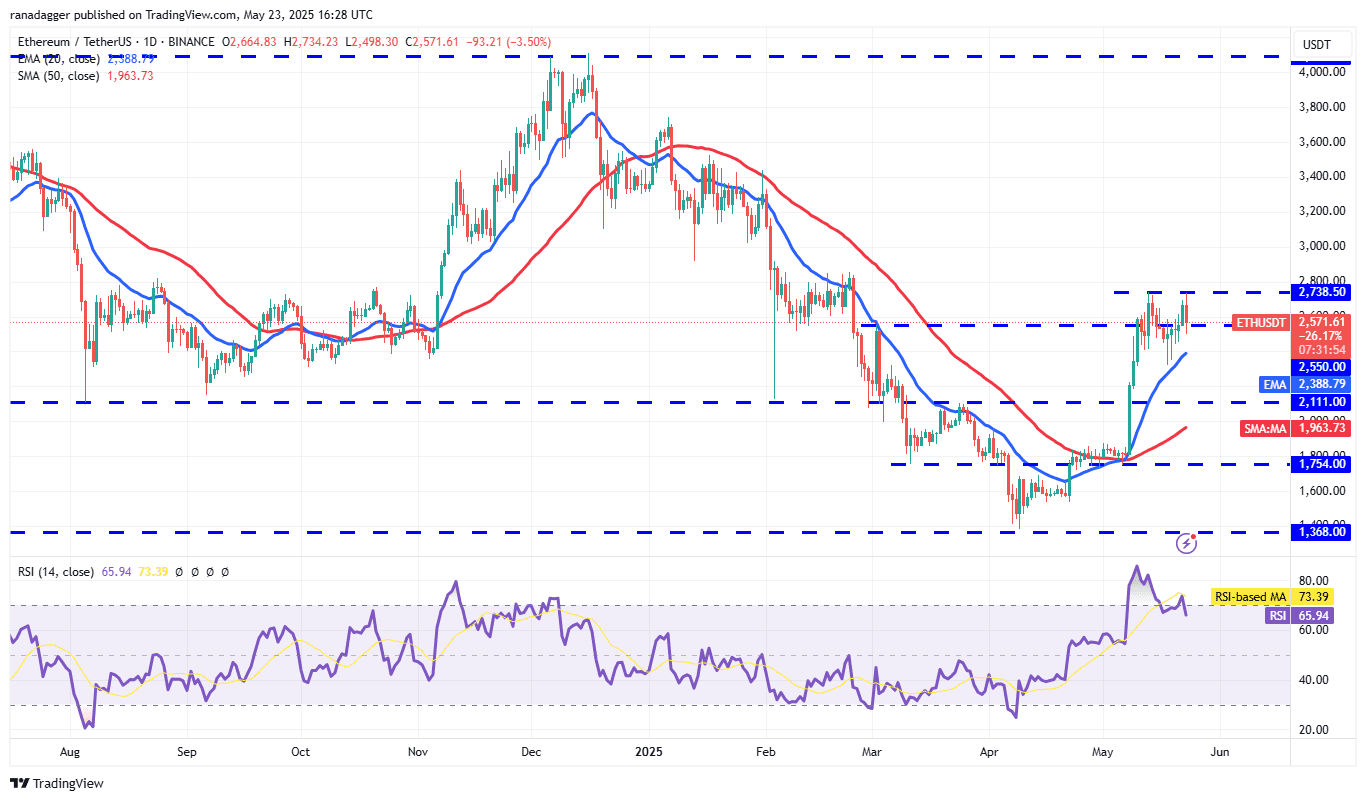
Ethereum (ETH) Price Analysis
Ethereum faced resistance at $2,738, suggesting sellers are defending this level. A drop to the 20-day EMA ($2,388) is possible. A strong rebound from this EMA could signal another attempt to breach the $2,738 resistance.
Key Support Levels:
- 20-day EMA: $2,388
- $2,323
- $2,111
Key Resistance Levels:
- $2,738
- $2,850
- $3,000
A break below the 20-day EMA would invalidate the bullish outlook, potentially leading to a plunge towards $2,323.
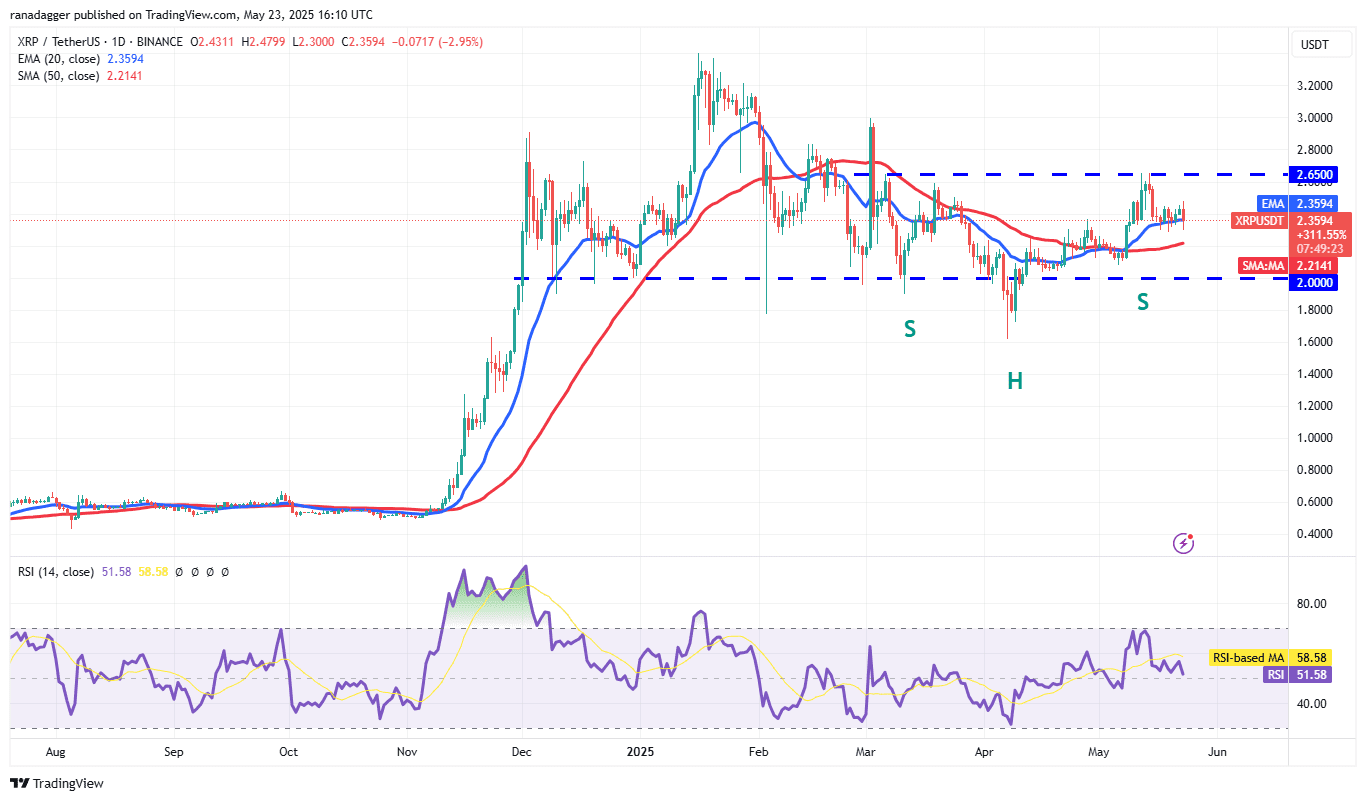
XRP Price Analysis
XRP remains range-bound between $2.00 and $2.65, indicating equilibrium between buyers and sellers. The 20-day EMA is flattening, and the RSI is near the midpoint, suggesting this consolidation phase may continue.
Key Support Levels:
- $2.00
- $1.60
- $1.27
Key Resistance Levels:
- $2.65
- Target Objective (if breakout): $3.70
A break above $2.65 would complete a bullish inverse head-and-shoulders pattern, targeting $3.70. Conversely, a break below $2.00 could lead to a decline towards $1.60.
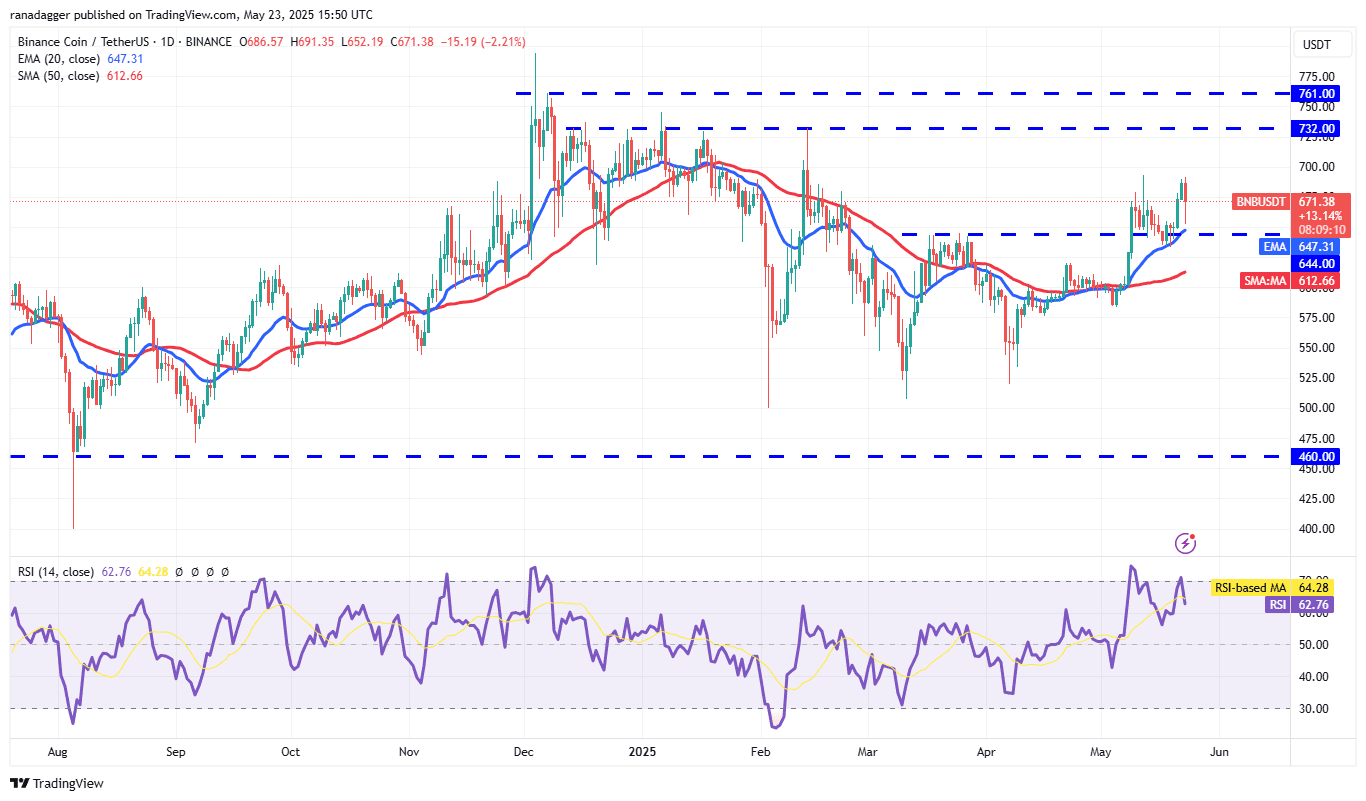
BNB Price Analysis
BNB experienced a sharp rejection at the $693 resistance, signaling strong selling pressure. However, a bounce off the 20-day EMA ($647) indicates buying interest at lower levels. Another attempt to break above $693 is likely.
Key Support Levels:
- 20-day EMA: $647
- 50-day SMA: $612
Key Resistance Levels:
- $693
- $732 – $761 resistance zone
A break below the 20-day EMA could indicate profit-taking, potentially leading to a drop to the 50-day SMA ($612).
Solana (SOL) Price Analysis
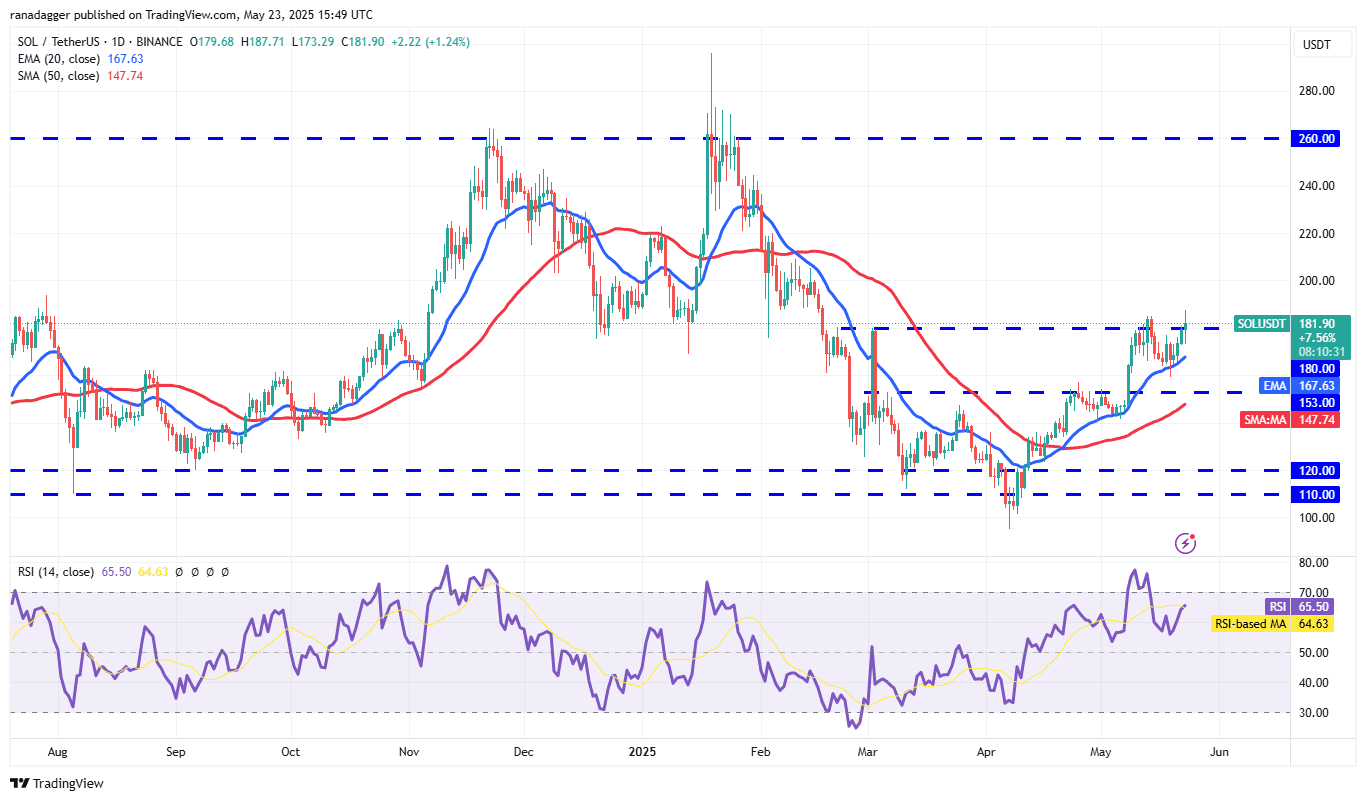
Solana surpassed the $180 resistance, facing a challenge at $185. The upward-sloping 20-day EMA and positive RSI suggest a bullish trend. Sustaining above $185 could propel SOL towards $210 and $220.
Key Support Levels:
- 20-day EMA: $167
- 50-day SMA: $147
Key Resistance Levels:
- $185
- $210
- $220
A break below the 20-day EMA could trigger a sell-off towards the 50-day SMA ($147).
Dogecoin (DOGE) Price Analysis
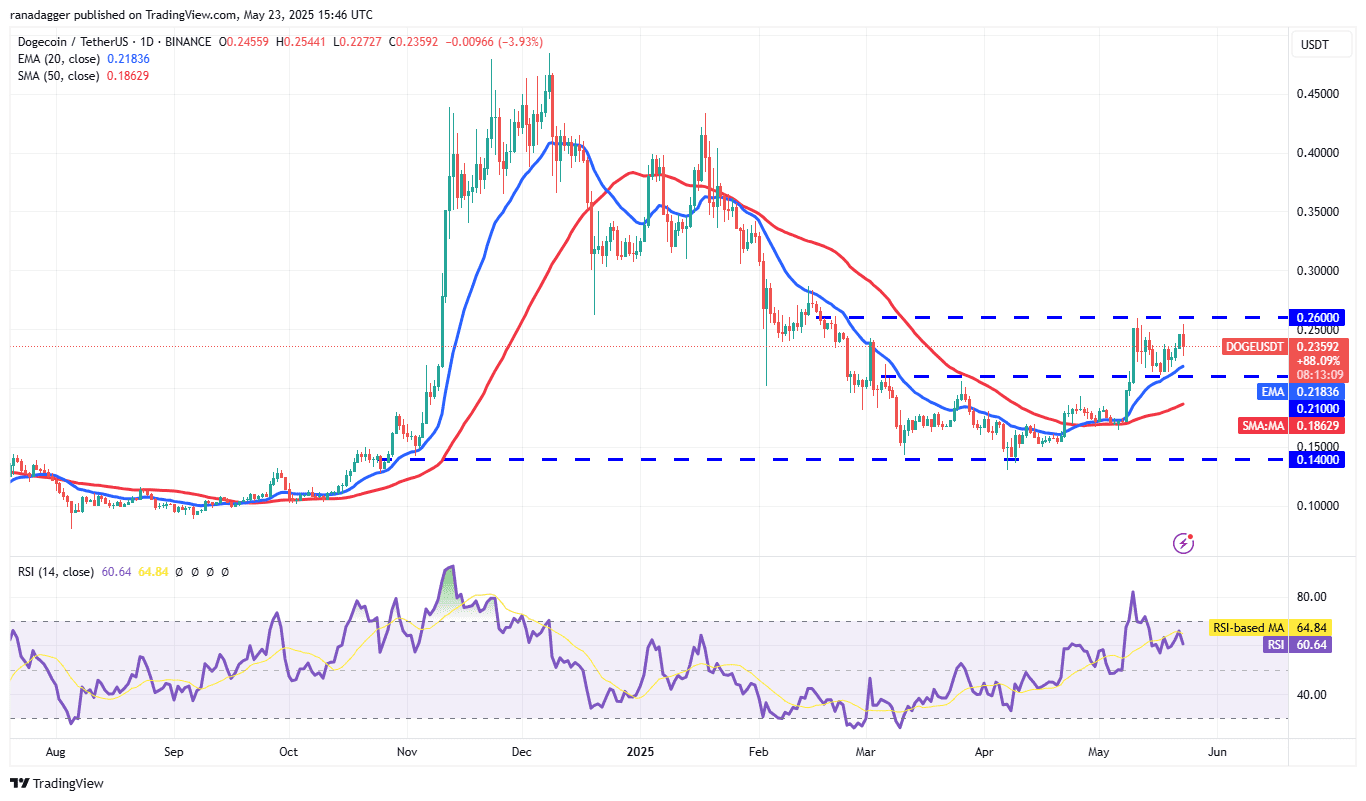
Dogecoin encountered resistance at $0.26, indicating strong selling pressure at that level. A potential drop to the 20-day EMA ($0.21) is possible. A strong bounce from the EMA would support a bullish outlook.
Key Support Levels:
- 20-day EMA: $0.21
- $0.14
Key Resistance Levels:
- $0.26
- $0.29
- $0.35
A break below $0.21 could lead to range-bound trading between $0.14 and $0.26.
Cardano (ADA) Price Analysis
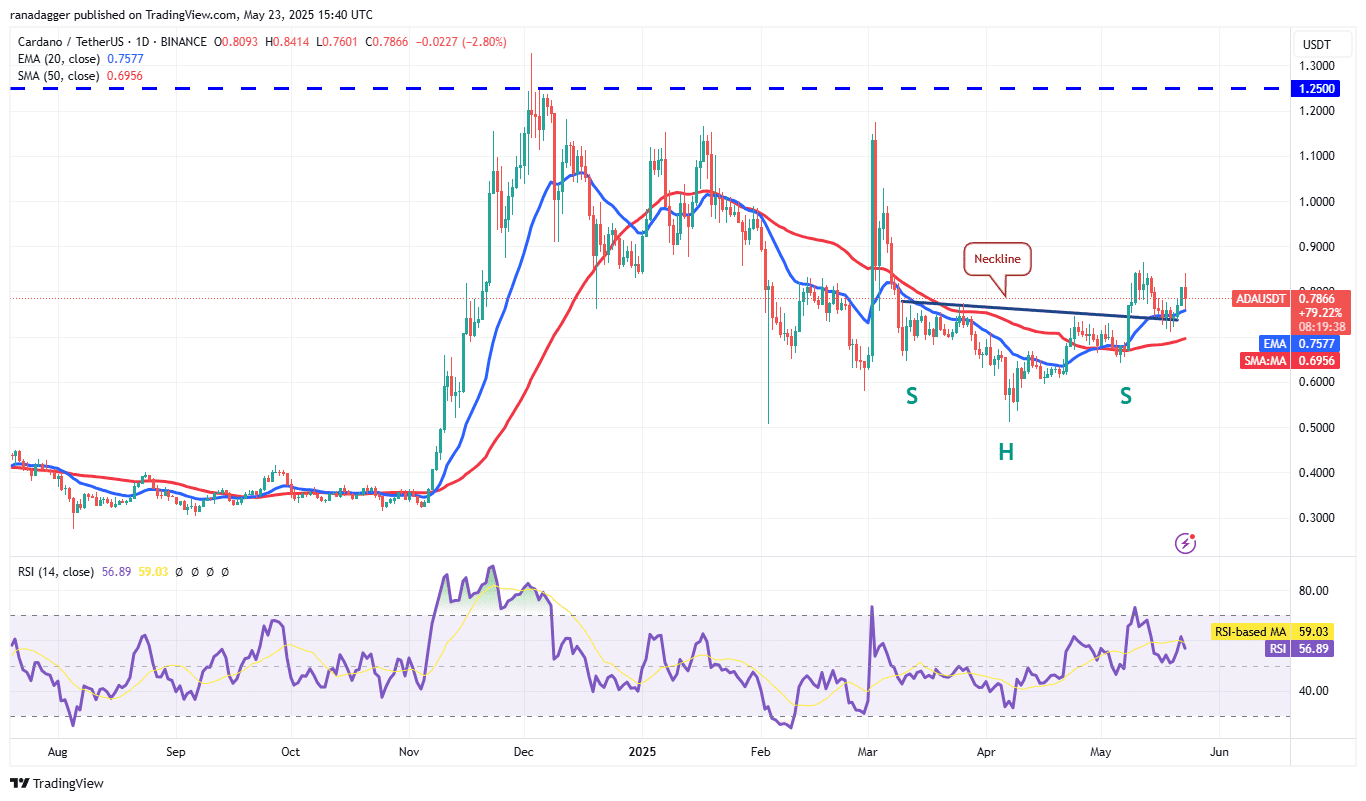
Cardano bounced off the neckline of an inverse H&S pattern but failed to clear the $0.86 resistance. A break below the neckline would signal bearish sentiment.
Key Support Levels:
- 50-day SMA: $0.69
- $0.60
Key Resistance Levels:
- $0.86
- $1.01
A strong bounce from the 20-day EMA ($0.75) would indicate buying interest, potentially leading to a retest of the $0.86 resistance.
Sui (SUI) Price Analysis
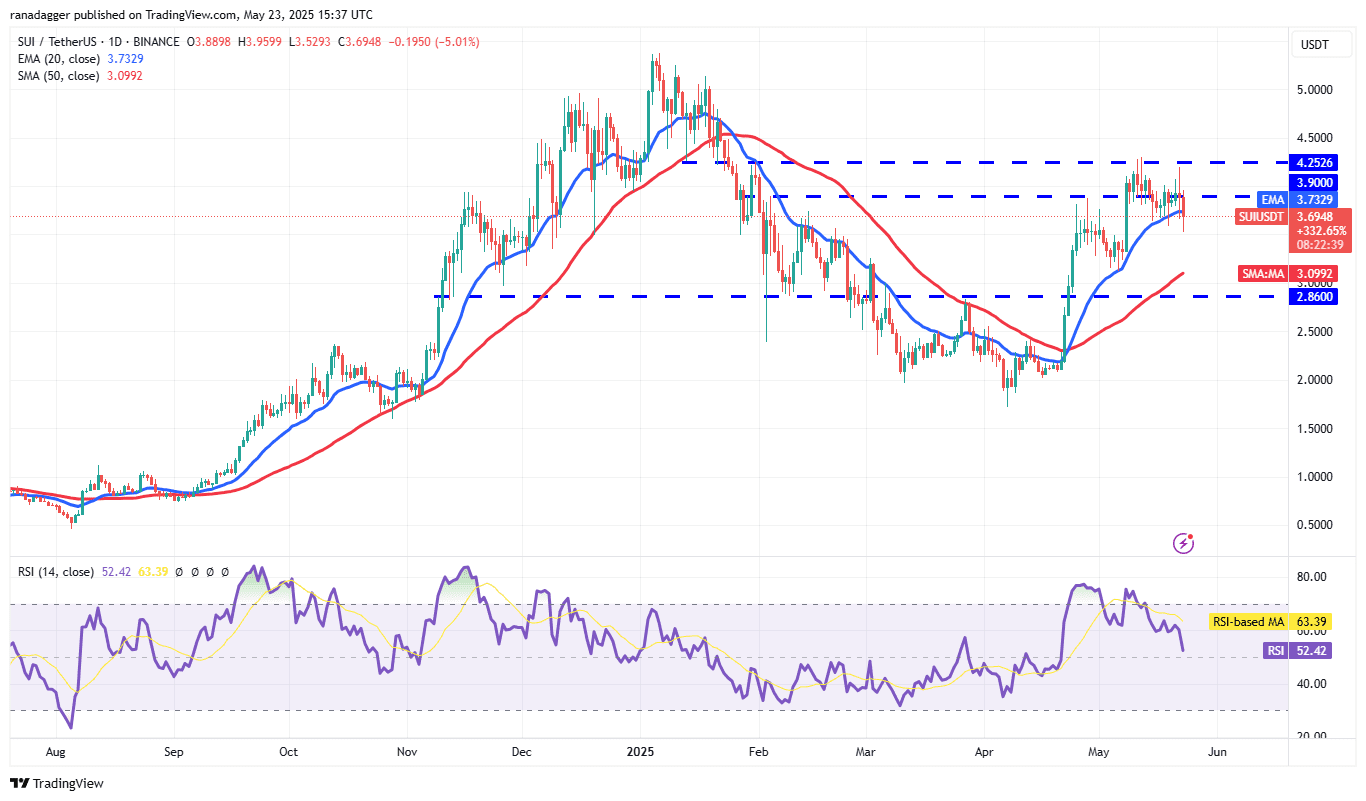
Sui failed to surpass the $4.25 resistance, suggesting strong selling pressure. A drop below the 20-day EMA ($3.73) is possible.
Key Support Levels:
- 20-day EMA: $3.73
- 50-day SMA: $3.09
Key Resistance Levels:
- $4.25
- $5.00
- $5.37
A break above $4.25 would indicate a resumption of the uptrend, targeting $5.00 and $5.37.
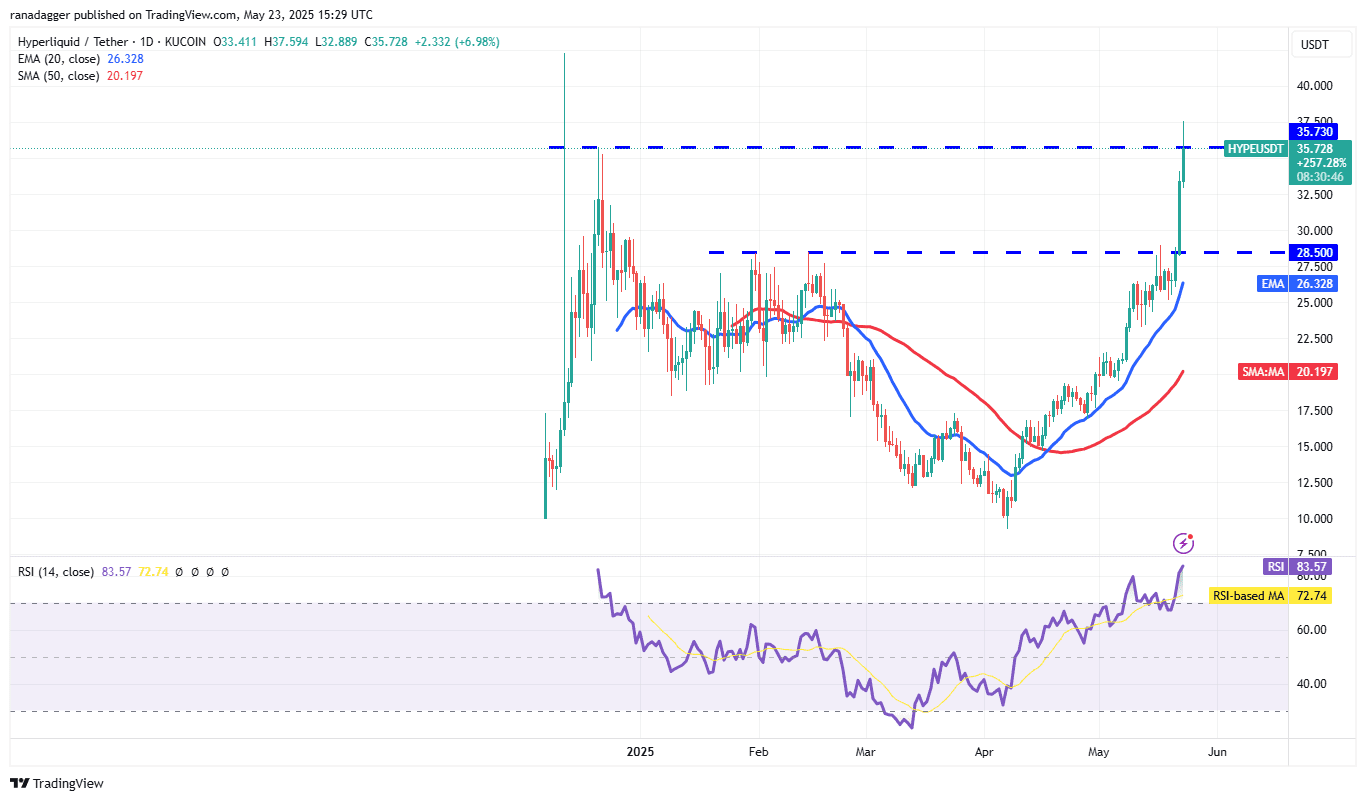
Hyperliquid (HYPE) Price Analysis
Hyperliquid broke above the $28.50 resistance, signaling a potential continuation of the upward trend. A long wick on the candlestick at $35.73 suggests bears are defending this level.
Key Support Levels:
- 20-day EMA: $26.32
Key Resistance Levels:
- $35.73
- $42.25
A swift drop below the 20-day EMA ($26.32) could indicate a local top has formed.
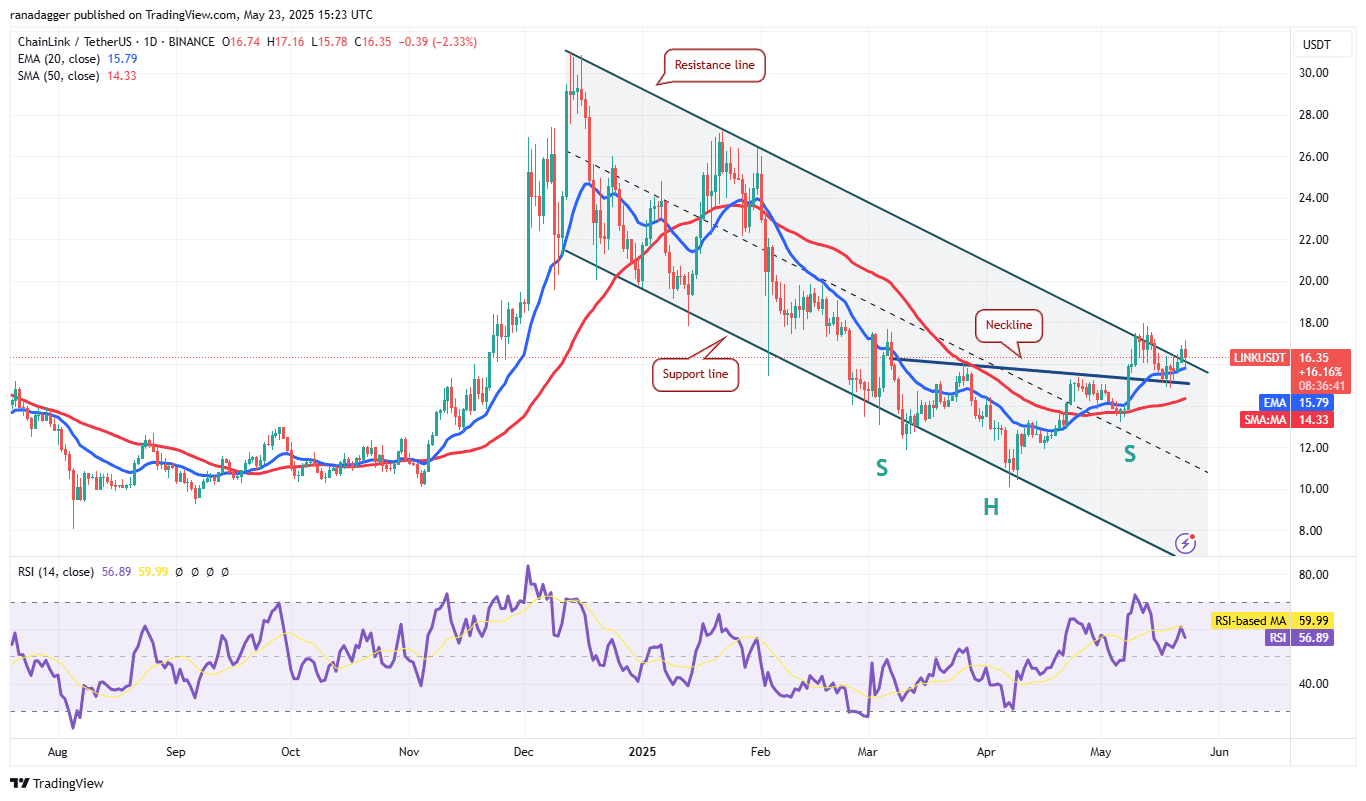
Chainlink (LINK) Price Analysis
Chainlink closed above the resistance line of a descending channel but is struggling to maintain momentum. Bears are attempting to pull the price back into the channel.
Key Support Levels:
- $13.20
Key Resistance Levels:
- $18.00
- $19.80
A break below the resistance line could indicate a bull trap, potentially leading to a drop towards $13.20. A solid bounce from the resistance line would suggest a flip into support, targeting $18.00 and $19.80.
Disclaimer: This analysis is for informational purposes only and does not constitute financial advice. Cryptocurrency investments are highly speculative and carry significant risk. Always conduct thorough research before investing.