Ethereum Accumulation Soars to Record Levels: A Deep Dive
Key Points:
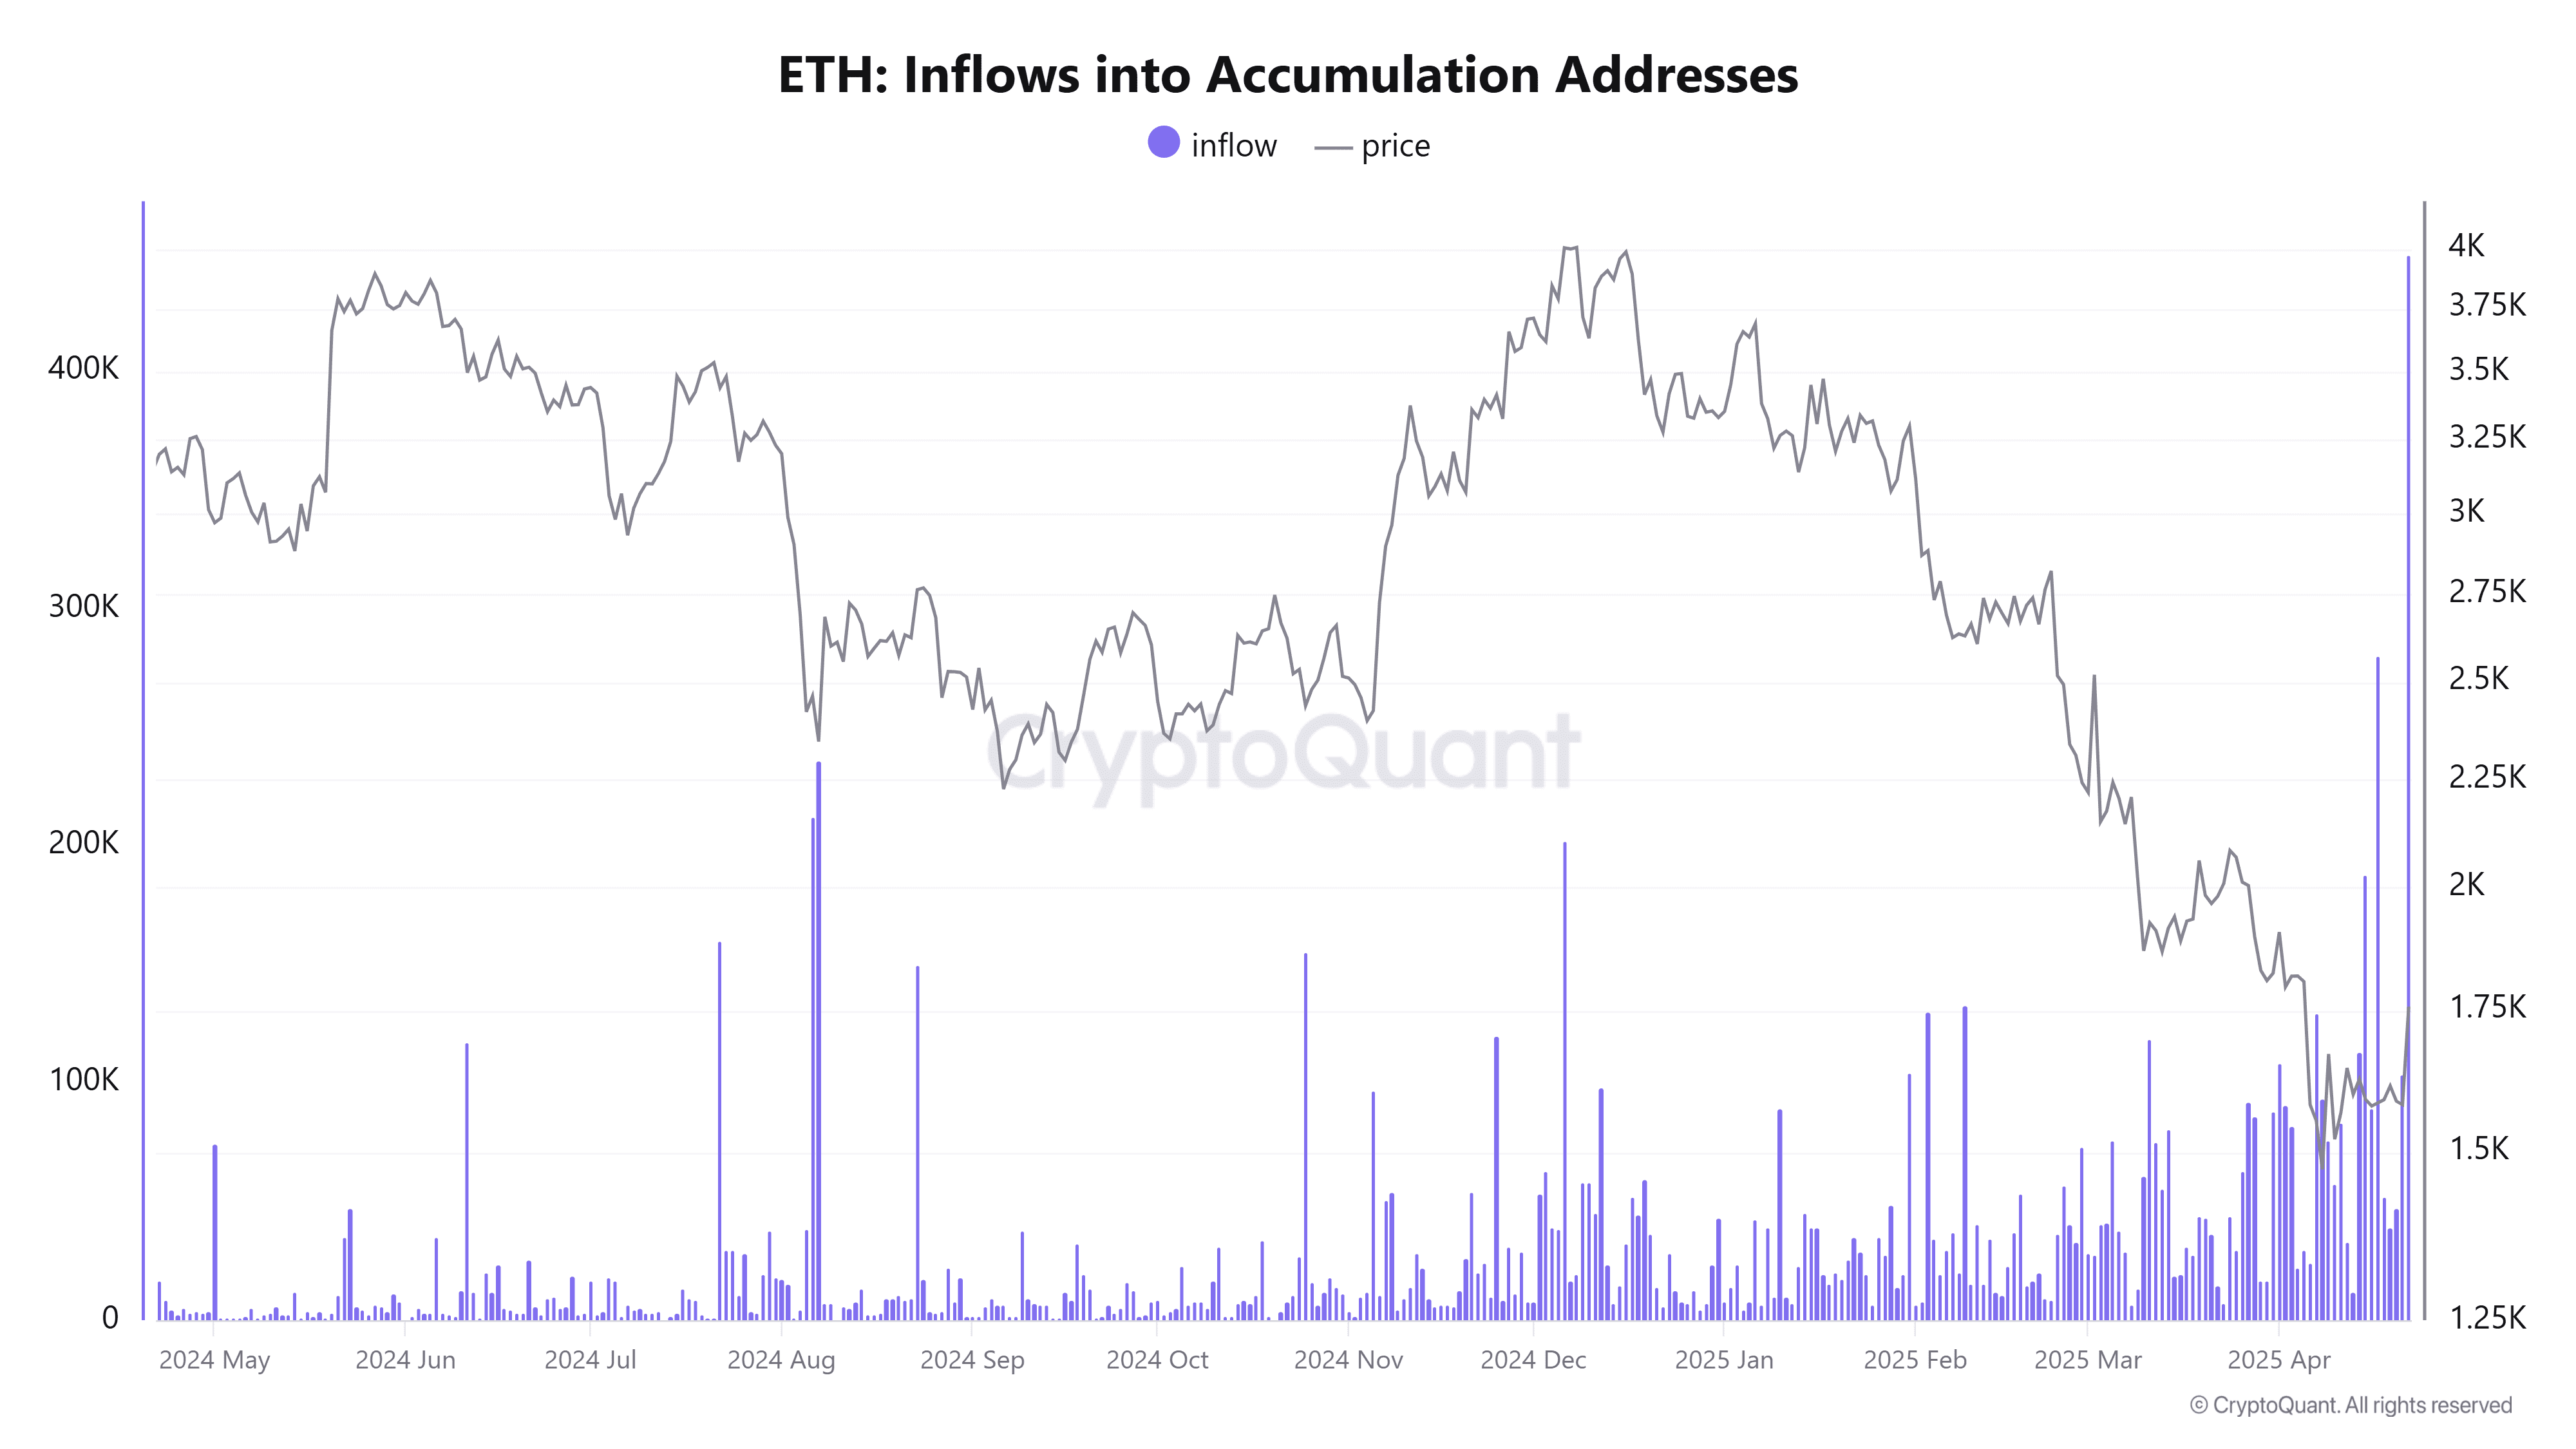
- On April 22, Ethereum saw a record single-day inflow of 449,000 ETH into accumulation addresses, the largest since 2018.
- Active Ethereum addresses increased by 10% between April 20 and 22, indicating growing network engagement.
- Despite increased accumulation, holders in these addresses currently face losses with a realized price above the current market value.
- DeFi activity, particularly DEX volumes, remains weak, contrasting with the positive accumulation trend.
- Ethereum faces key resistance at $1,895, a level where significant ETH supply is concentrated.
The Ethereum network witnessed a significant event on April 22nd, 2025: a record-breaking 449,000 Ether (ETH) flowed into accumulation addresses. This influx, valued at approximately $1,750 per ETH at the time, marks the largest single-day inflow since 2018. Accumulation addresses are typically associated with long-term holders who are accumulating ETH with the expectation of future price appreciation. This surge suggests a strong belief in Ethereum’s long-term potential, even amidst market volatility.
Realized Price and Holder Dynamics:
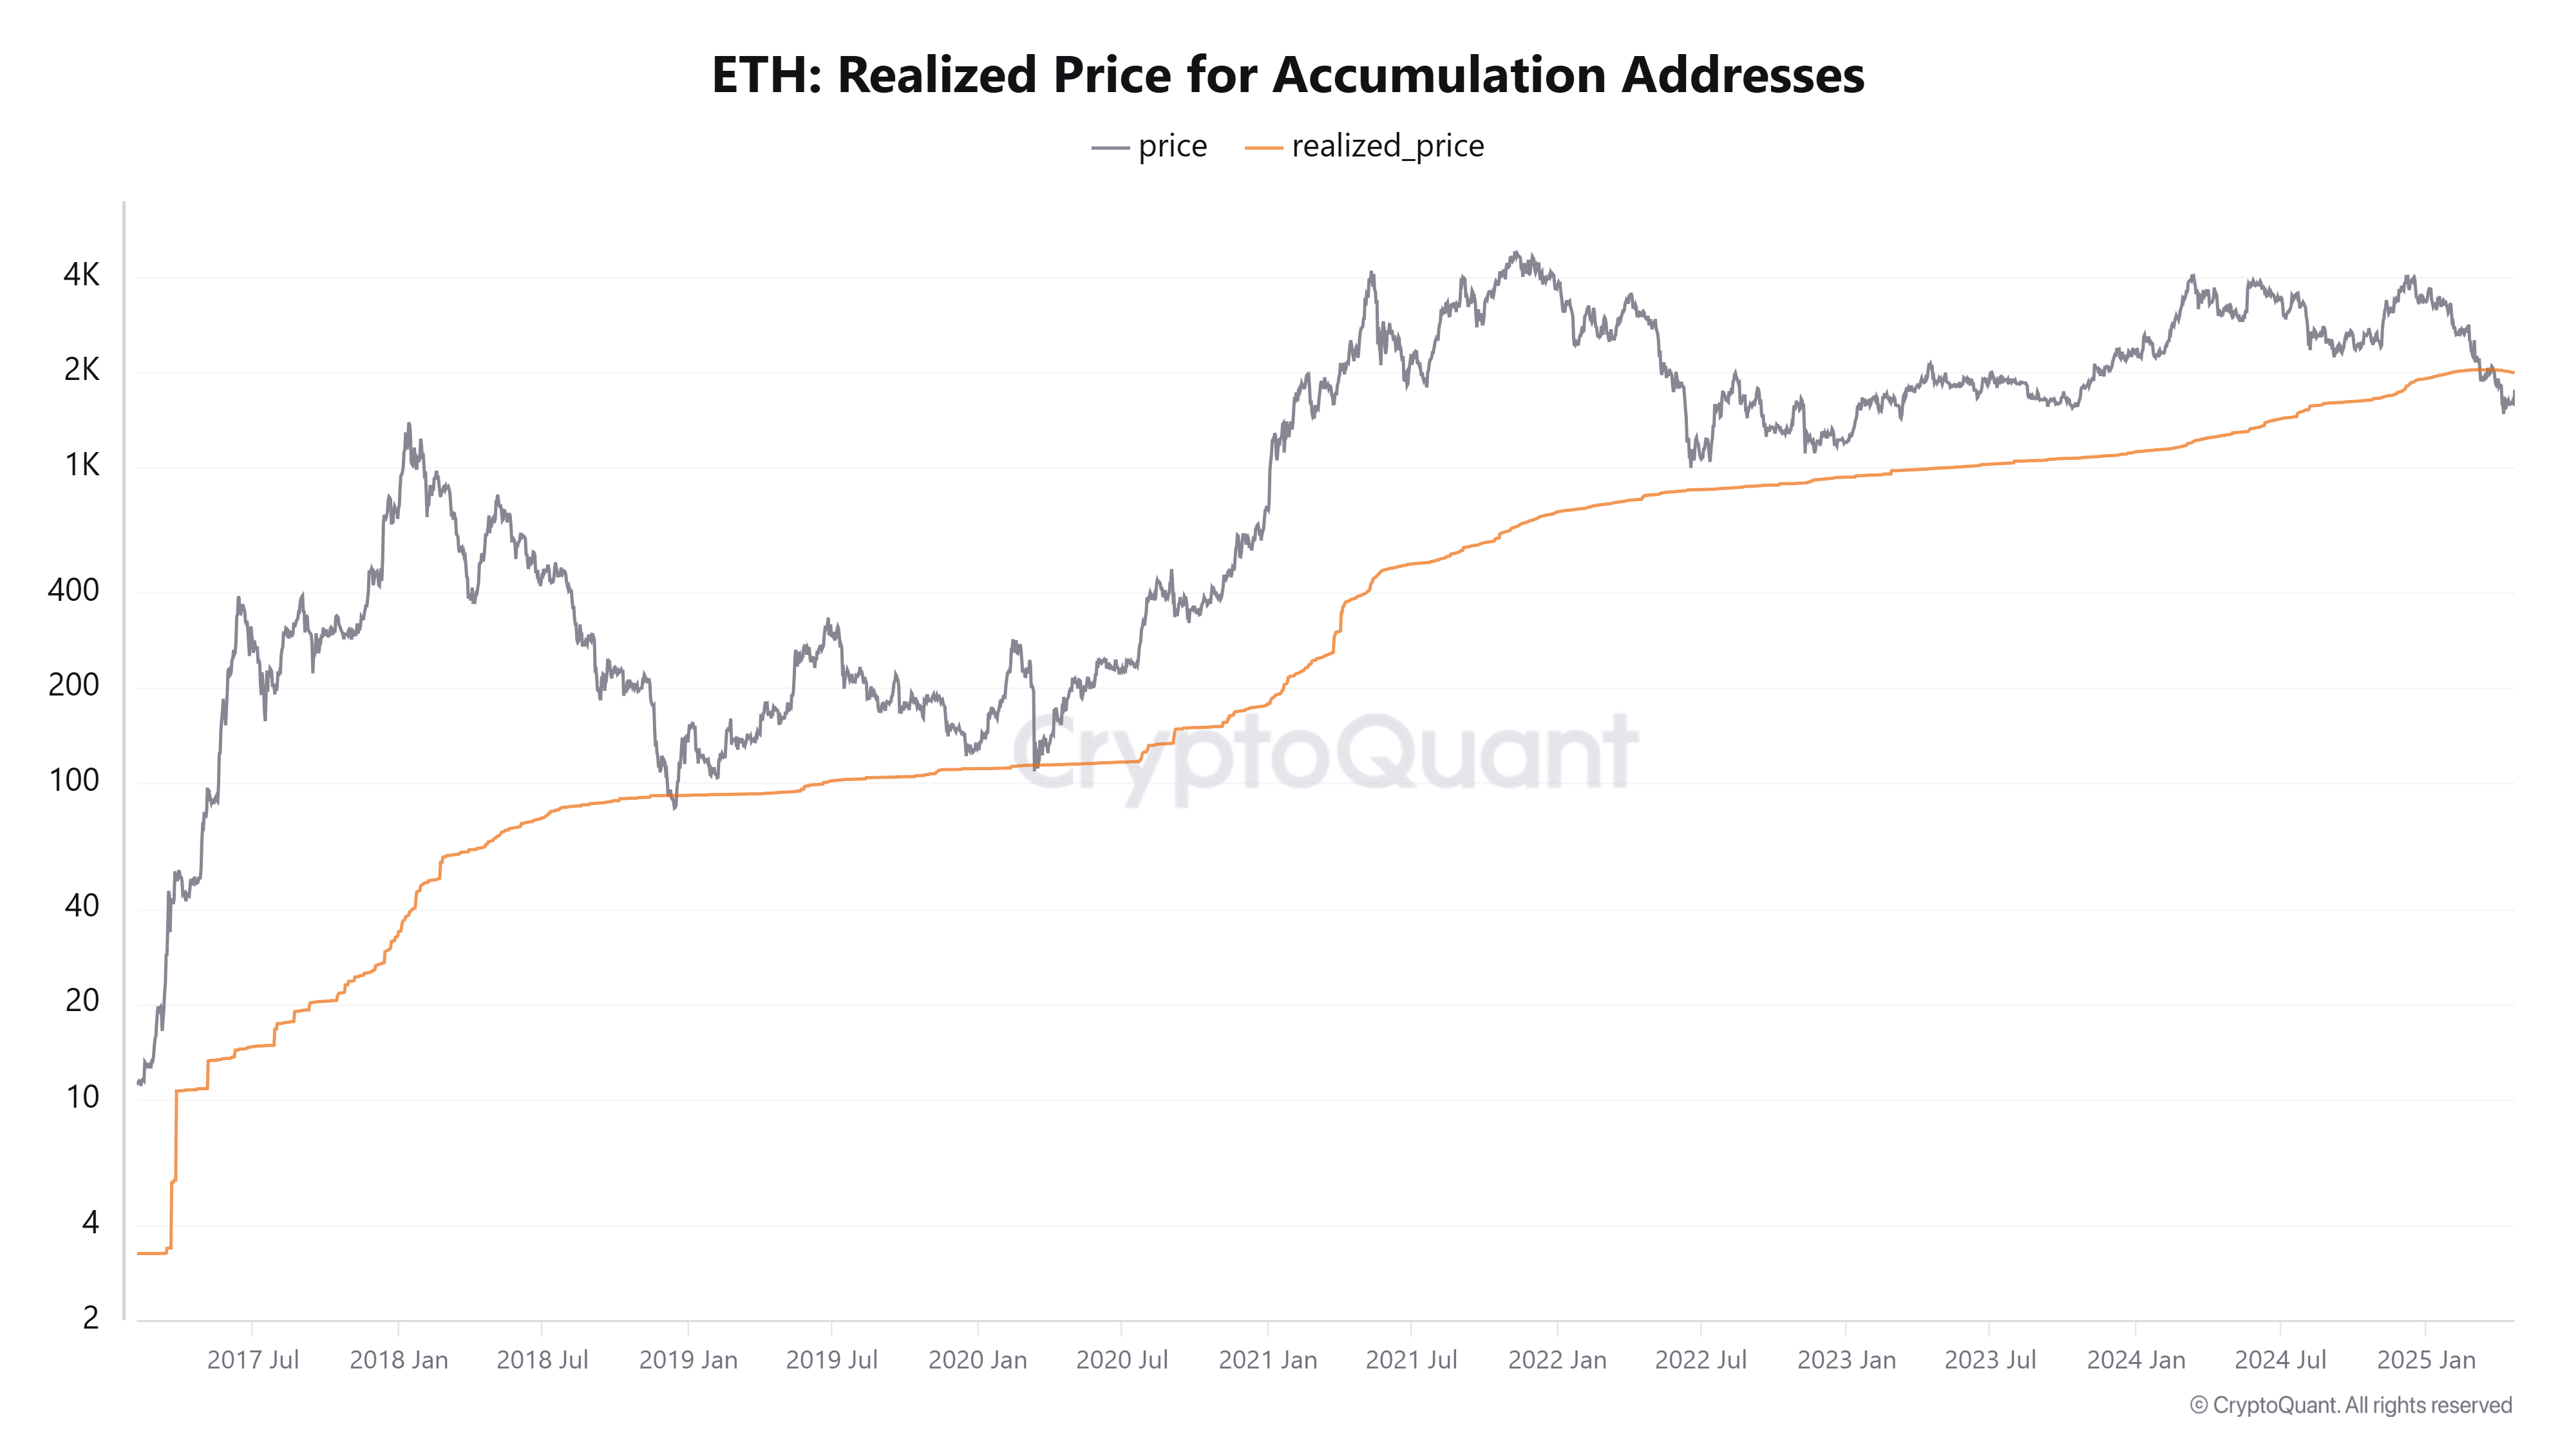
While the accumulation trend is positive, it’s important to note that the realized price for these accumulation addresses is $1,981. This means that, on average, these holders are currently underwater, as the market price remains below their acquisition cost. The realized price had been consistently below Ethereum’s market price since 2018, recently surpassing it, which indicates a shift in the dynamics of ETH holders. It is important to watch to see if this recent influx of accumulation is able to push the ETH market price above the average accumulation price.
On-Chain Activity and Network Engagement:
Beyond accumulation, Ethereum’s on-chain activity has also shown signs of improvement. Between April 20th and 22nd, active addresses on the network increased by 10%, rising from 306,211 to 336,366. This increase coincides with upward price movement, suggesting a growing level of engagement and a potentially bullish sentiment among users. Increased on-chain activity is generally seen as a positive indicator of network health and adoption.
DeFi Activity Remains Subdued:
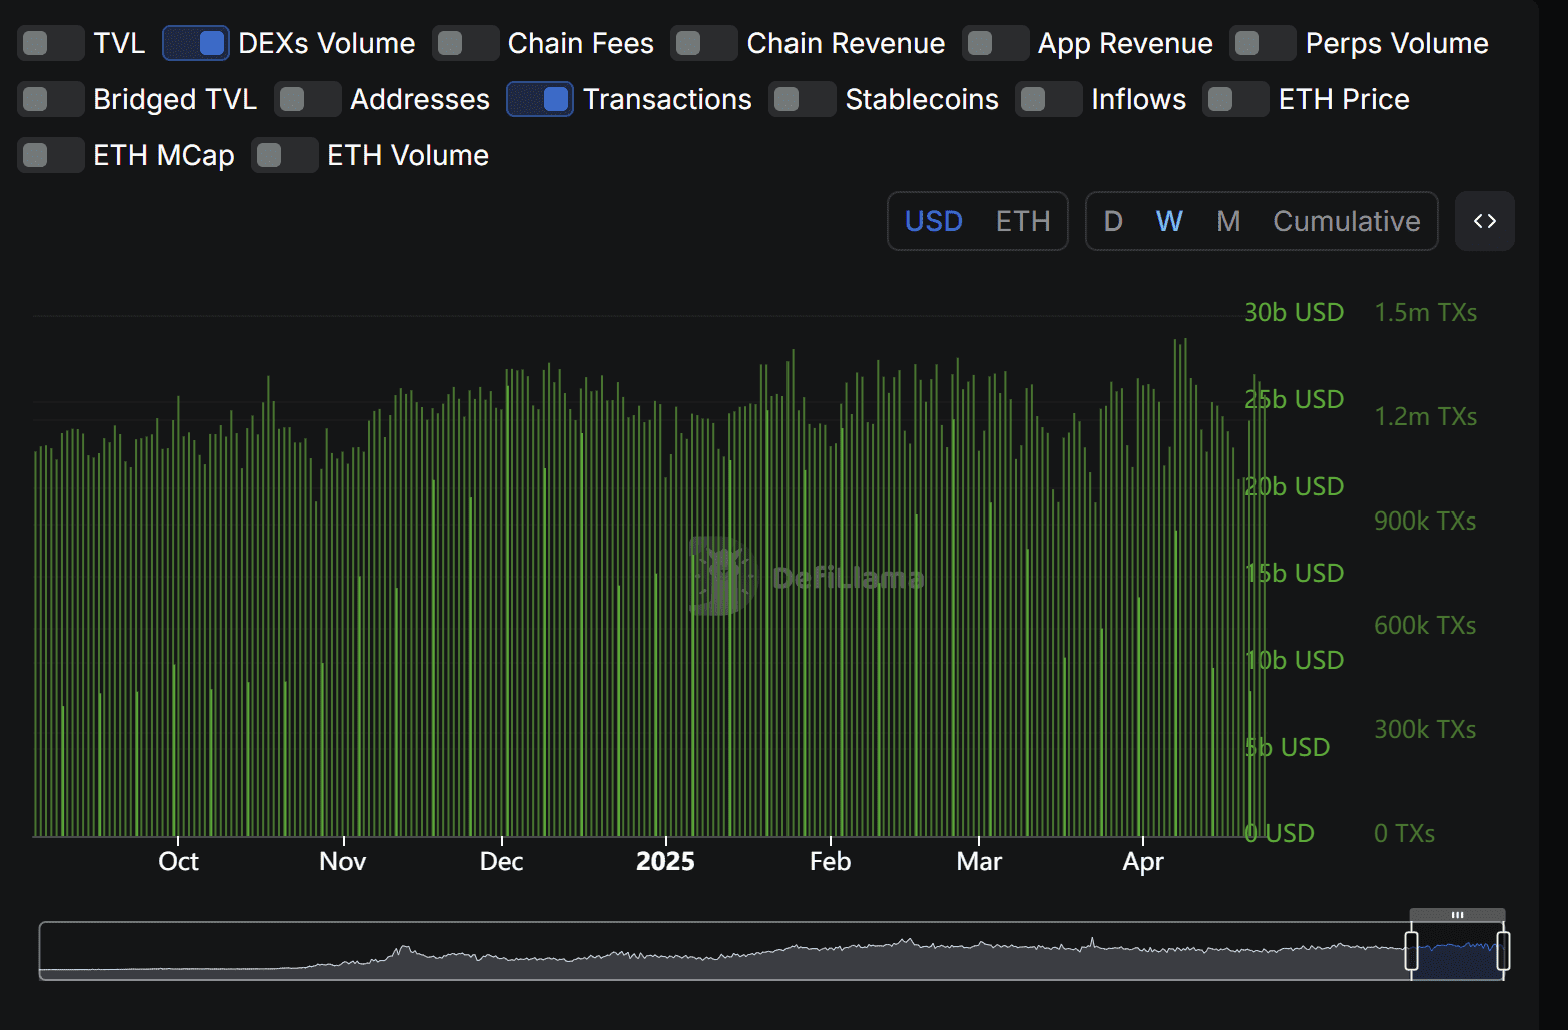
Despite the positive signals in accumulation and on-chain activity, decentralized finance (DeFi) activity on Ethereum continues to lag. Data from DefiLlama reveals that decentralized exchange (DEX) volumes are declining, while transaction counts remain stable at approximately 1.3 million per week. This suggests that the momentum in the broader DeFi ecosystem might not be as strong as the accumulation trends indicate. A future upswing in DeFi activity could potentially boost Ethereum’s price.
Ethereum Faces Key Resistance at $1,895
Analysis of the Cost Basis Distribution (CBD) heatmap for Ethereum highlights a significant supply concentration around $1,895.50. Approximately 1.64 million ETH is held by investors who purchased during November 2024 at this price point. This level acts as a potential resistance, as these holders might be inclined to sell to break even or secure profits if the price approaches or reaches this level. This resistance is key to watch in the short-term to understand the direction that ETH is heading.
From a technical analysis perspective, the $1,895 resistance is further reinforced. The price currently hovers near the 50-day exponential moving average (EMA) on the daily chart, a critical indicator for trend reversals. A failure to break above this EMA could signal continued bearish momentum, while a successful breach could offer hope for a bullish reversal. As a result, the short-term performance of ETH is directly correlated to its ability to surpass its $1,895.50 resistance.
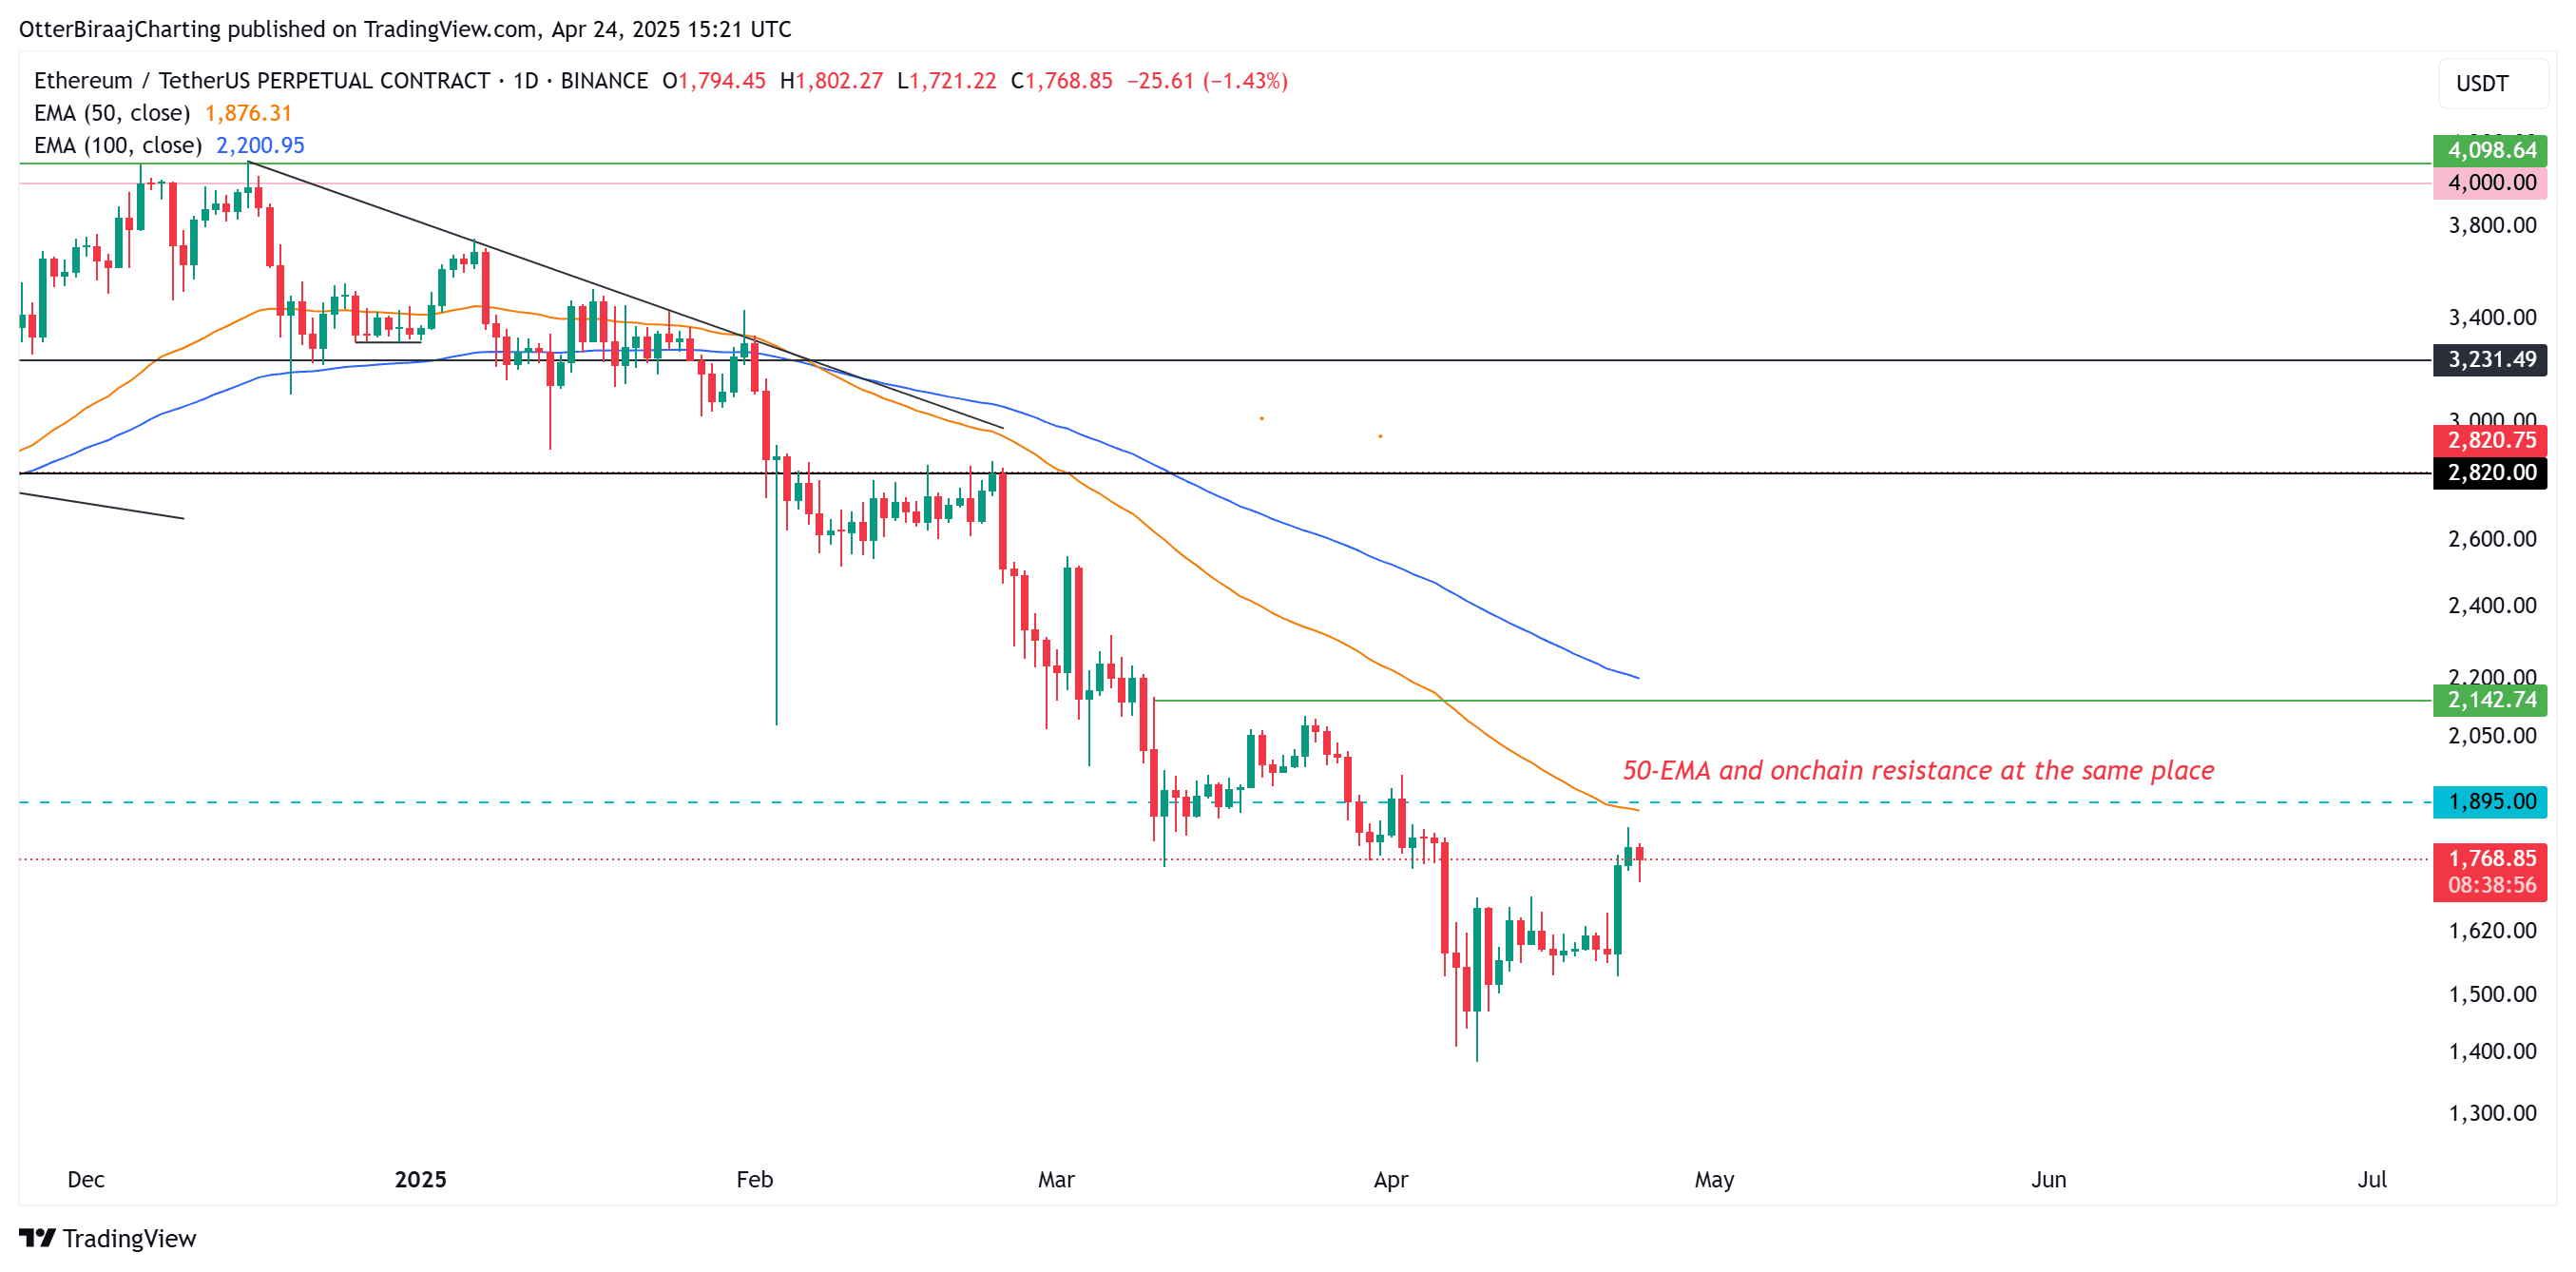
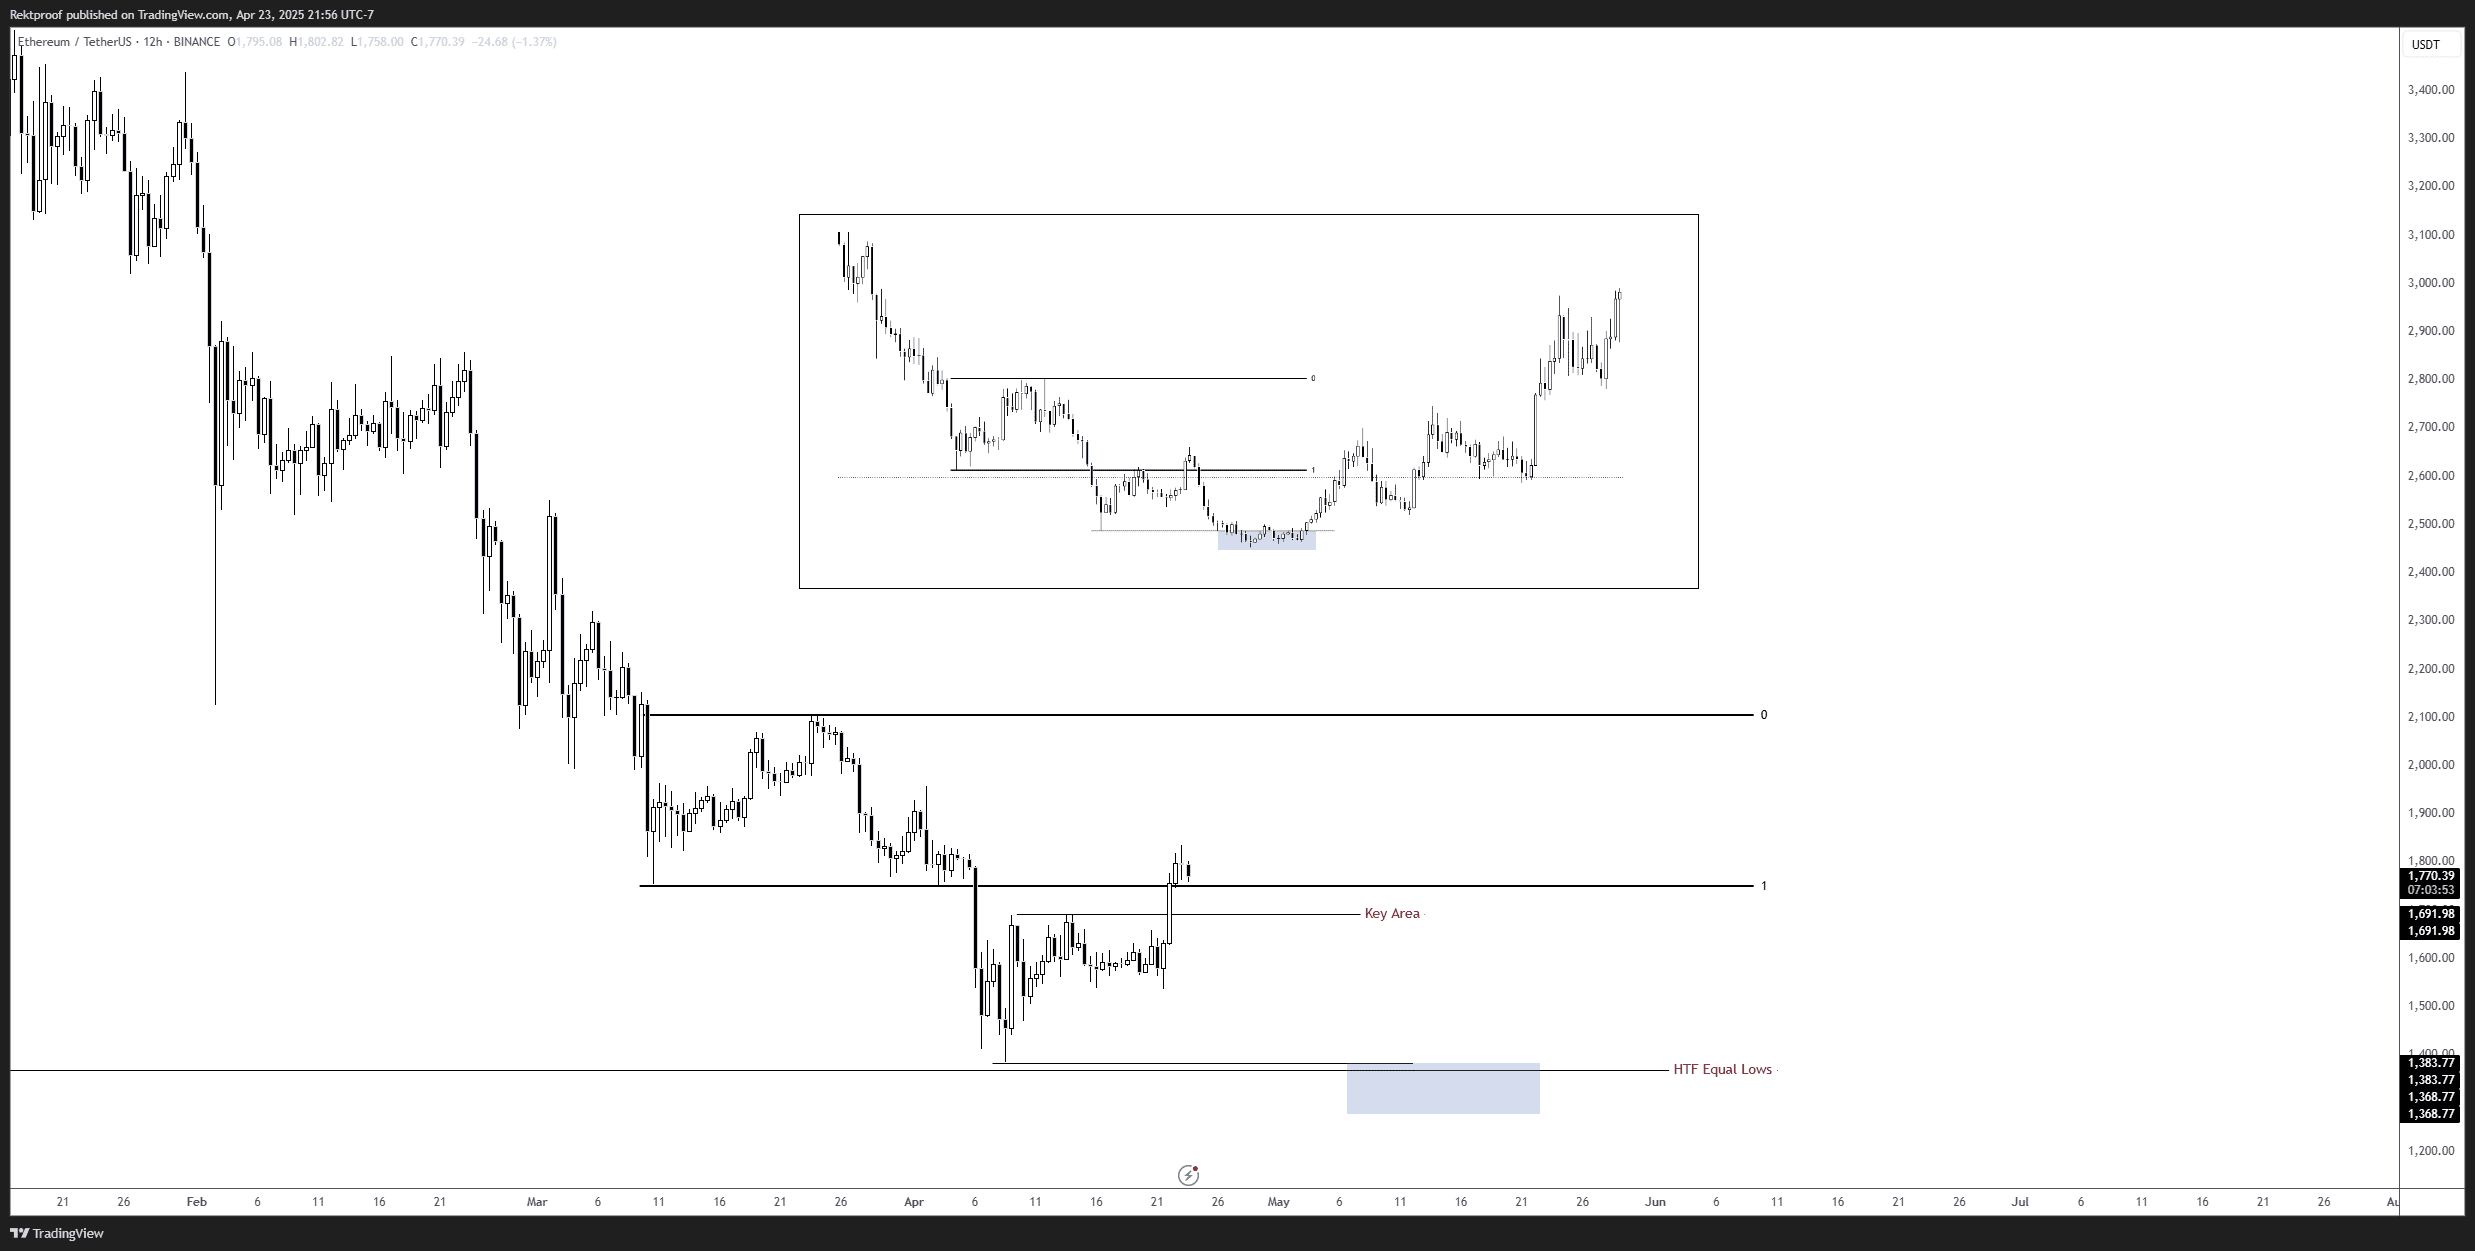
Currently, Ethereum remains in a downtrend on higher time frame charts, lacking clear signs of a bullish reversal. A daily close above $2,142 is crucial to initiate a potential recovery, breaking the established pattern of lower highs and lower lows. Until this happens, the threat of bearish activity continues to loom over the asset.
However, some analysts warn of a potential bearish fractal forming—a repeating price pattern that has previously led to declines. This suggests that Ethereum could face another rejection and potentially fall below $1,400 if market conditions deteriorate. As a result, investors and interested parties need to do their own research before engaging with the asset.
In Conclusion:
The recent record inflow of ETH into accumulation addresses signifies a strong long-term belief in Ethereum. However, the market remains complex, with holders currently facing losses, DeFi activity remaining subdued, and key resistance levels to overcome. Investors should closely monitor these factors and conduct thorough research before making any investment decisions. The interplay between accumulation, on-chain activity, and technical resistance will likely dictate Ethereum’s price trajectory in the near future.