Ethereum (ETH) is exhibiting several bullish indicators, suggesting a potential price surge. However, mixed signals and trader sentiment warrant a cautious approach. Here’s a breakdown of the key factors influencing Ethereum’s price:
Bullish Indicators for Ethereum (ETH)
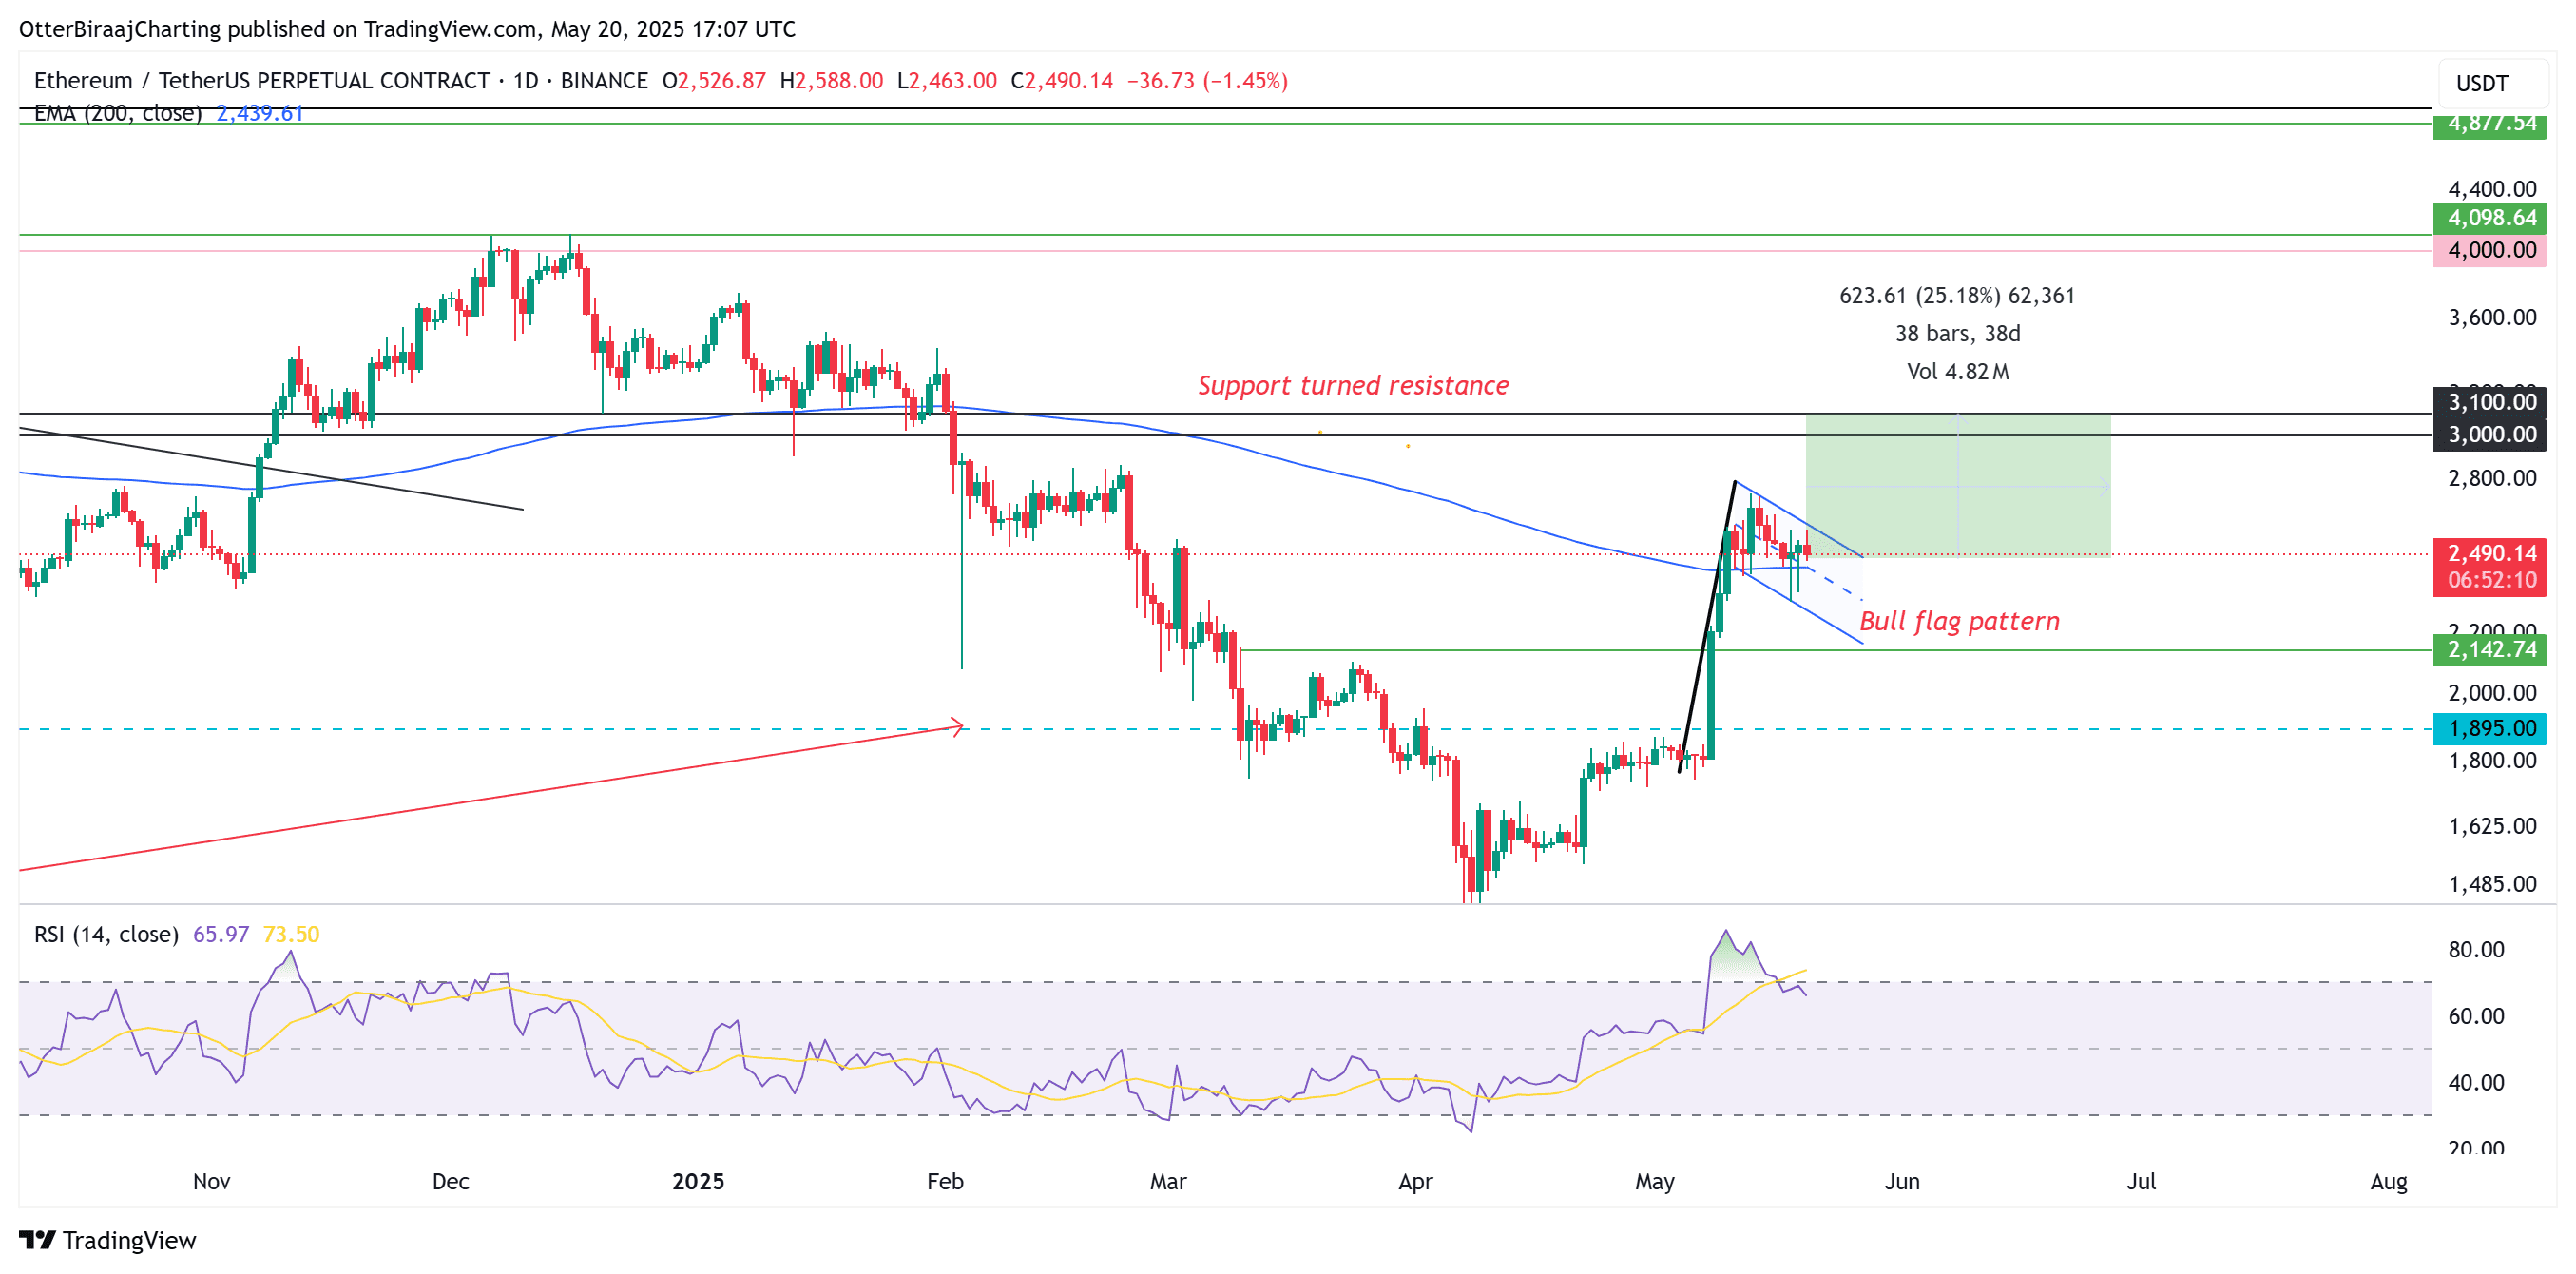
- Bull Flag Formation: Ethereum’s daily chart shows a bull flag pattern, with a potential breakout above $2,600 targeting $3,600. This pattern is a continuation pattern that suggests the prior upward trend will resume.
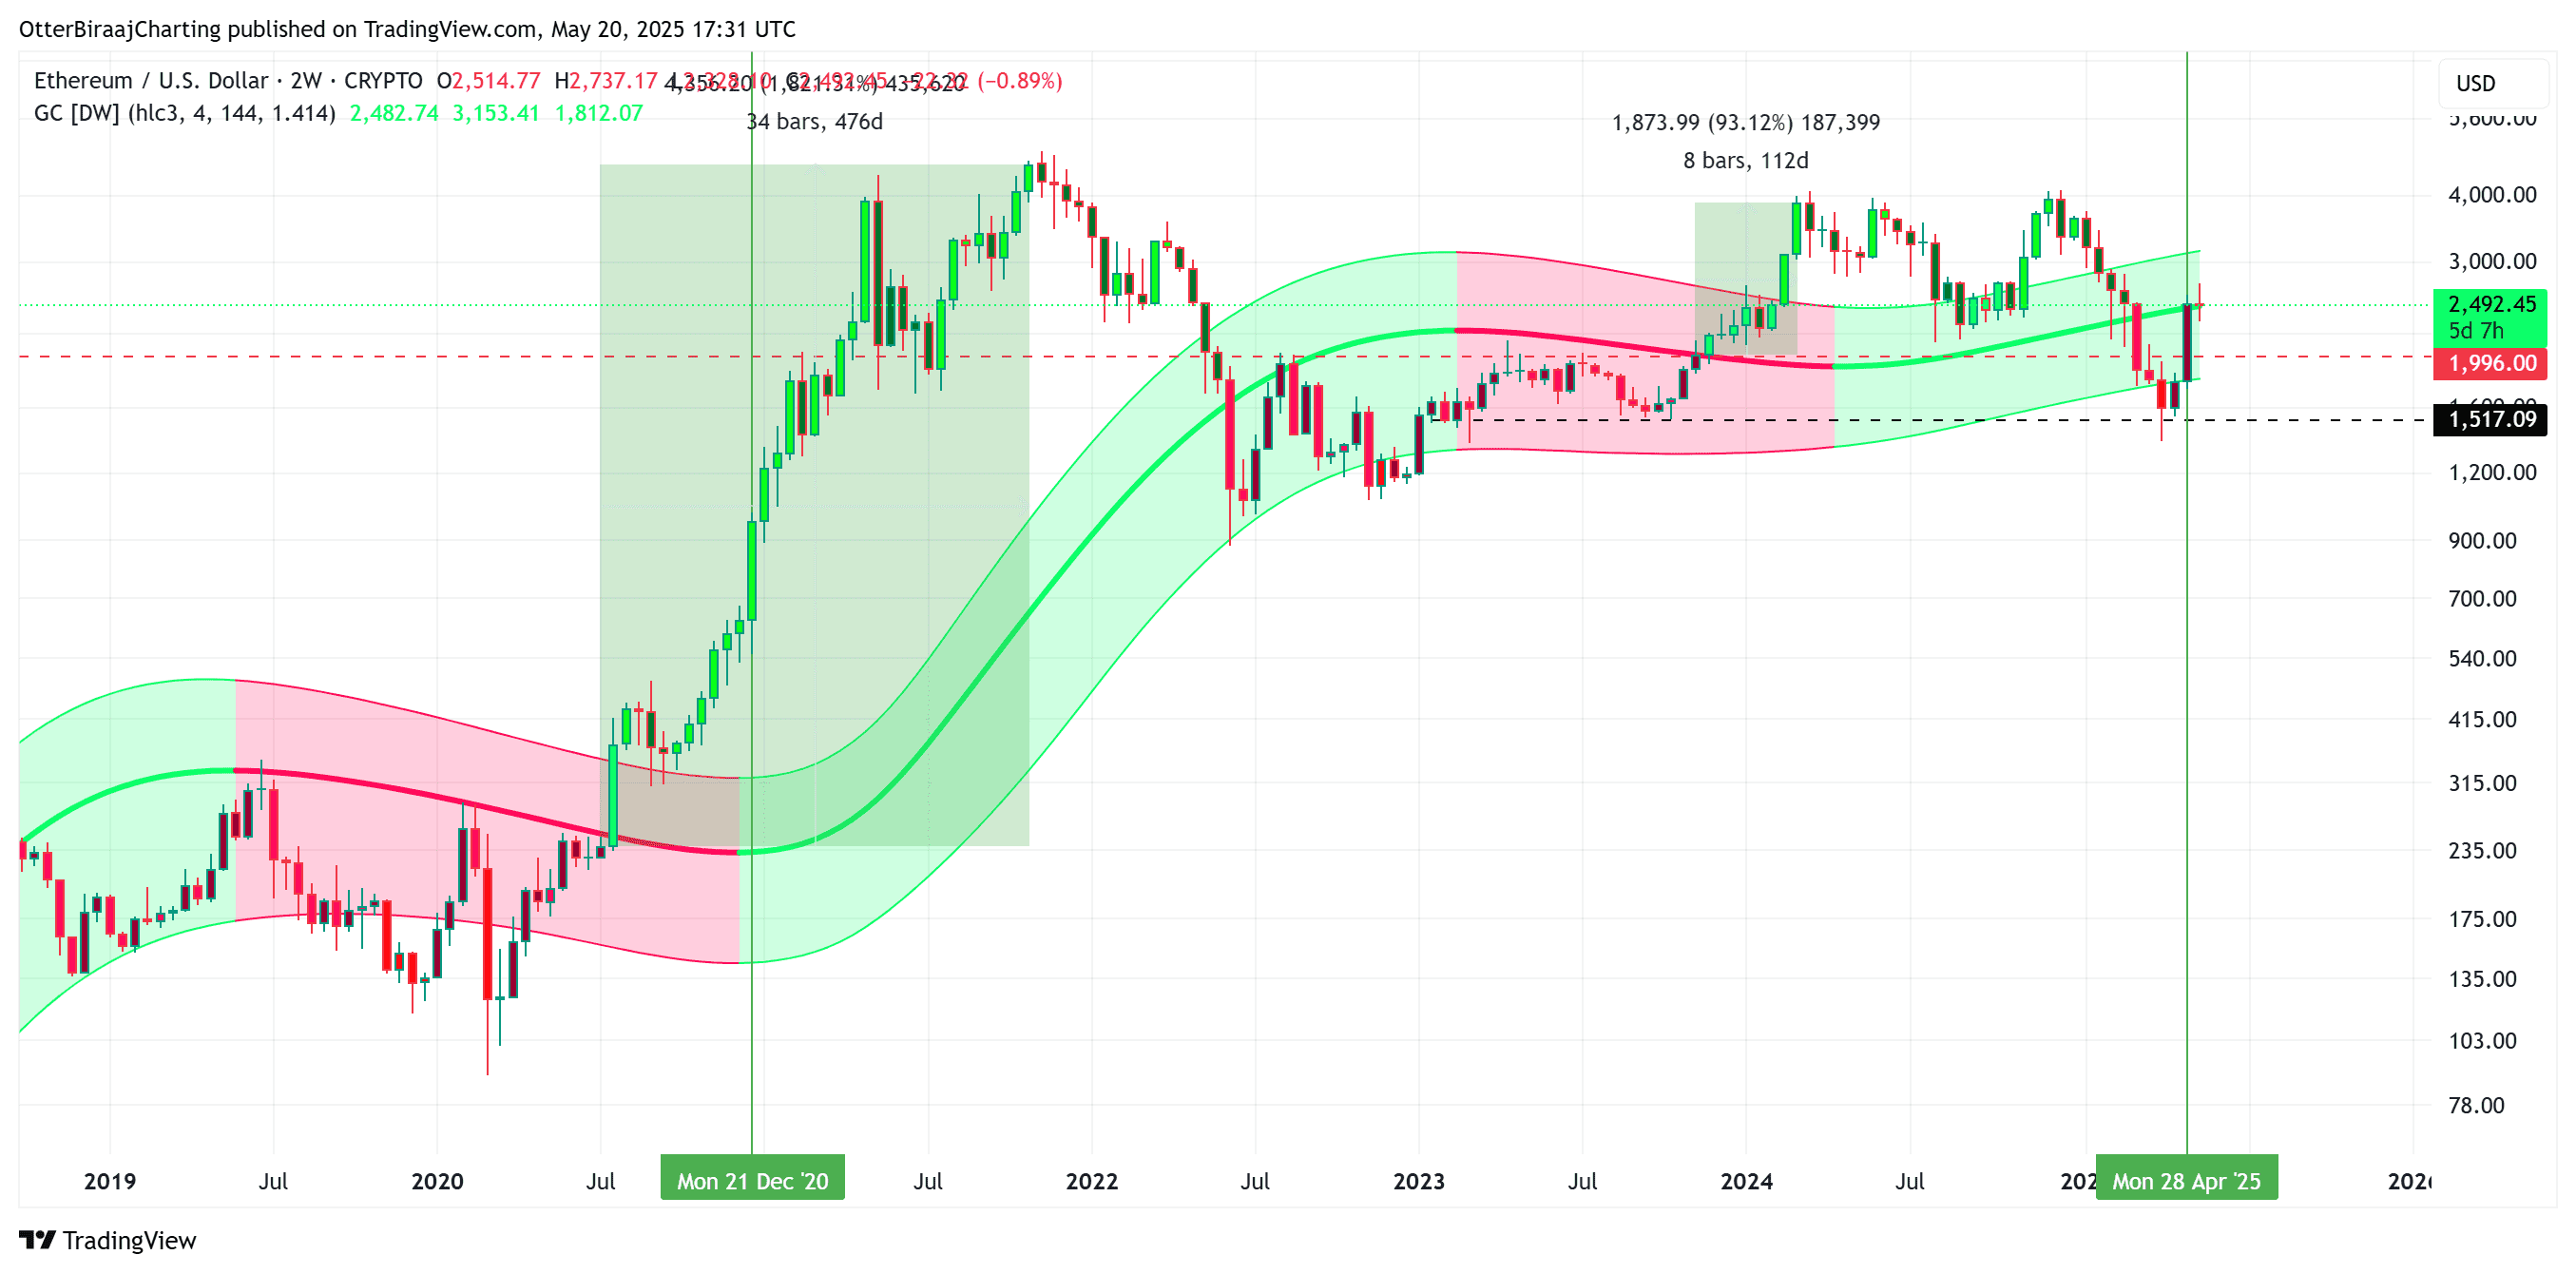
- Gaussian Channel Midline Reclaim: Ethereum is attempting to reclaim the midline of the two-week Gaussian Channel, a technical indicator that has historically preceded significant rallies. Crossing above this midline has previously led to substantial price increases.
- Golden Cross (12-hour chart): A golden cross between the 50-day and 200-day Simple Moving Averages (SMA) has been observed, potentially further strengthening a bullish breakout. However, its presence on a 12-hour chart makes it less reliable than on a daily chart.
Potential Price Targets
- Immediate Target: $3,000 – $3,100 resistance zone.
- Breakout Target: $3,600, calculated based on the bull flag pattern.
Bearish Considerations and Trader Sentiment
Despite the bullish signals, some traders and analysts express caution, anticipating a possible period of consolidation or correction.
- Resistance Level: Ethereum is consolidating under a resistance level below $2,800. Failure to break above this level in the coming days could lead to a correction.
- Range-Bound Environment: Some analysts predict a range-bound environment for several weeks, where the price oscillates within a defined range.
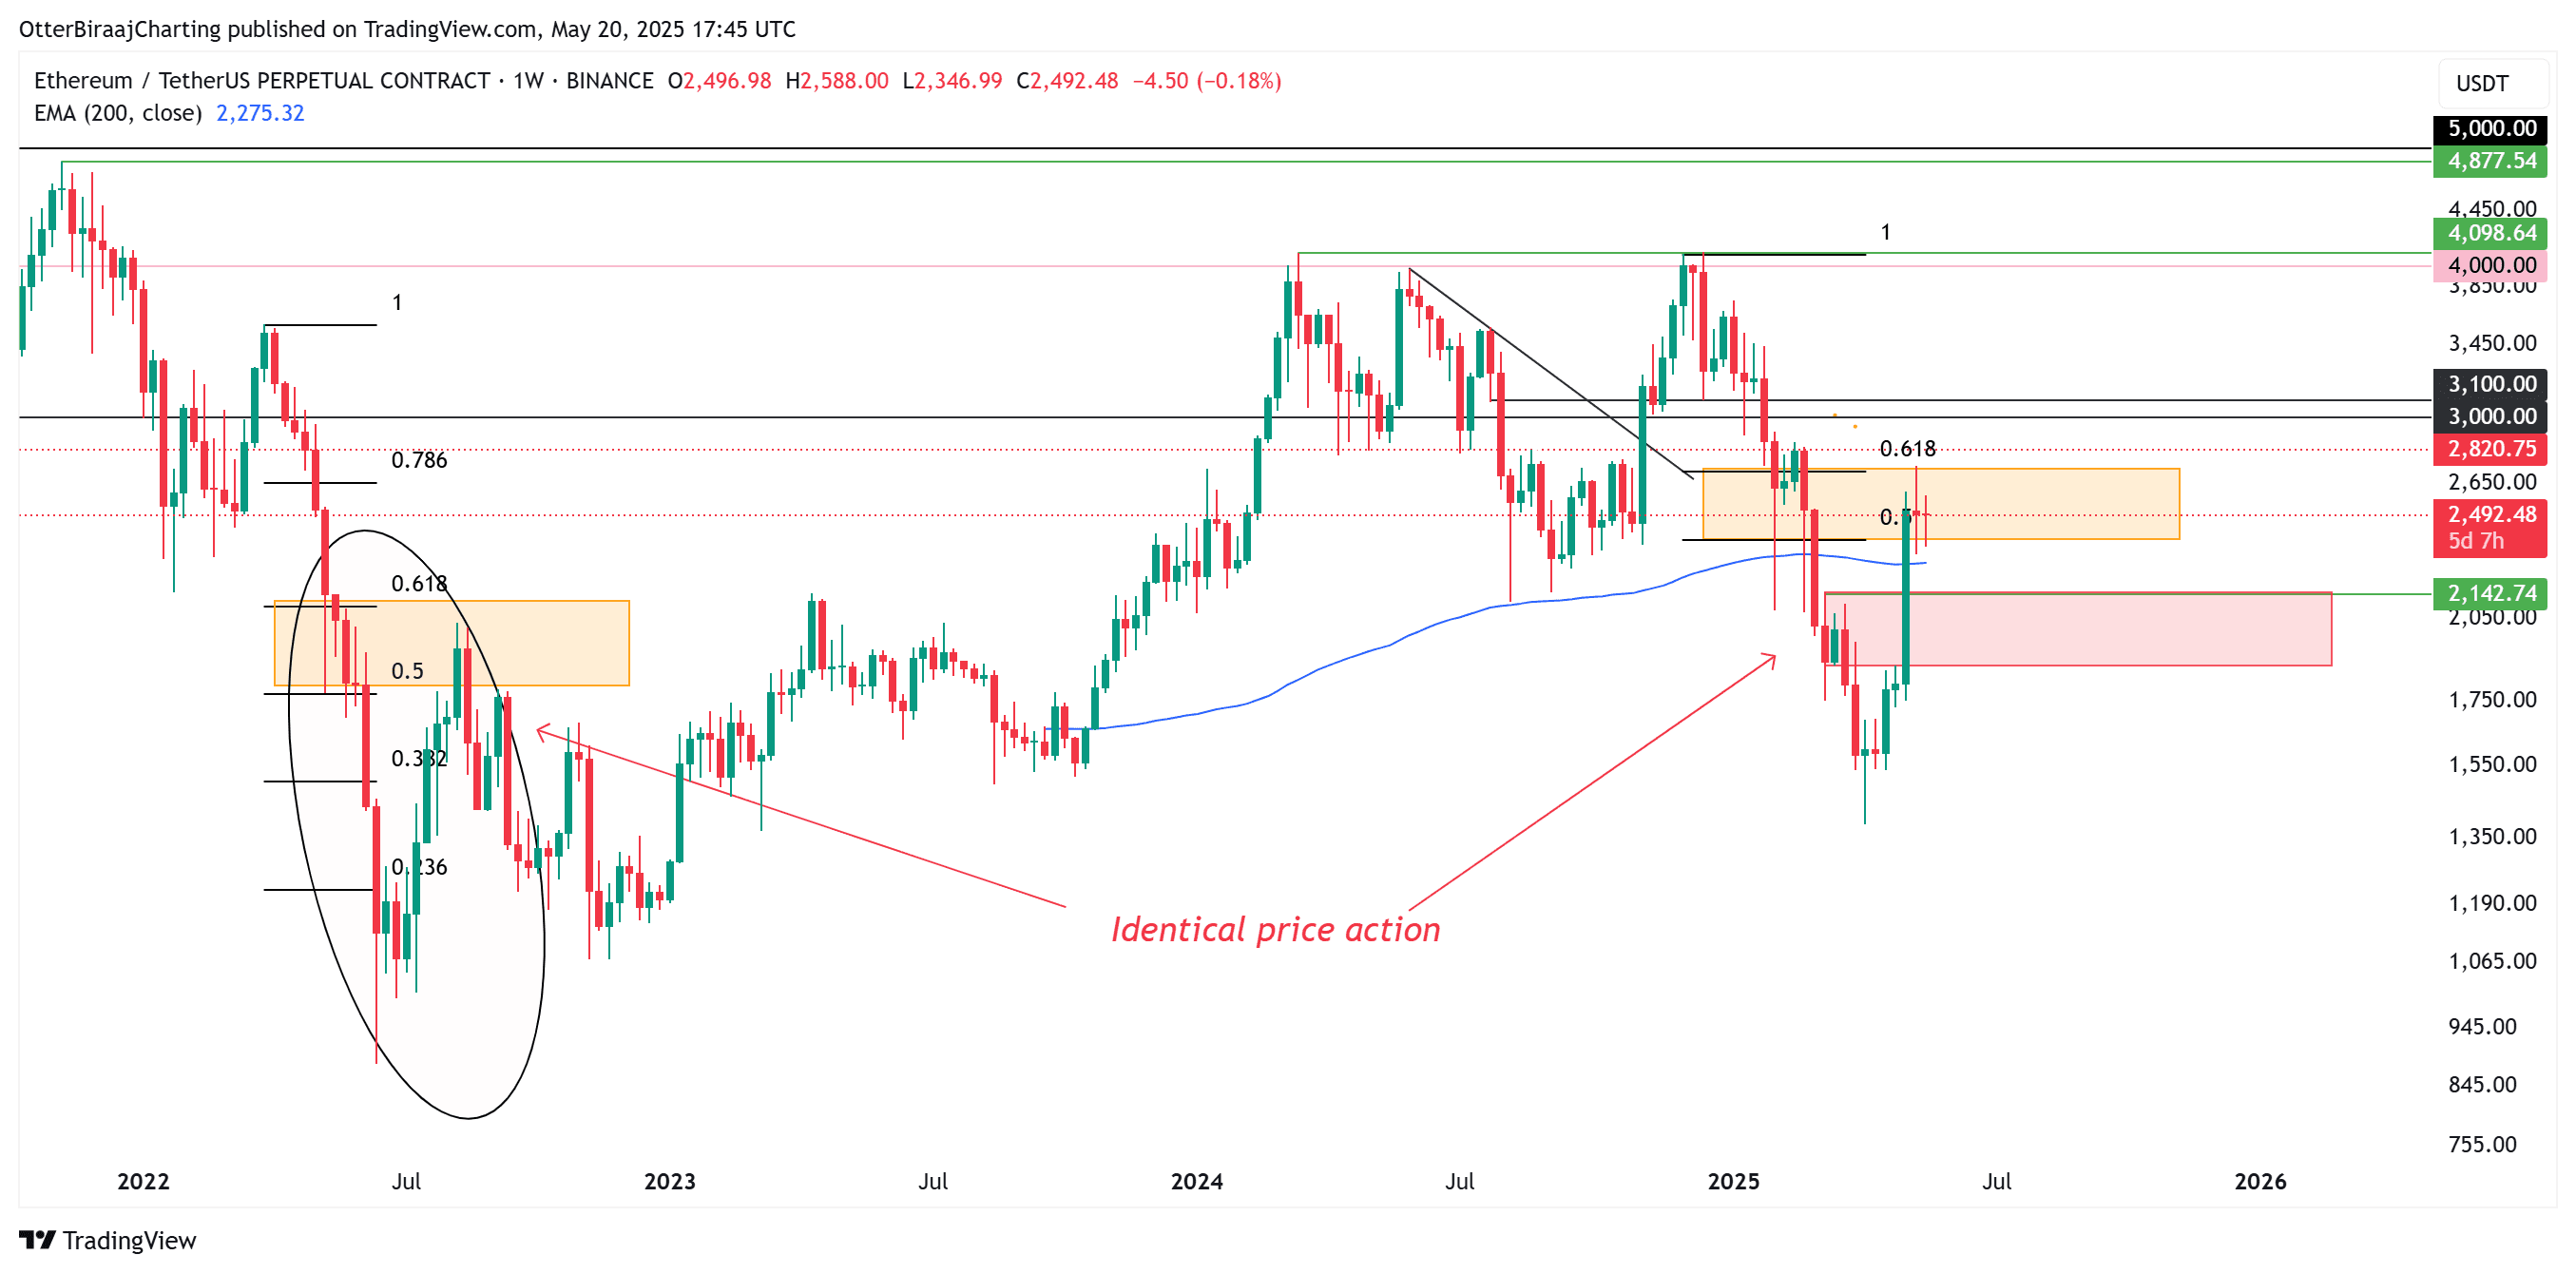
- Fibonacci Retracement: Ethereum recently retested the 0.5 to 0.618 Fibonacci levels, which could trigger a short-term correction.
Support Levels to Watch
- Immediate Support: Around $2,150.
- Stronger Support: $1,900.
Historical Performance and the Gaussian Channel
The Gaussian Channel midline has proven to be a significant indicator of potential rallies. Previous instances include:
- 2023: A 93% surge to $4,000 after a similar crossover.
- 2020: A massive 1,820% increase, triggering an altcoin rally.
However, it’s important to note that this indicator is not foolproof. A similar setup in August 2022 was invalidated during a market correction, highlighting the inherent risks of relying solely on one indicator.
Key Takeaways
- Ethereum is displaying bullish patterns, suggesting a potential rally toward $3,600.
- The Gaussian Channel midline reclaim adds further weight to the bullish outlook.
- However, traders should exercise caution due to resistance levels and the possibility of a range-bound environment or correction.
- Monitoring support levels and key resistance points is crucial for managing risk.
Disclaimer: This analysis is for informational purposes only and does not constitute financial advice. Cryptocurrency investments are inherently risky, and you should conduct thorough research and consult with a qualified financial advisor before making any investment decisions.