Ethereum (ETH) is exhibiting multiple signals that suggest a potential surge in price, mirroring conditions seen before its historic 2017 bull run, where it rallied by 25,000%. This analysis delves into these key indicators, offering insights into the possibility of another substantial price increase.
Key Takeaways:
- Dragonfly Doji Candlestick: A rare monthly Dragonfly Doji candlestick has appeared, a pattern historically associated with the start of major ETH bull market cycles.
- Parabolic Support Retest: ETH is currently retesting its long-term parabolic support zone, a zone that acted as a launchpad for its 2017 rally.
- MVRV Z-Score: The MVRV Z-Score has entered the accumulation zone, indicating that Ethereum is currently undervalued.
Dragonfly Doji Candlestick: A Bullish Signal
The appearance of a Dragonfly Doji candlestick on Ethereum’s monthly chart is a noteworthy event. This pattern, characterized by a long lower wick and a small or non-existent upper wick, suggests that buyers are stepping in to reject lower prices. This often signals a potential shift in momentum from a downtrend to an uptrend.
Historically, a similar Dragonfly Doji formation preceded Ethereum’s massive 2017 rally. While not a guarantee of future performance, the recurrence of this pattern is a strong indicator of potential bullish activity. The pattern is confirmed when the price closes at or near its opening level, and the long lower wick demonstrates strong buying pressure during the month.
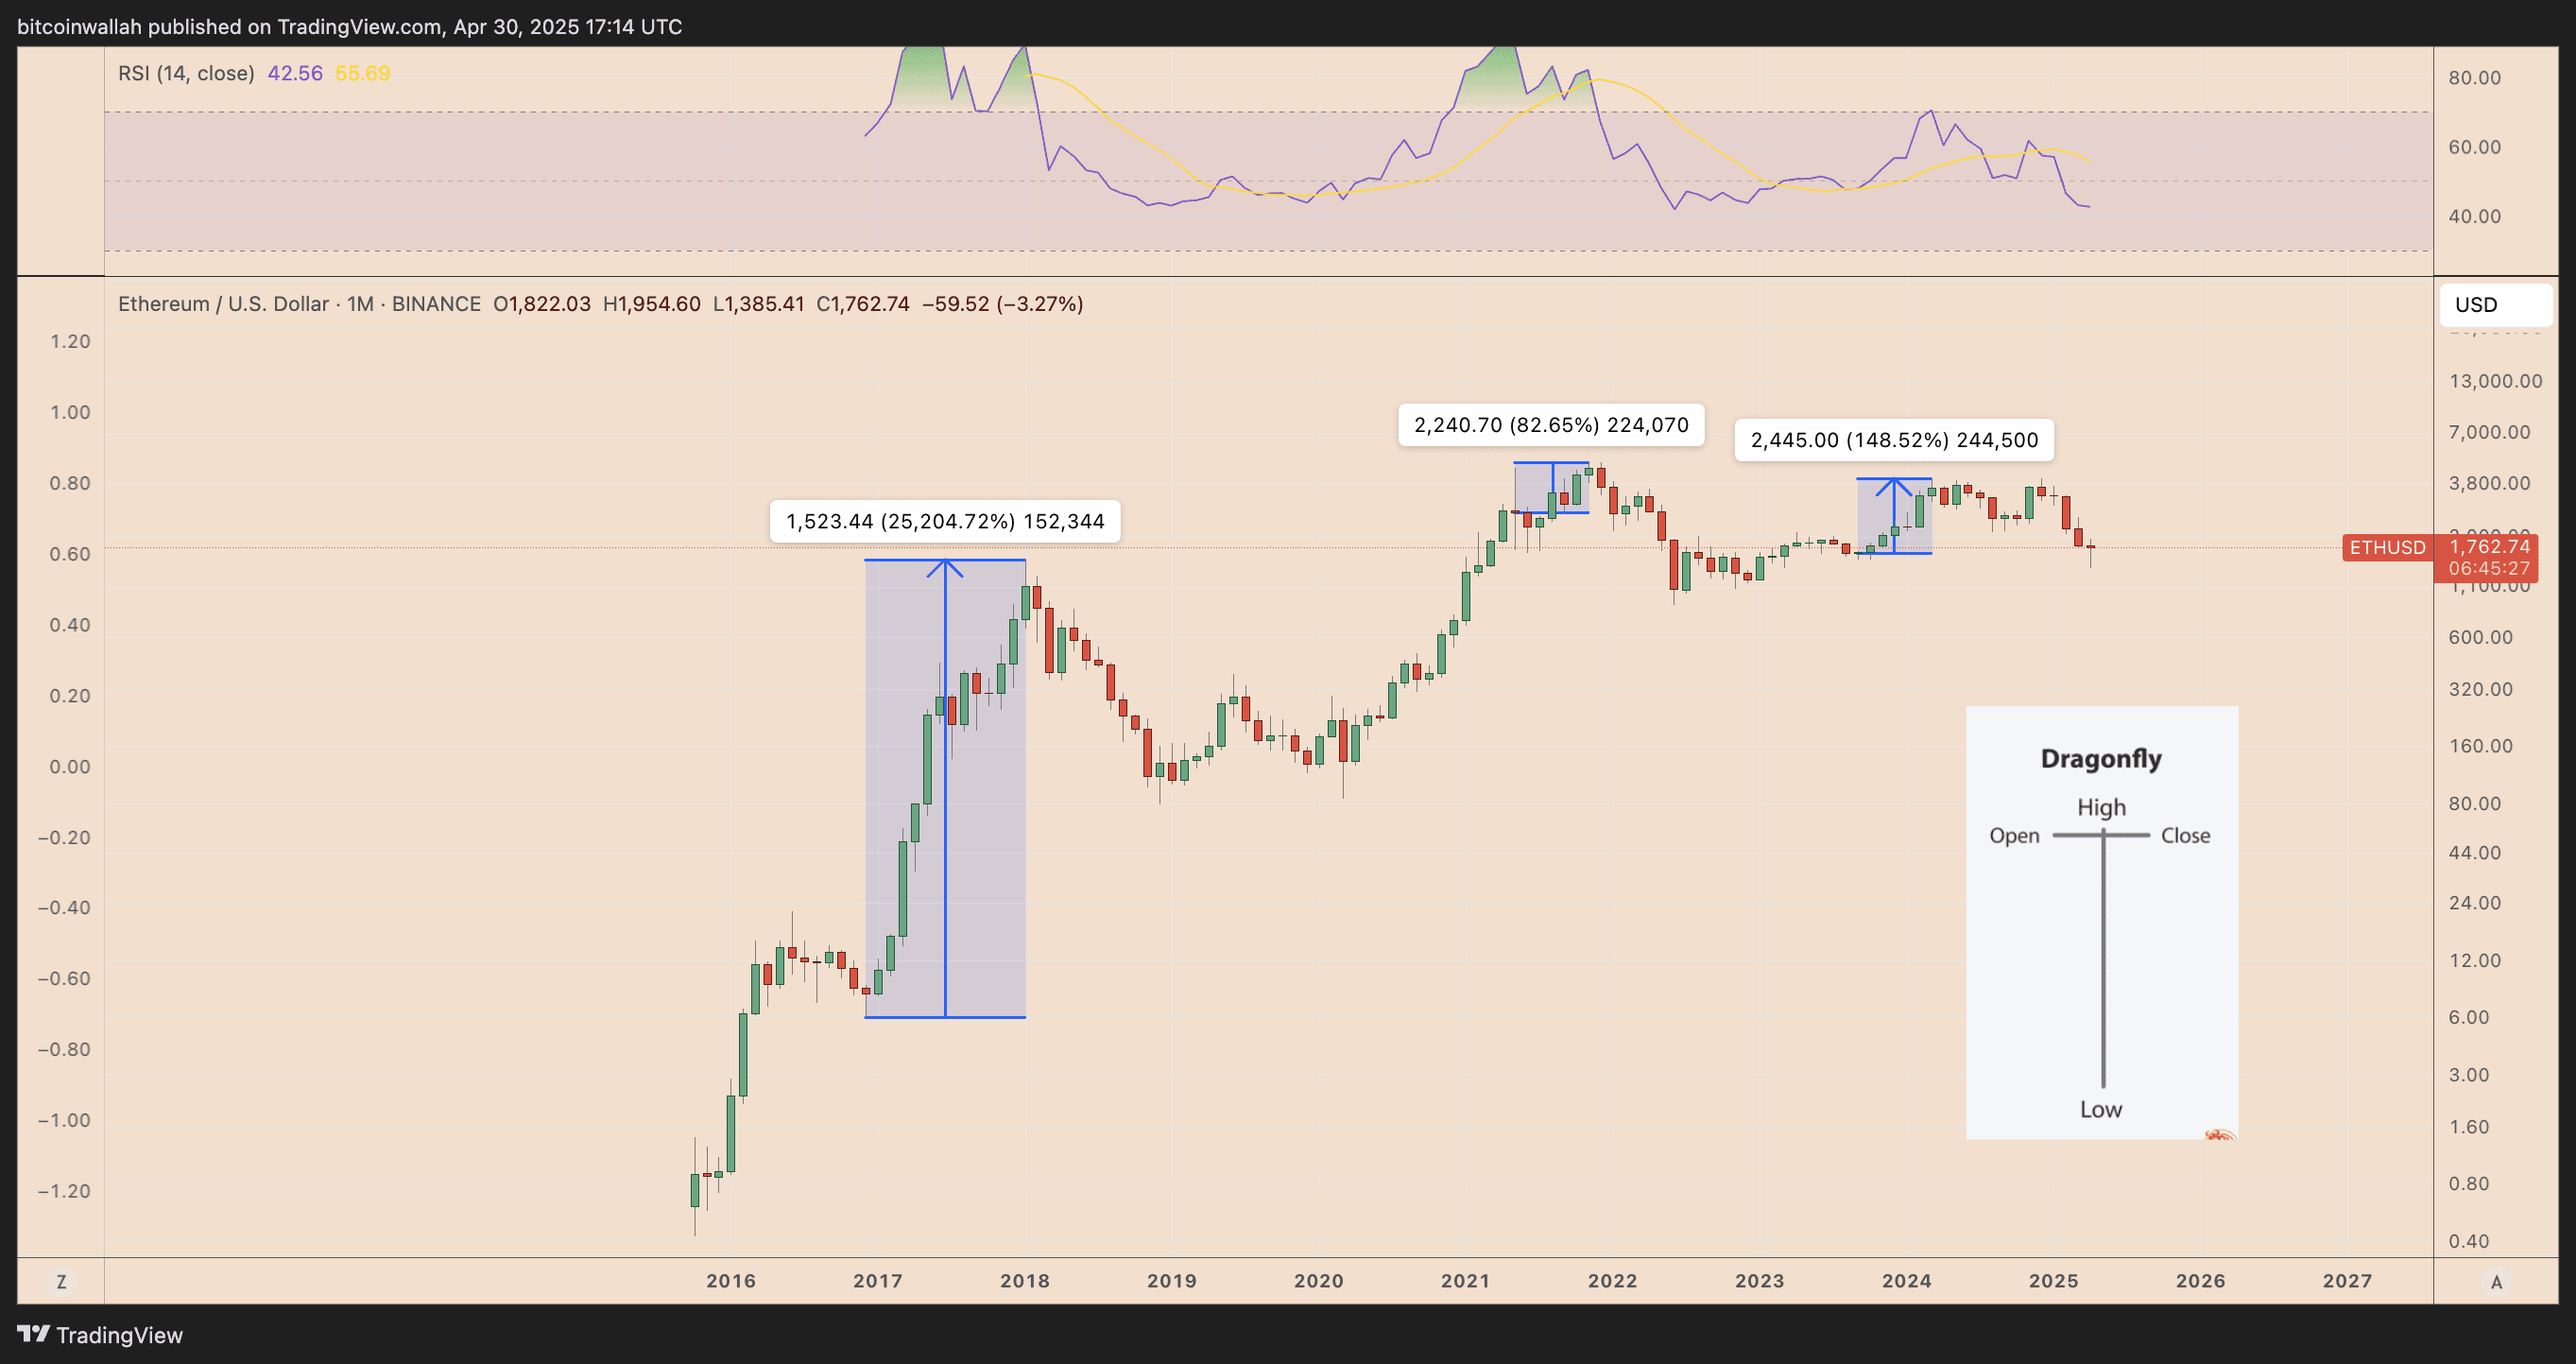
To confirm the bullish signal, a strong May open, particularly above April’s high of around $1,950, is needed. This could pave the way for a multi-month rally, initially targeting the $2,100 level.
Parabolic Support Retest: A Historical Launchpad
Ethereum is currently retesting its long-term parabolic support zone, a trendline that has historically acted as a significant support level. This zone has triggered reversals in past cycles, serving as a launchpad for new uptrends. According to analyst Merlijn the Trader, this retest suggests that Ethereum could be entering its most explosive rally yet.
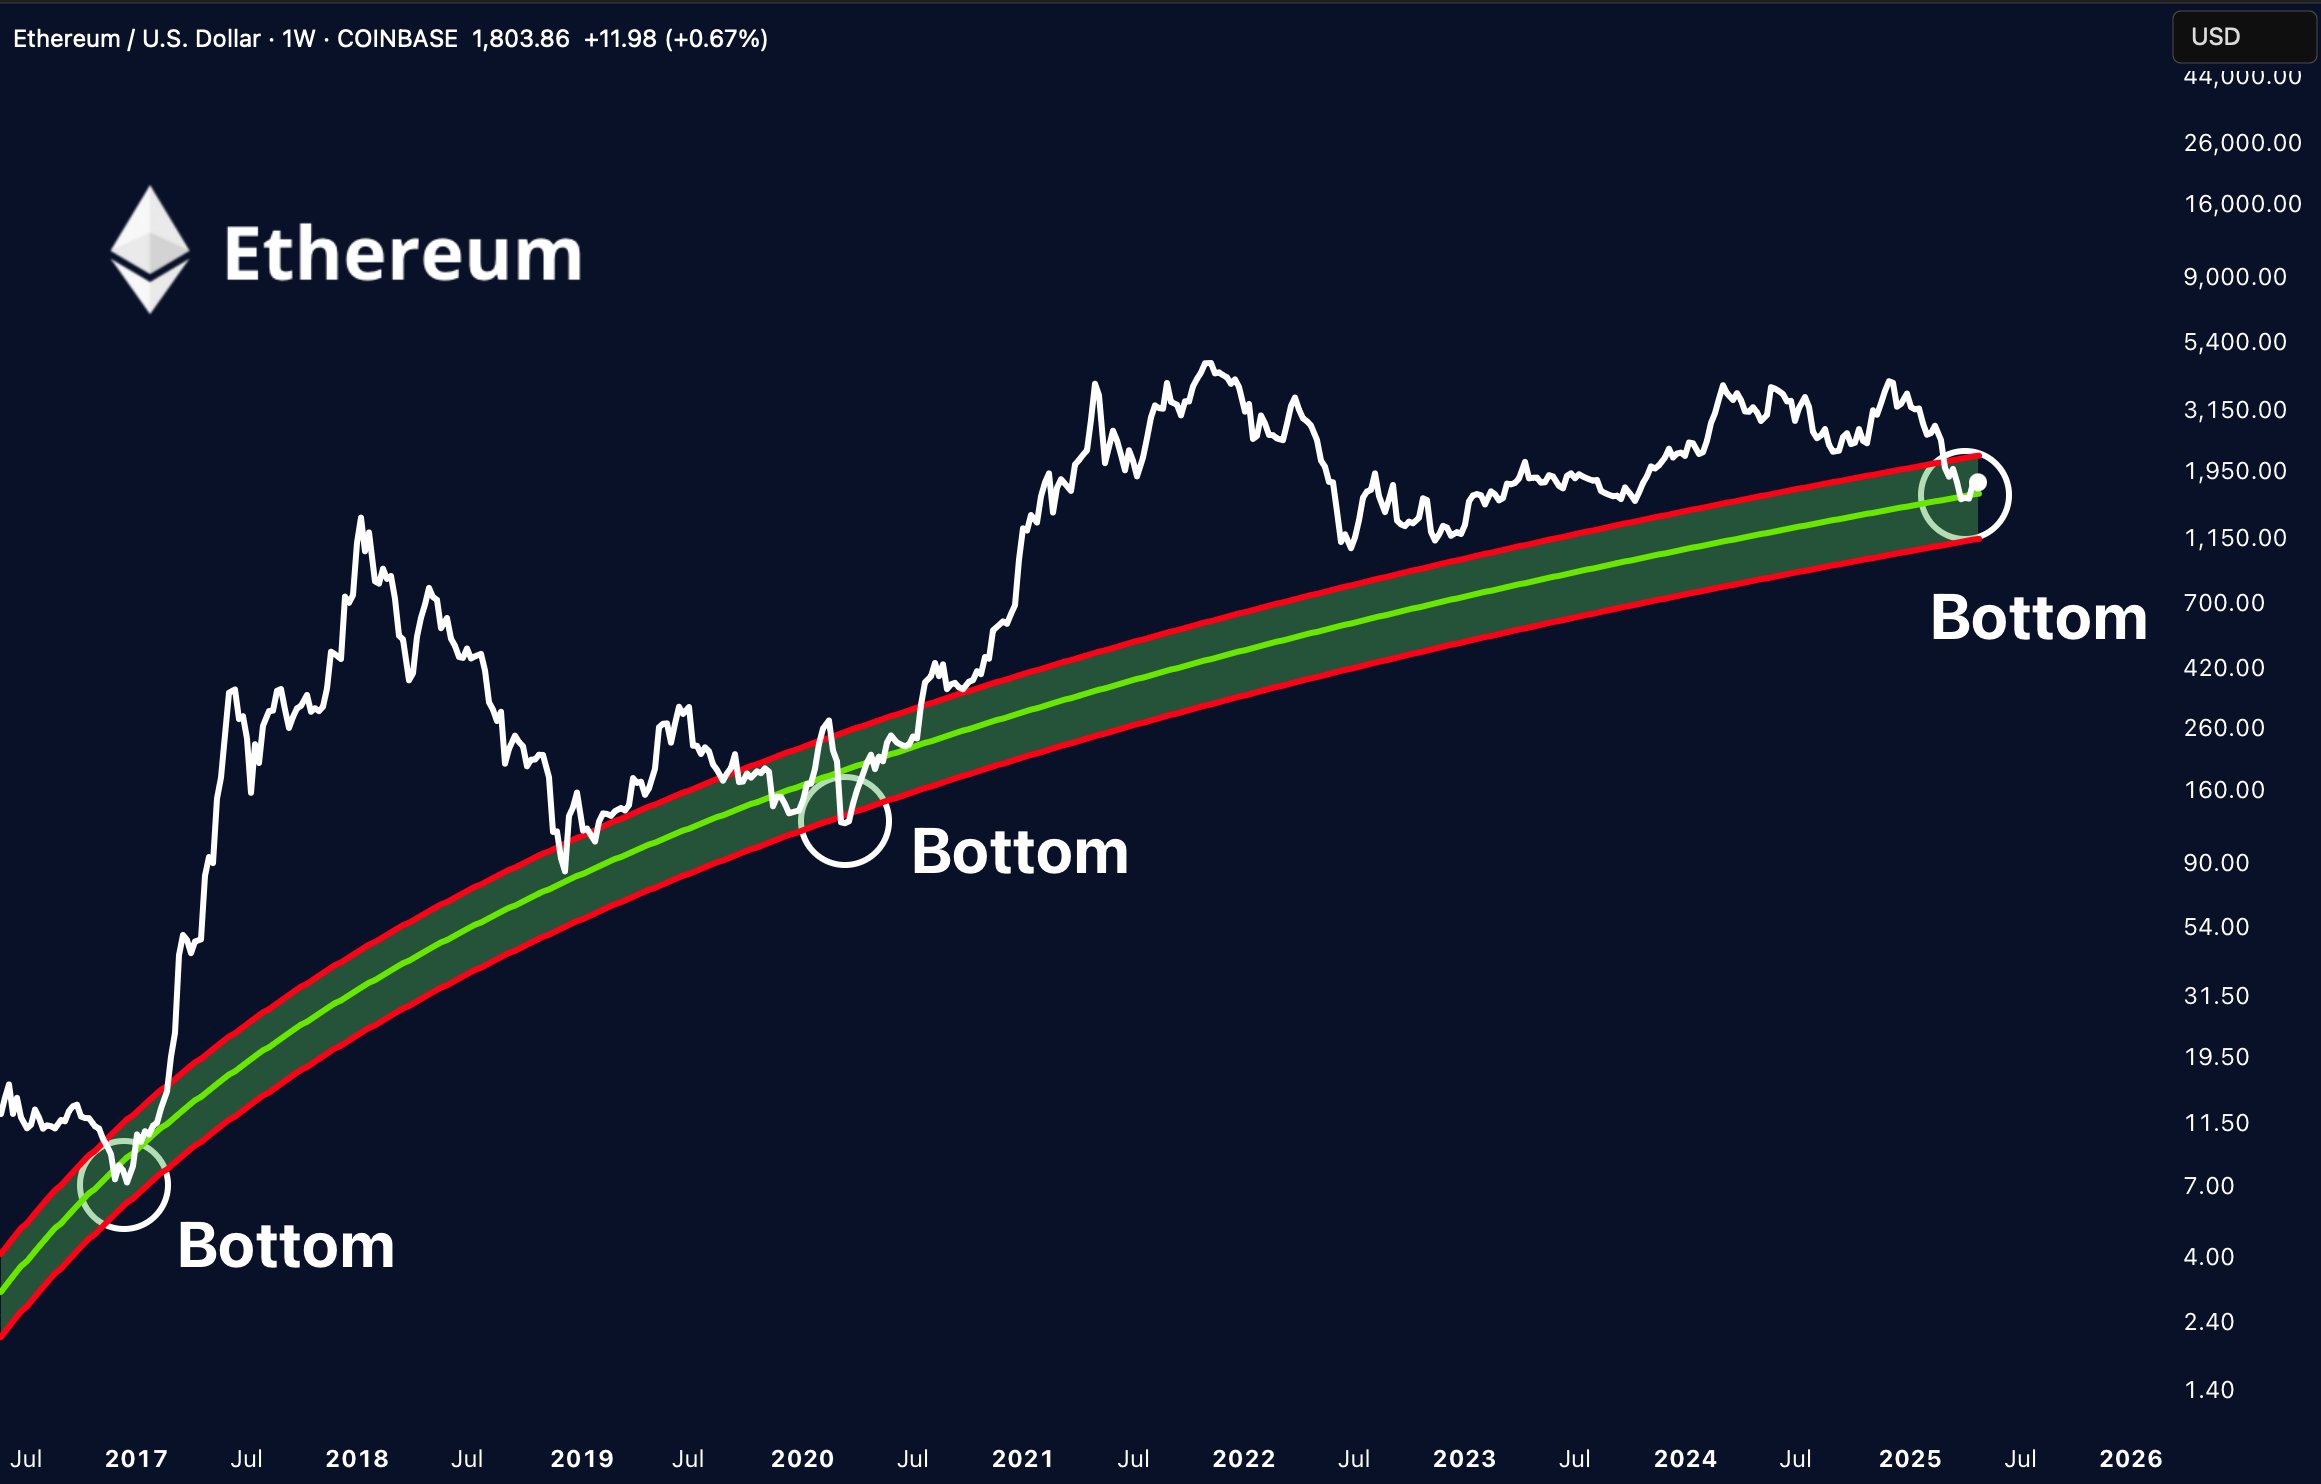
In early 2017, ETH bounced from this same parabolic trendline, fueling its subsequent surge to $1,400. The current retest mirrors that setup, suggesting that history could be repeating itself. This parabolic support provides a crucial level to watch, and a successful hold could confirm the bullish outlook.
MVRV Z-Score: Signaling Undervaluation
The MVRV Z-Score is an on-chain metric used to assess whether an asset is overvalued or undervalued relative to its historical average. The MVRV Z-Score for ETH has re-entered the historical accumulation zone, indicating that the asset is currently undervalued. This zone has historically coincided with market bottoms and preceded significant rallies.
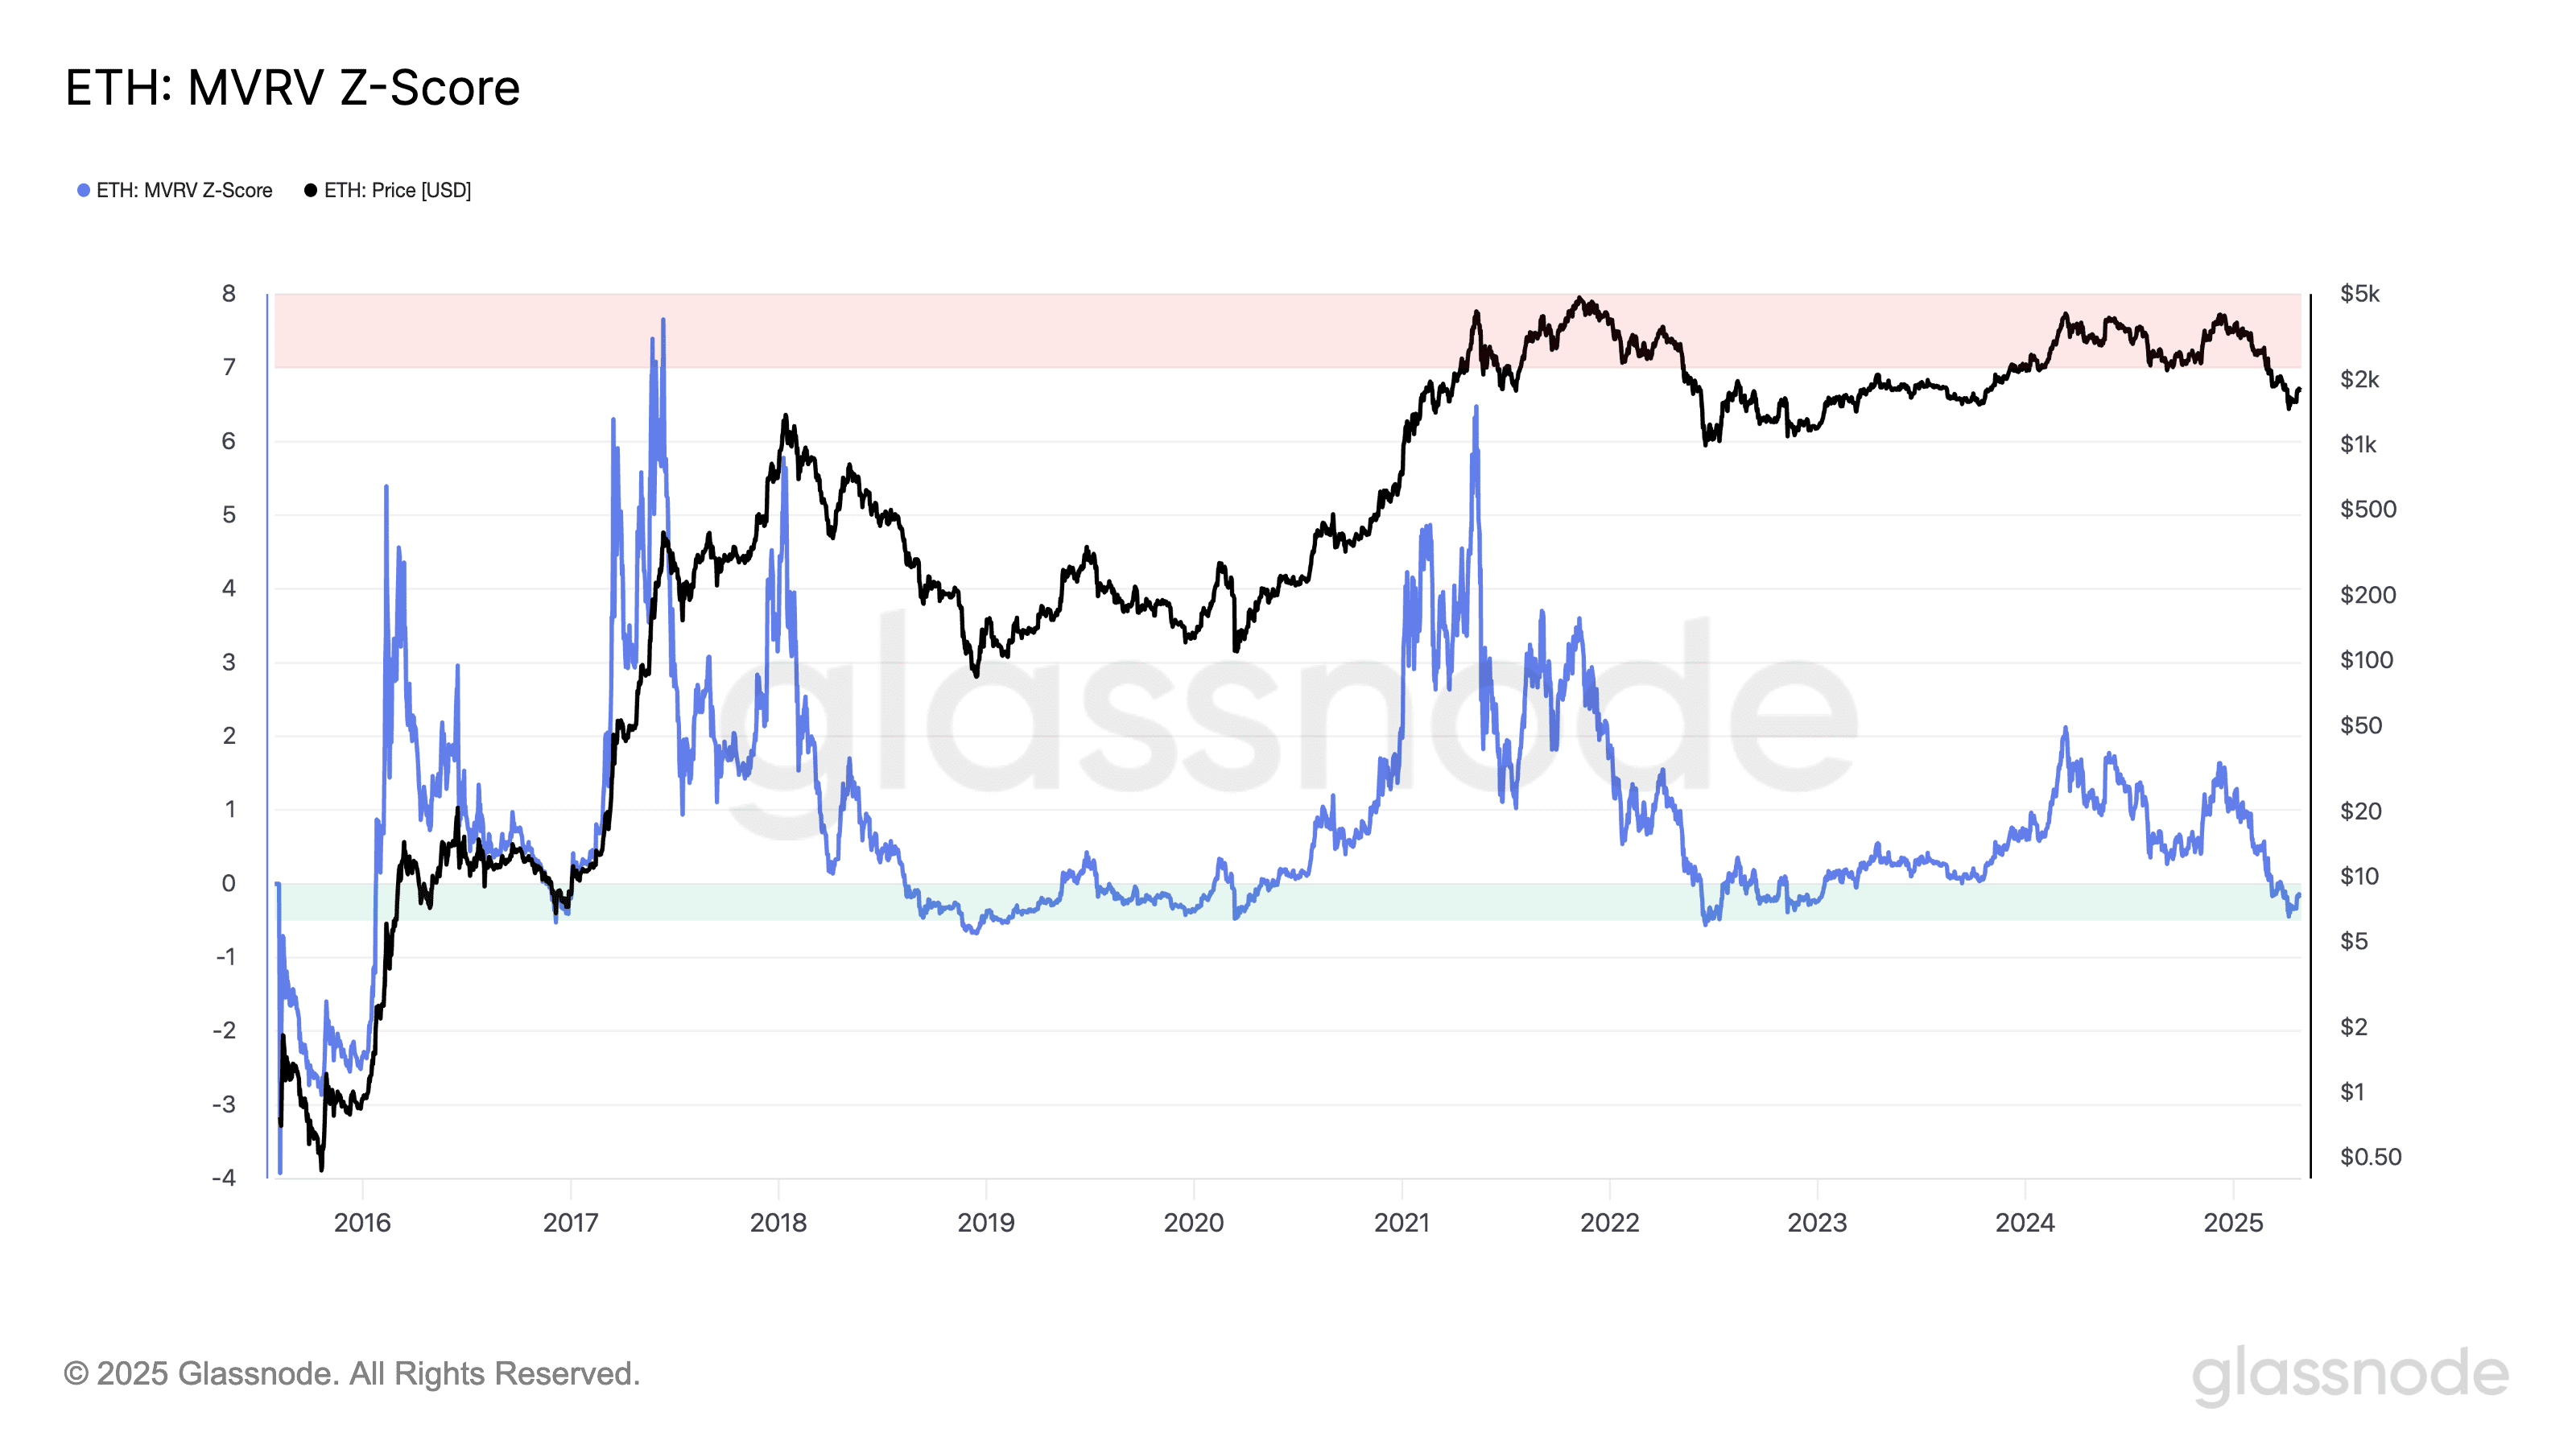
Past cycles show that the MVRV Z-Score dipped into this green zone in late 2018, March 2020, and mid-2022, all periods that marked significant buying opportunities. The current entry into this zone further strengthens the argument that ETH may have found its cycle bottom.
Additional Factors Supporting a Potential Rally
Beyond the technical and on-chain indicators mentioned above, several other factors could contribute to a potential Ethereum rally:
- Ethereum Ecosystem Growth: The continued development and adoption of decentralized applications (dApps), DeFi protocols, and NFTs on the Ethereum network are driving demand for ETH.
- Ethereum 2.0 Upgrade: The successful transition to a proof-of-stake (PoS) consensus mechanism (Ethereum 2.0) has reduced energy consumption and improved network scalability.
- Institutional Interest: Increasing institutional interest in cryptocurrencies, including Ethereum, is bringing more capital into the market.
Conclusion
Ethereum’s current price action is presenting a compelling case for a potential rally. The combination of a Dragonfly Doji candlestick, a retest of parabolic support, and an MVRV Z-Score in the accumulation zone paints a bullish picture. While market conditions can change rapidly, these indicators suggest that Ethereum could be poised for significant upside in the coming months. Investors should conduct thorough research and consider their own risk tolerance before making any investment decisions.
This article does not contain investment advice or recommendations. Every investment and trading move involves risk, and readers should conduct their own research when making a decision.