Solana (SOL) has experienced a significant surge, mirroring Bitcoin’s rally. This article examines the factors influencing SOL’s price and its potential to reach $300.
Key Factors Driving Solana’s Price:
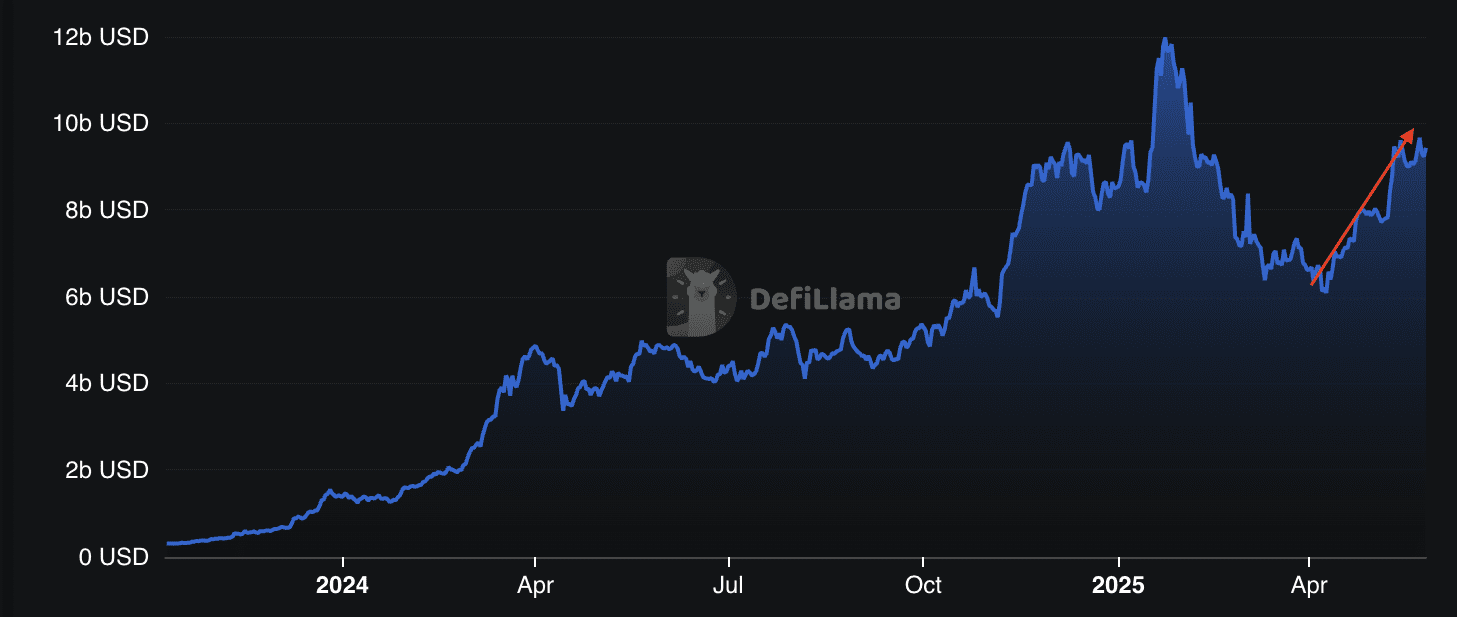
- TVL Growth: Solana’s Total Value Locked (TVL) has increased significantly, reflecting growing confidence and investment in the platform.
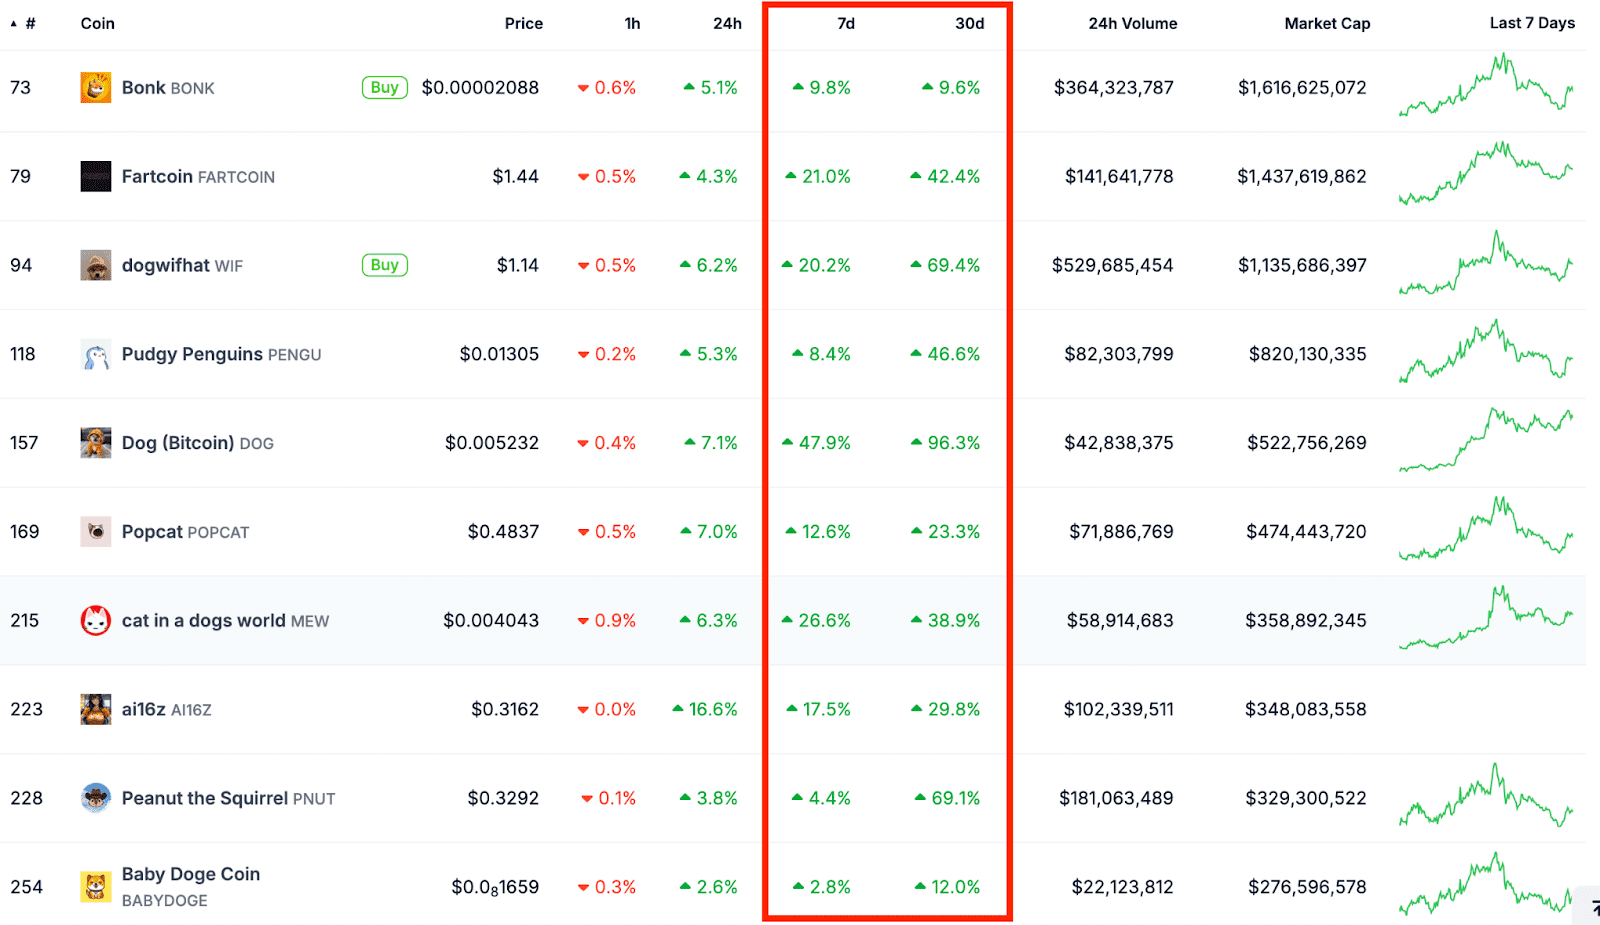
- Memecoin Market Surge: The rising popularity and market capitalization of Solana-based memecoins indicate increased network activity and user engagement.
- Bullish Chart Pattern: A V-shaped recovery pattern suggests a potential price target of $300 for SOL.
Solana’s TVL Increase: A Sign of Network Health
Since April 7, Solana’s TVL has surged by 54% to $9.4 billion, signaling increased activity on the blockchain. This growth is primarily driven by decentralized applications (dApps) like Raydium, Jupiter DEX, Jito liquid staking, and Kamino Lending.
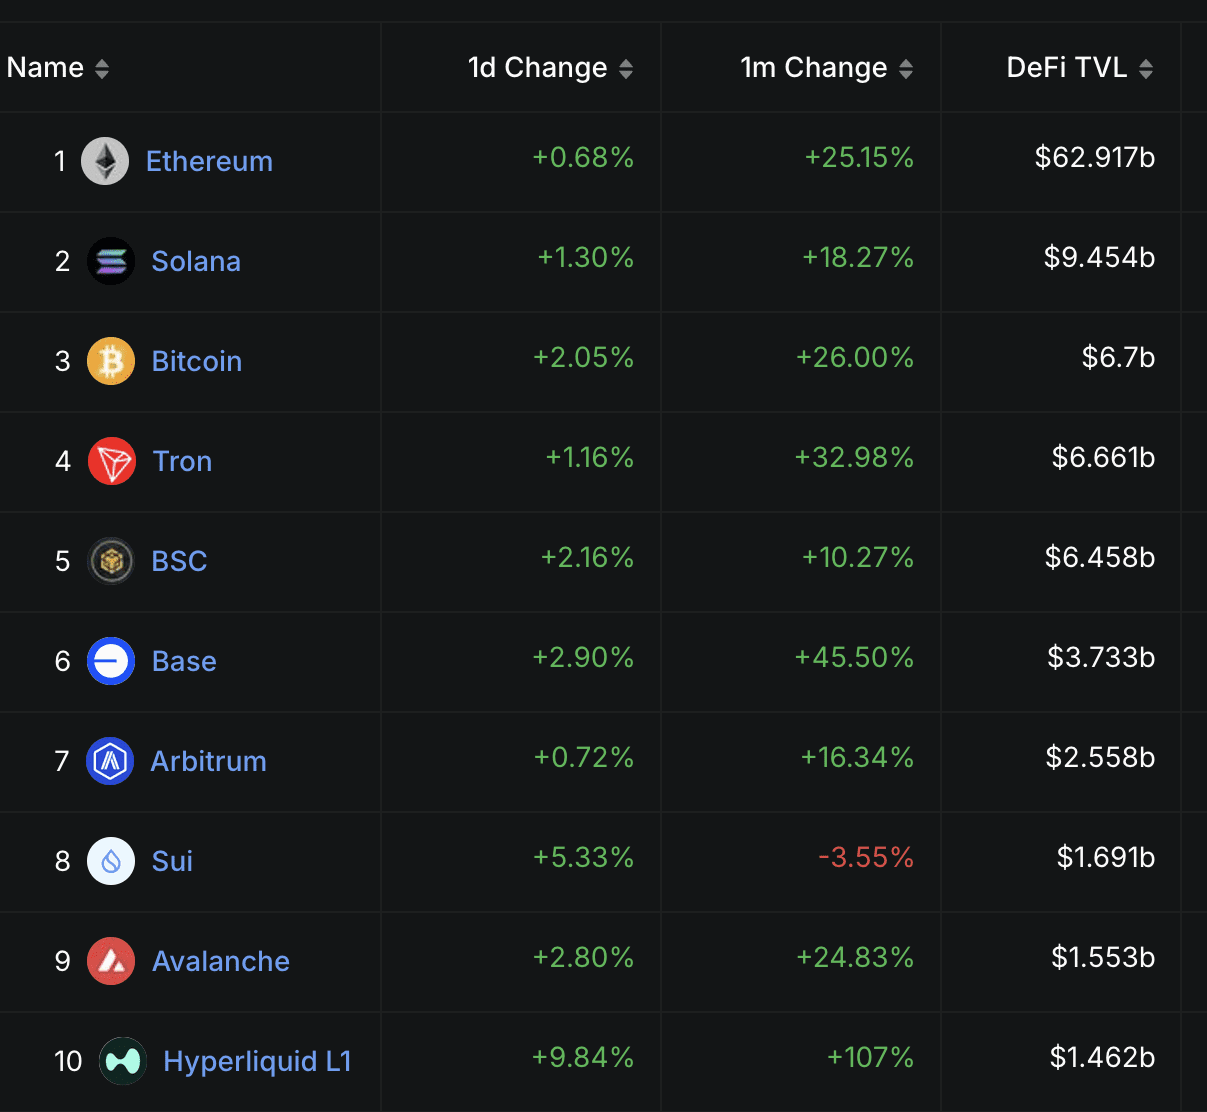
Solana’s TVL surpasses that of Ethereum layer-2 ecosystems and BNB Chain, highlighting its prominent position in the blockchain landscape. The increase in TVL points to growing confidence in Solana’s ecosystem and its ability to attract and retain users.
Memecoin Mania: Boosting Solana’s Network Activity
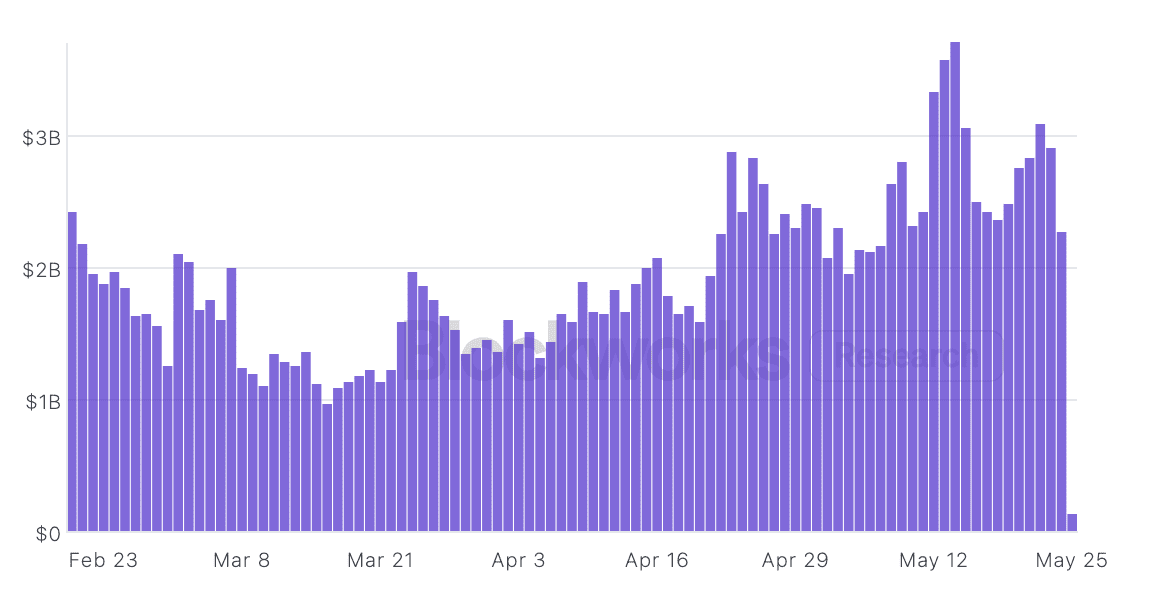
The memecoin market on Solana has experienced substantial growth, with the collective market cap increasing by 65% from April 8 to May 26. This memecoin mania has significantly boosted network activity, with daily trading volumes more than doubling since early April. This increased activity positively impacts demand for SOL, potentially driving its price higher.
However, it is important to note that while memecoins contribute to network activity, they also carry significant risk. Investors should exercise caution and conduct thorough research before investing in memecoins.
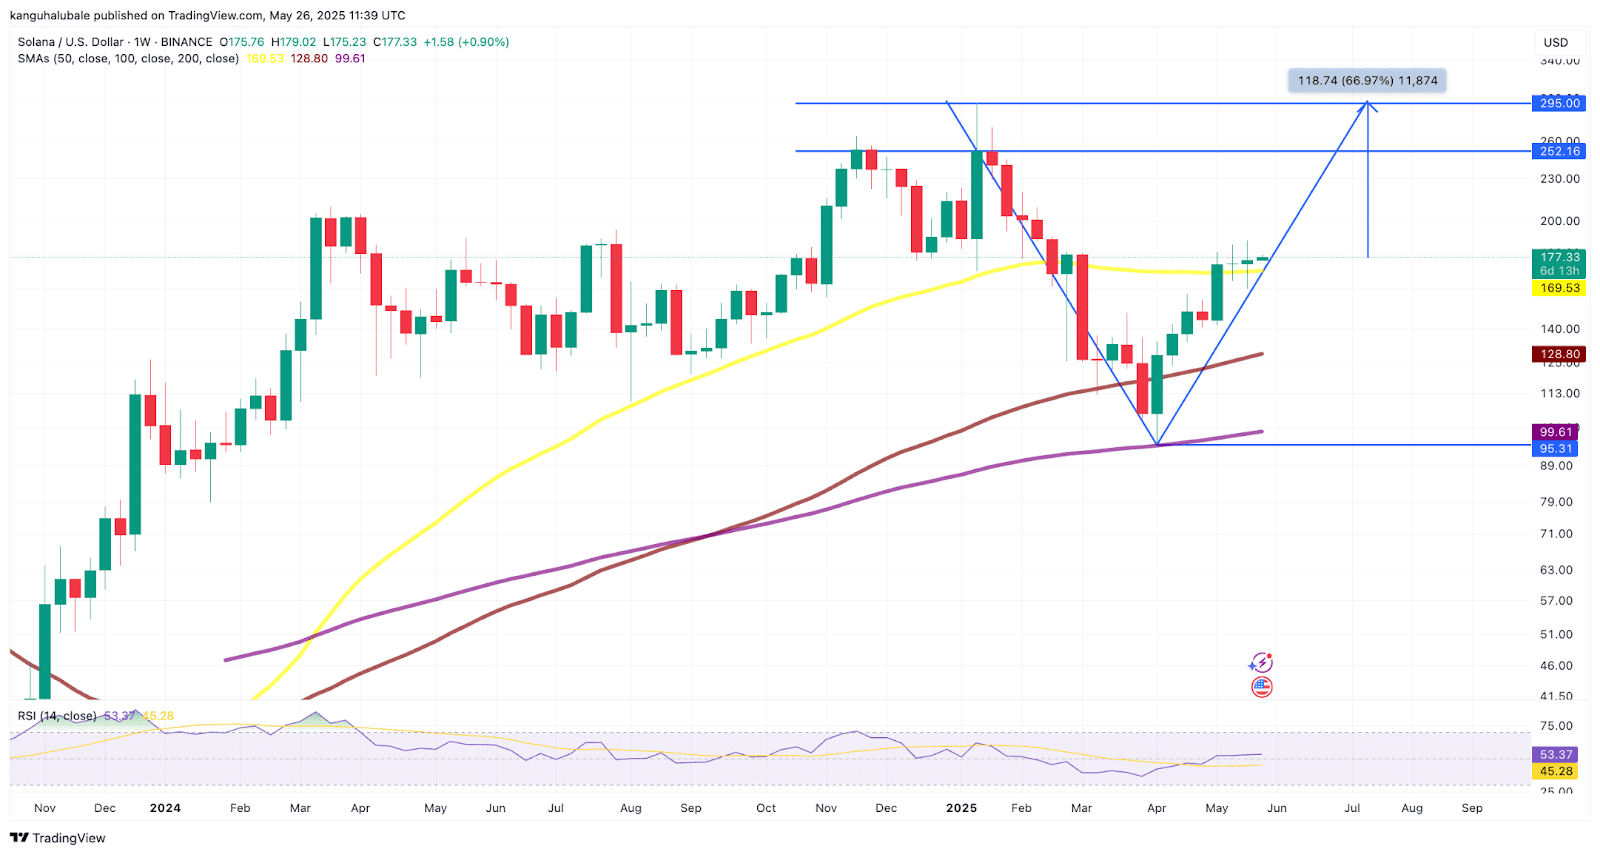
Technical Analysis: V-Shaped Recovery Pattern
SOL’s price chart displays a V-shaped recovery pattern, a bullish signal indicating a potential for further price increases. If SOL breaks above the supply-demand zone between $180 and $200, it could rise to the neckline at $252, completing the V-shaped pattern. A successful breakout could then propel SOL towards its all-time high above $295, representing a 66% increase from its current price.
Expert Opinions and Predictions
Analysts predict a potential 45% increase in SOL’s price if it breaks above $180. The relative strength index (RSI) has also increased, indicating growing bullish momentum.
Factors to Consider
- Market Volatility: The cryptocurrency market is inherently volatile, and sudden price swings can occur.
- Regulatory Developments: Changes in regulations can impact the price of cryptocurrencies.
- Overall Market Sentiment: The overall sentiment of the cryptocurrency market can influence the price of SOL.
Conclusion: Will SOL Reach $300?
Solana’s increasing TVL, surging memecoin market cap, and bullish chart patterns suggest a potential for SOL to reach $300. However, investors should consider market volatility, regulatory developments, and overall market sentiment before making investment decisions.
Disclaimer: This analysis is for informational purposes only and does not constitute financial advice. Cryptocurrency investments carry risk, and investors should conduct their own research before making any decisions.