Key Points:
- XRP’s price increased by 4% to $2.43, accompanied by a 25% surge in open interest.
- Positive spot market sentiment has flipped the futures funding rate, indicating renewed investor optimism.
- A confirmed bull flag pattern on the weekly chart could propel XRP towards a $14 target.
XRP is showing strong bullish signals, primarily driven by a ‘bull flag’ pattern forming on its weekly price chart. This pattern, combined with increasing open interest (OI), suggests the potential for a significant price rally.
XRP’s Open Interest and Price Correlation
On May 22, XRP’s price moved in tandem with the broader crypto market, fueled by Bitcoin’s rally to new highs. This positive momentum saw XRP gain 5.5%, reaching an intraday high of $2.45.
Notably, XRP’s open interest (OI) experienced a substantial increase, climbing 25% to $4.95 billion. This increase in OI suggests a renewed interest from derivatives traders and an influx of capital into the XRP market.
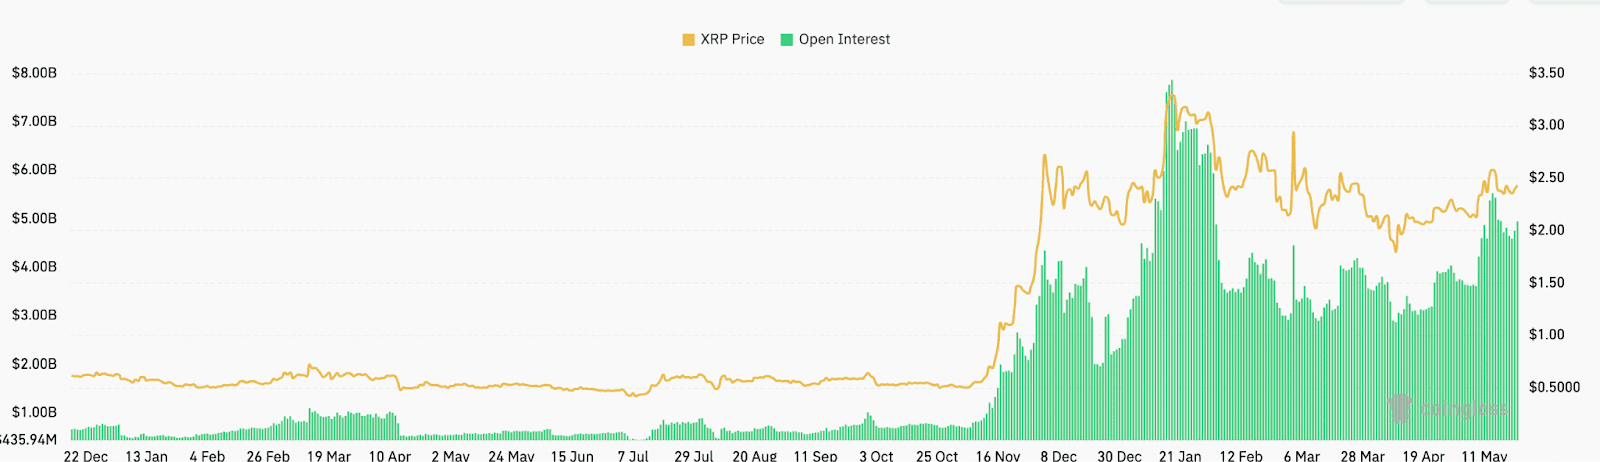
Historically, significant jumps in OI have often preceded major price rallies for XRP. A similar scenario occurred when US President Trump directed the creation of a crypto strategic reserve to include XRP, Solana (SOL), and Cardano’s ADA in early March, leading to a 46% jump in OI. This was accompanied by a 36% rise in XRP price.
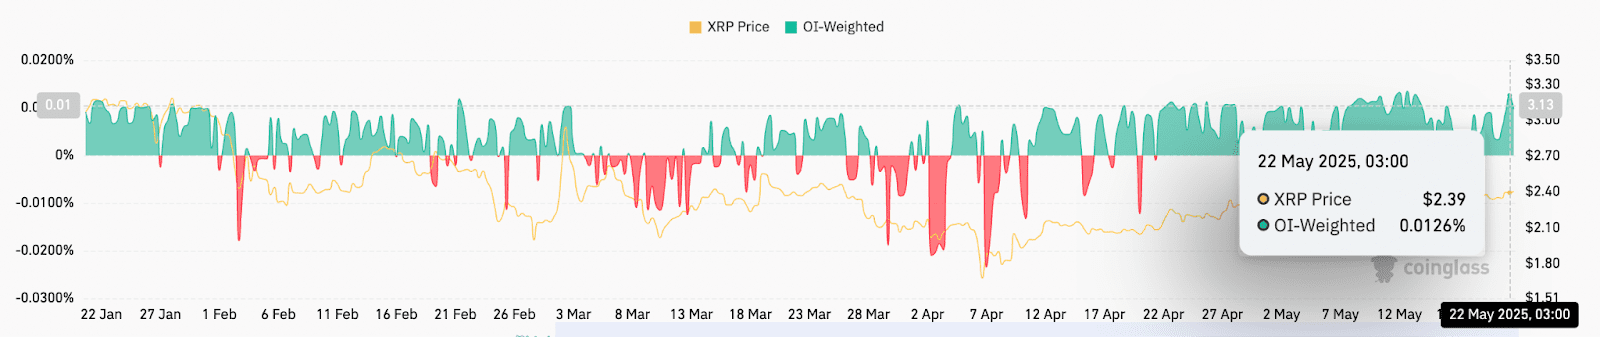
Currently, XRP’s 8-hour perpetual contracts funding rate stands at 0.0126%, a significant improvement from previous weeks. This positive funding rate further reinforces the bullish sentiment among derivatives traders.
Bull Flag Pattern and $14 Target
The XRP/USD pair is exhibiting a classic bull flag pattern on its weekly chart, a technical formation that often signals the continuation of an upward trend. This pattern has been forming since November 5, 2025.
A decisive weekly candlestick close above the flag’s upper boundary at $2.48 would likely trigger another rally. The target for this rally is determined by the flagpole’s height, which projects a potential increase to around $14.50, representing an approximate 500% increase from the current price.
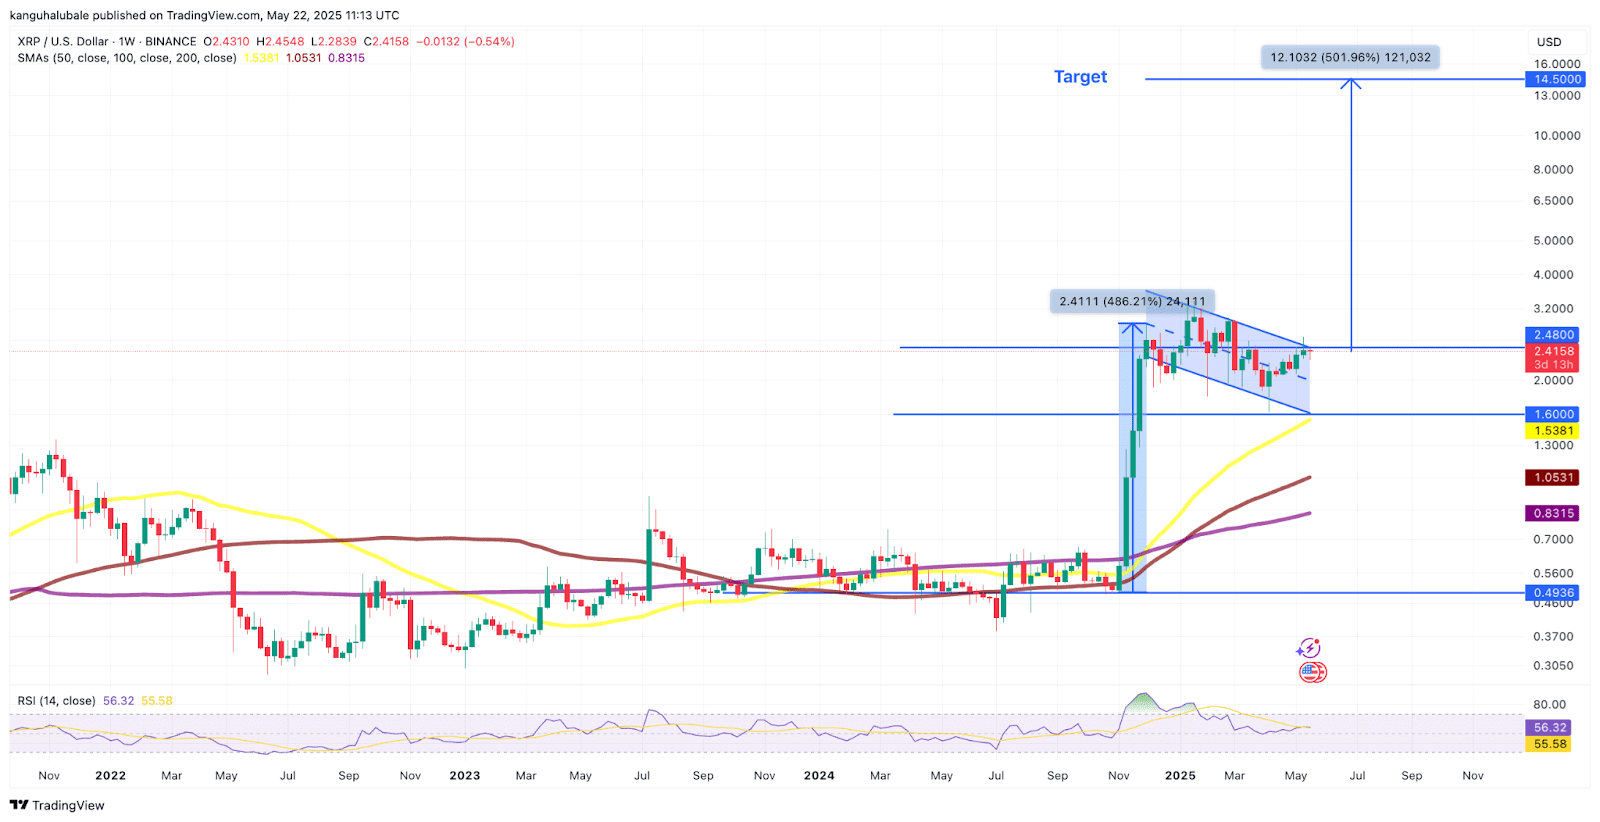
Adding to the bullish outlook is the support provided by the simple moving averages (SMA) on the daily timeframe, currently positioned between $2.20 and $2.30. The relative strength index (RSI) is also resetting just above the 50 mark, suggesting room for further upward momentum.
Several analysts have also predicted further gains for XRP, citing favorable chart technicals and the price’s ability to hold above key support levels.
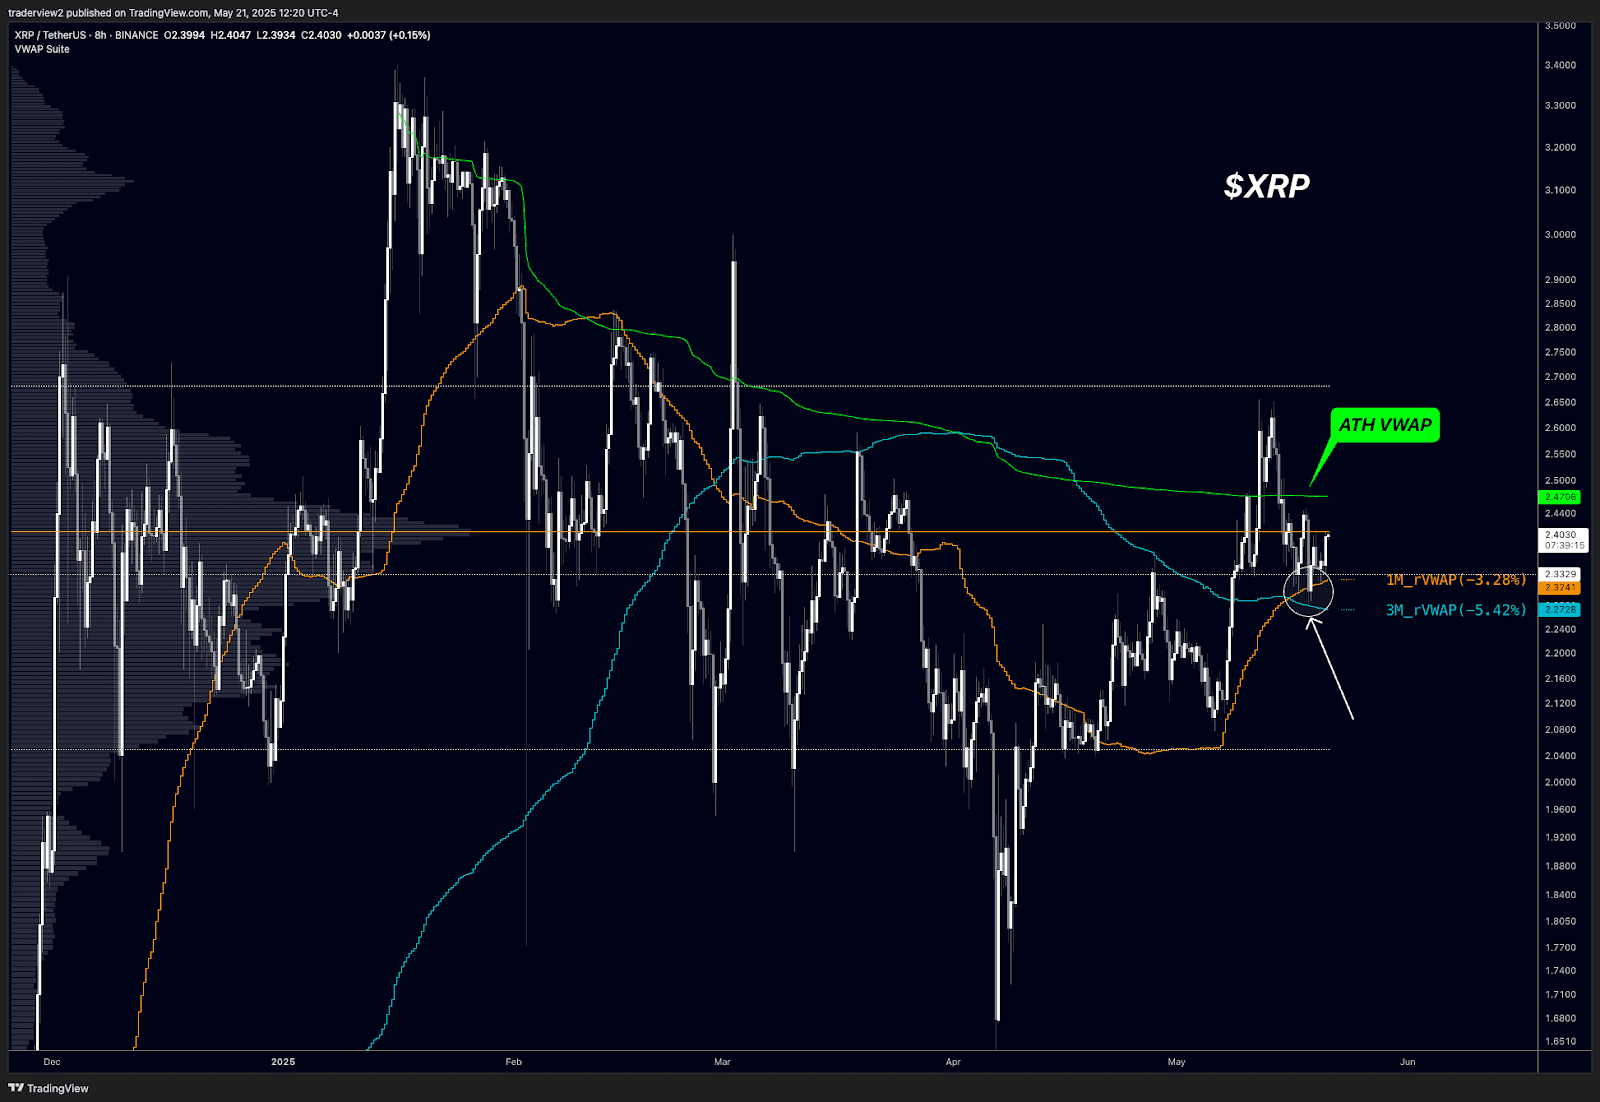
Market analyst Dom highlighted that XRP has maintained its position above the monthly and quarterly volume-weighted average prices (VWAPs) of $2.32 and $2.27, respectively. He emphasized the importance of XRP flipping the all-time high VWAP at $2.47 to sustain its bullish trajectory.
“The trigger for a leg up will be clearing the ATH VWAP (green). Watching closely for bulls to make this happen shortly.”
Based on symmetrical triangle targets and Fibonacci projections, XRP’s price could potentially range between $5.24 and $17 in 2025.
Disclaimer: This analysis is for informational purposes only and should not be considered financial advice. Cryptocurrency investments involve risk, and you should conduct thorough research before making any investment decisions.