Key Takeaways:
- Over 70% of XRP’s realized cap was accumulated near recent highs, mirroring past market top formations.
- XRP’s active address count has plummeted over 90% since March 2025, indicating reduced transactional demand.
- A falling wedge pattern suggests a potential 25% drop towards the $1.76 support level.
XRP has experienced a significant rally since late 2024, but emerging on-chain data and technical patterns suggest this surge may be losing momentum. This analysis delves into these indicators, exploring the potential for a market correction.
Is XRP Forming a Market Top?
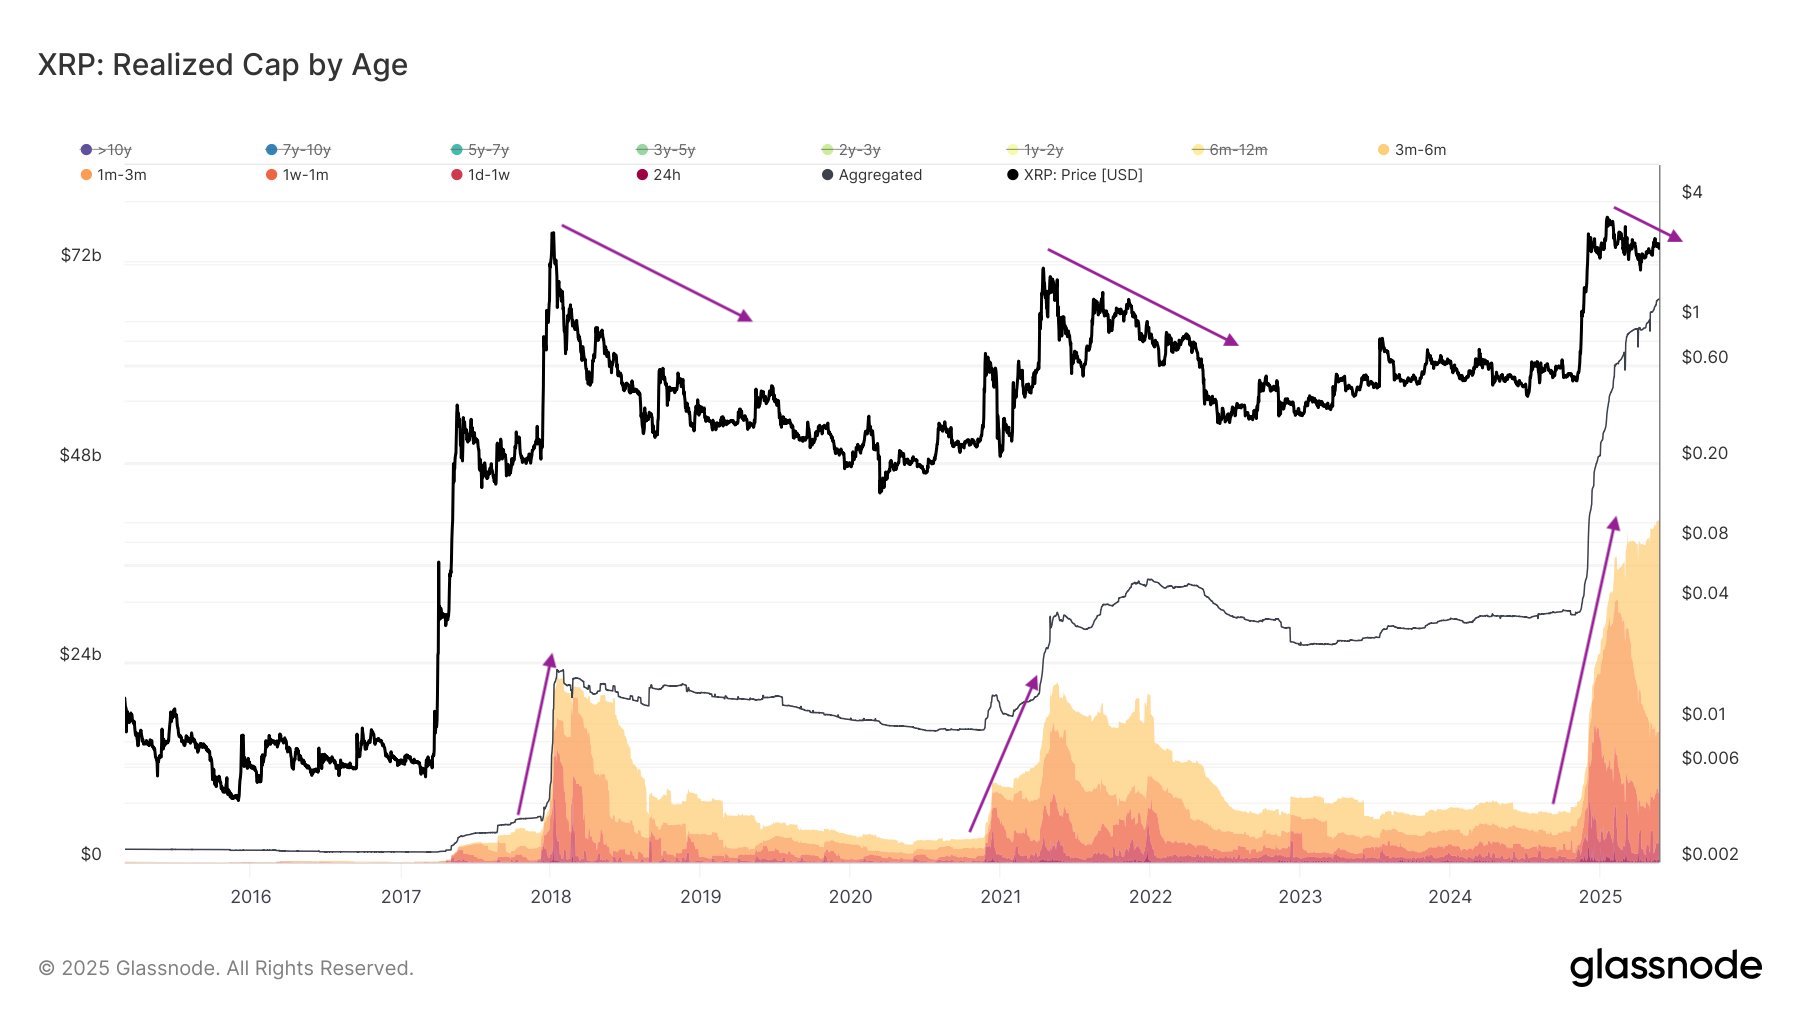
According to Glassnode data, a substantial portion (over 70%) of XRP’s realized market capitalization—representing XRP’s value based on the price when each token was last moved—accumulated between late 2024 and early 2025. This concentration of recent investment near the top is a cause for concern.
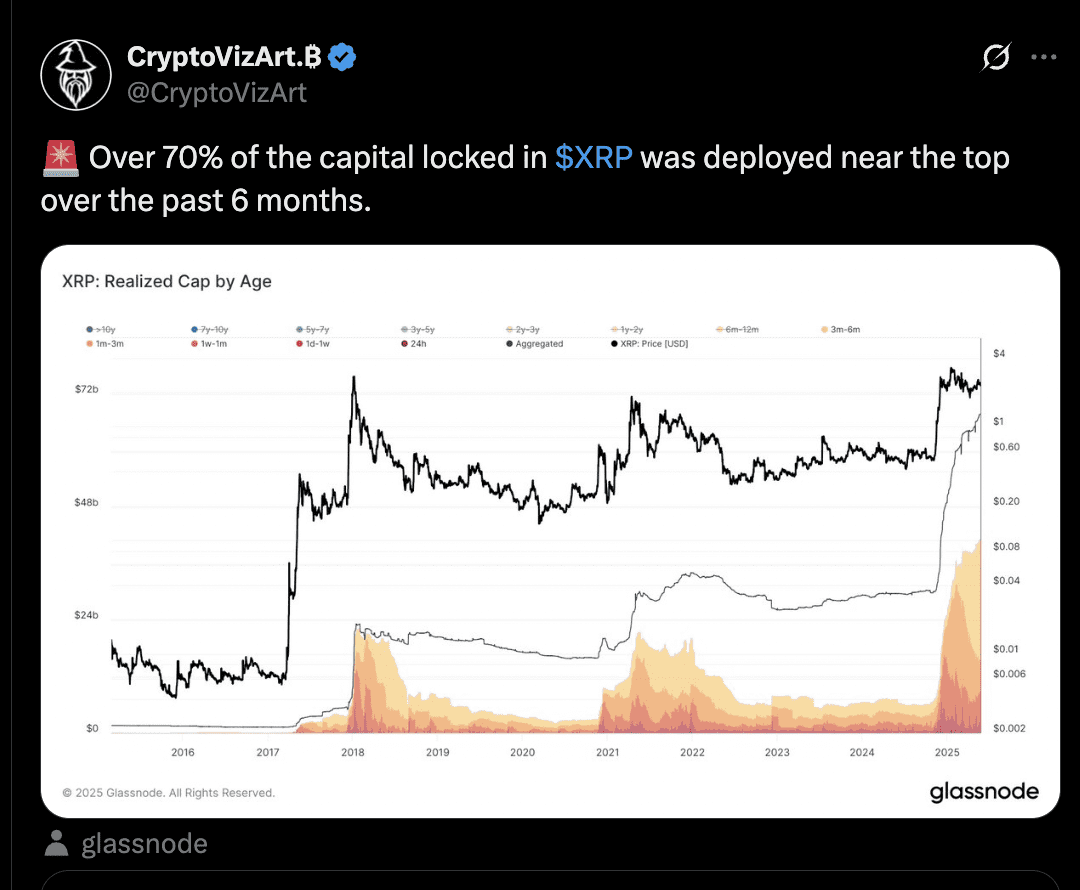
The realized cap of XRP held for 3-6 months has increased sharply, especially after January 2025 when XRP peaked around $3.40. Historically, this top-heavy structure can be fragile, as newer investors are often more sensitive to price fluctuations and prone to sell during corrections. This pattern echoes previous market cycles, such as late 2017 and 2021, where similar capital influxes preceded significant price declines.
Historical Parallels:
- Late 2017: A massive capital influx before XRP peaked near $3.55, followed by a 95% drawdown.
- 2021: Another sharp rise in realized cap by short-term holders preceded an almost 80% decline.
These historical parallels raise the possibility that XRP formed a local top in January 2025 and may continue its decline in the coming months.
Decline in Network Activity
Another worrying trend is the significant drop in XRP’s active address count. After a sharp spike in March 2025, active addresses have decreased by over 90%, returning to levels seen before the breakout. This divergence between price and on-chain activity can indicate a potential market top.
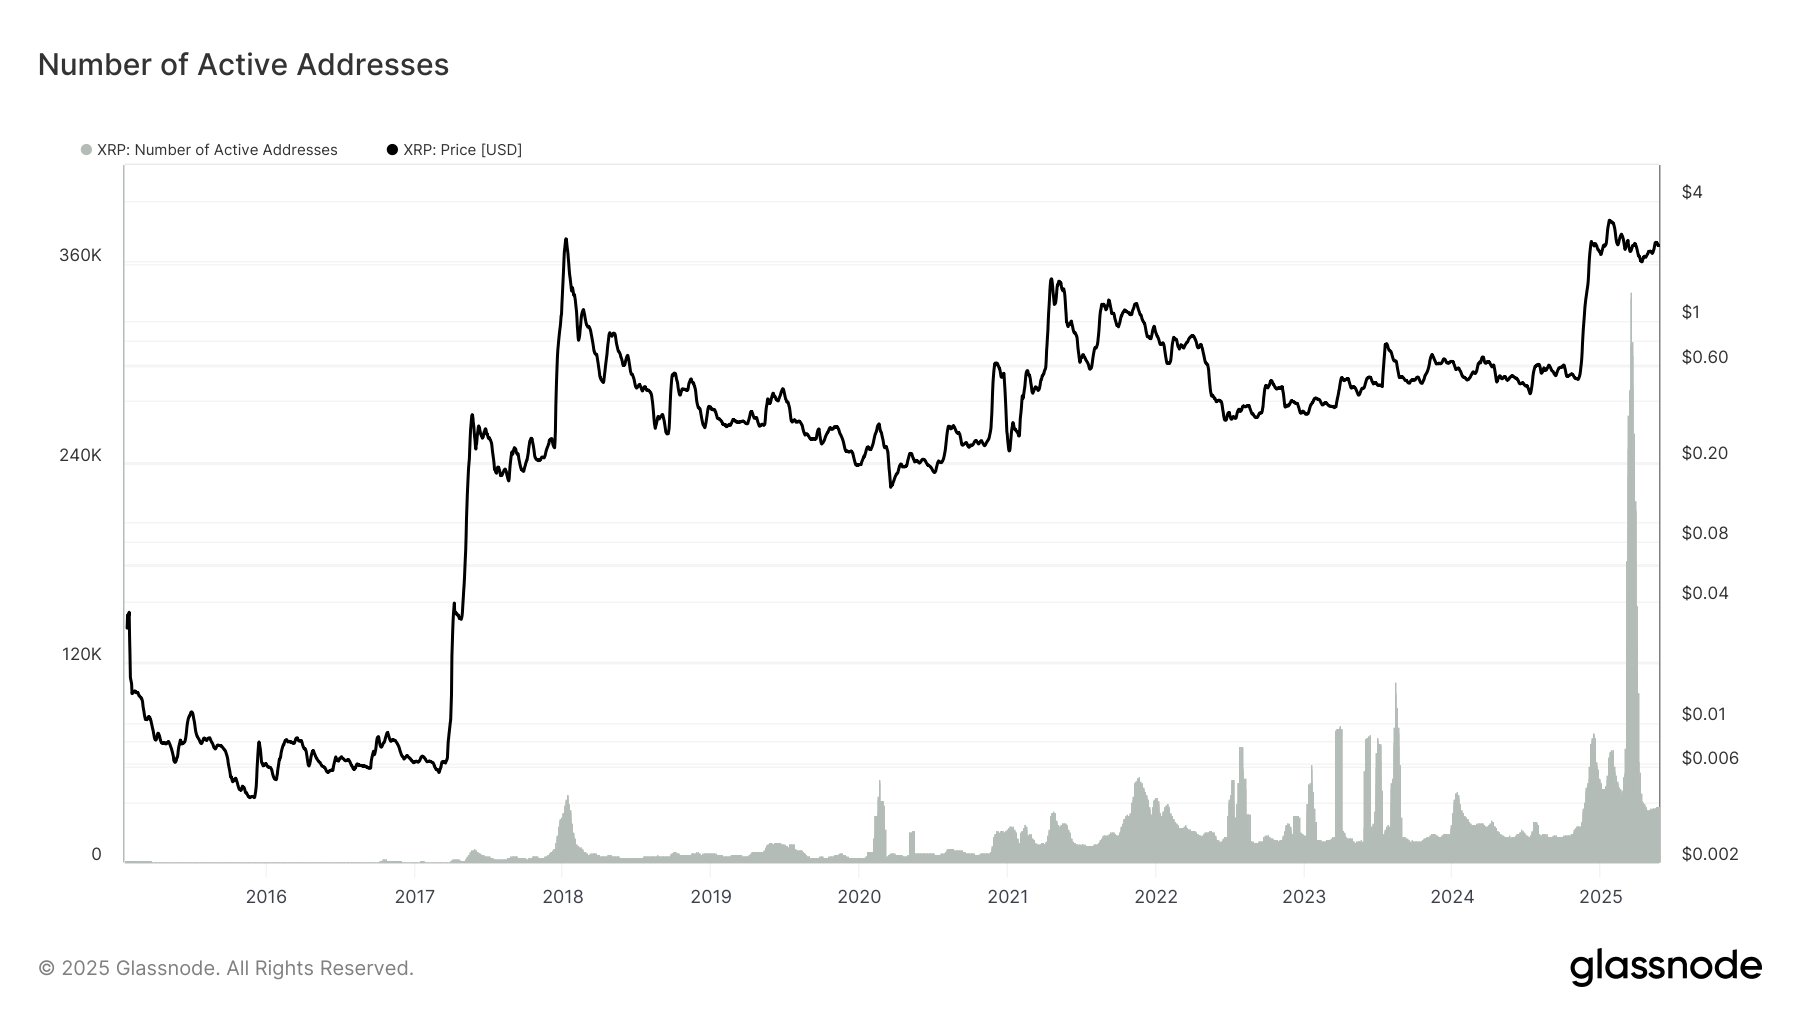
A falling number of active addresses suggests reduced real-world use and increased holding. This could mean fewer people are using XRP for transactions, raising concerns about the long-term sustainability of the price.
Technical Analysis: Falling Wedge Pattern
XRP’s weekly chart reveals a consolidating falling wedge pattern, a bearish signal. As of May 26, there were signs of a short-term correction cycle after failing to break above the wedge’s upper trendline.
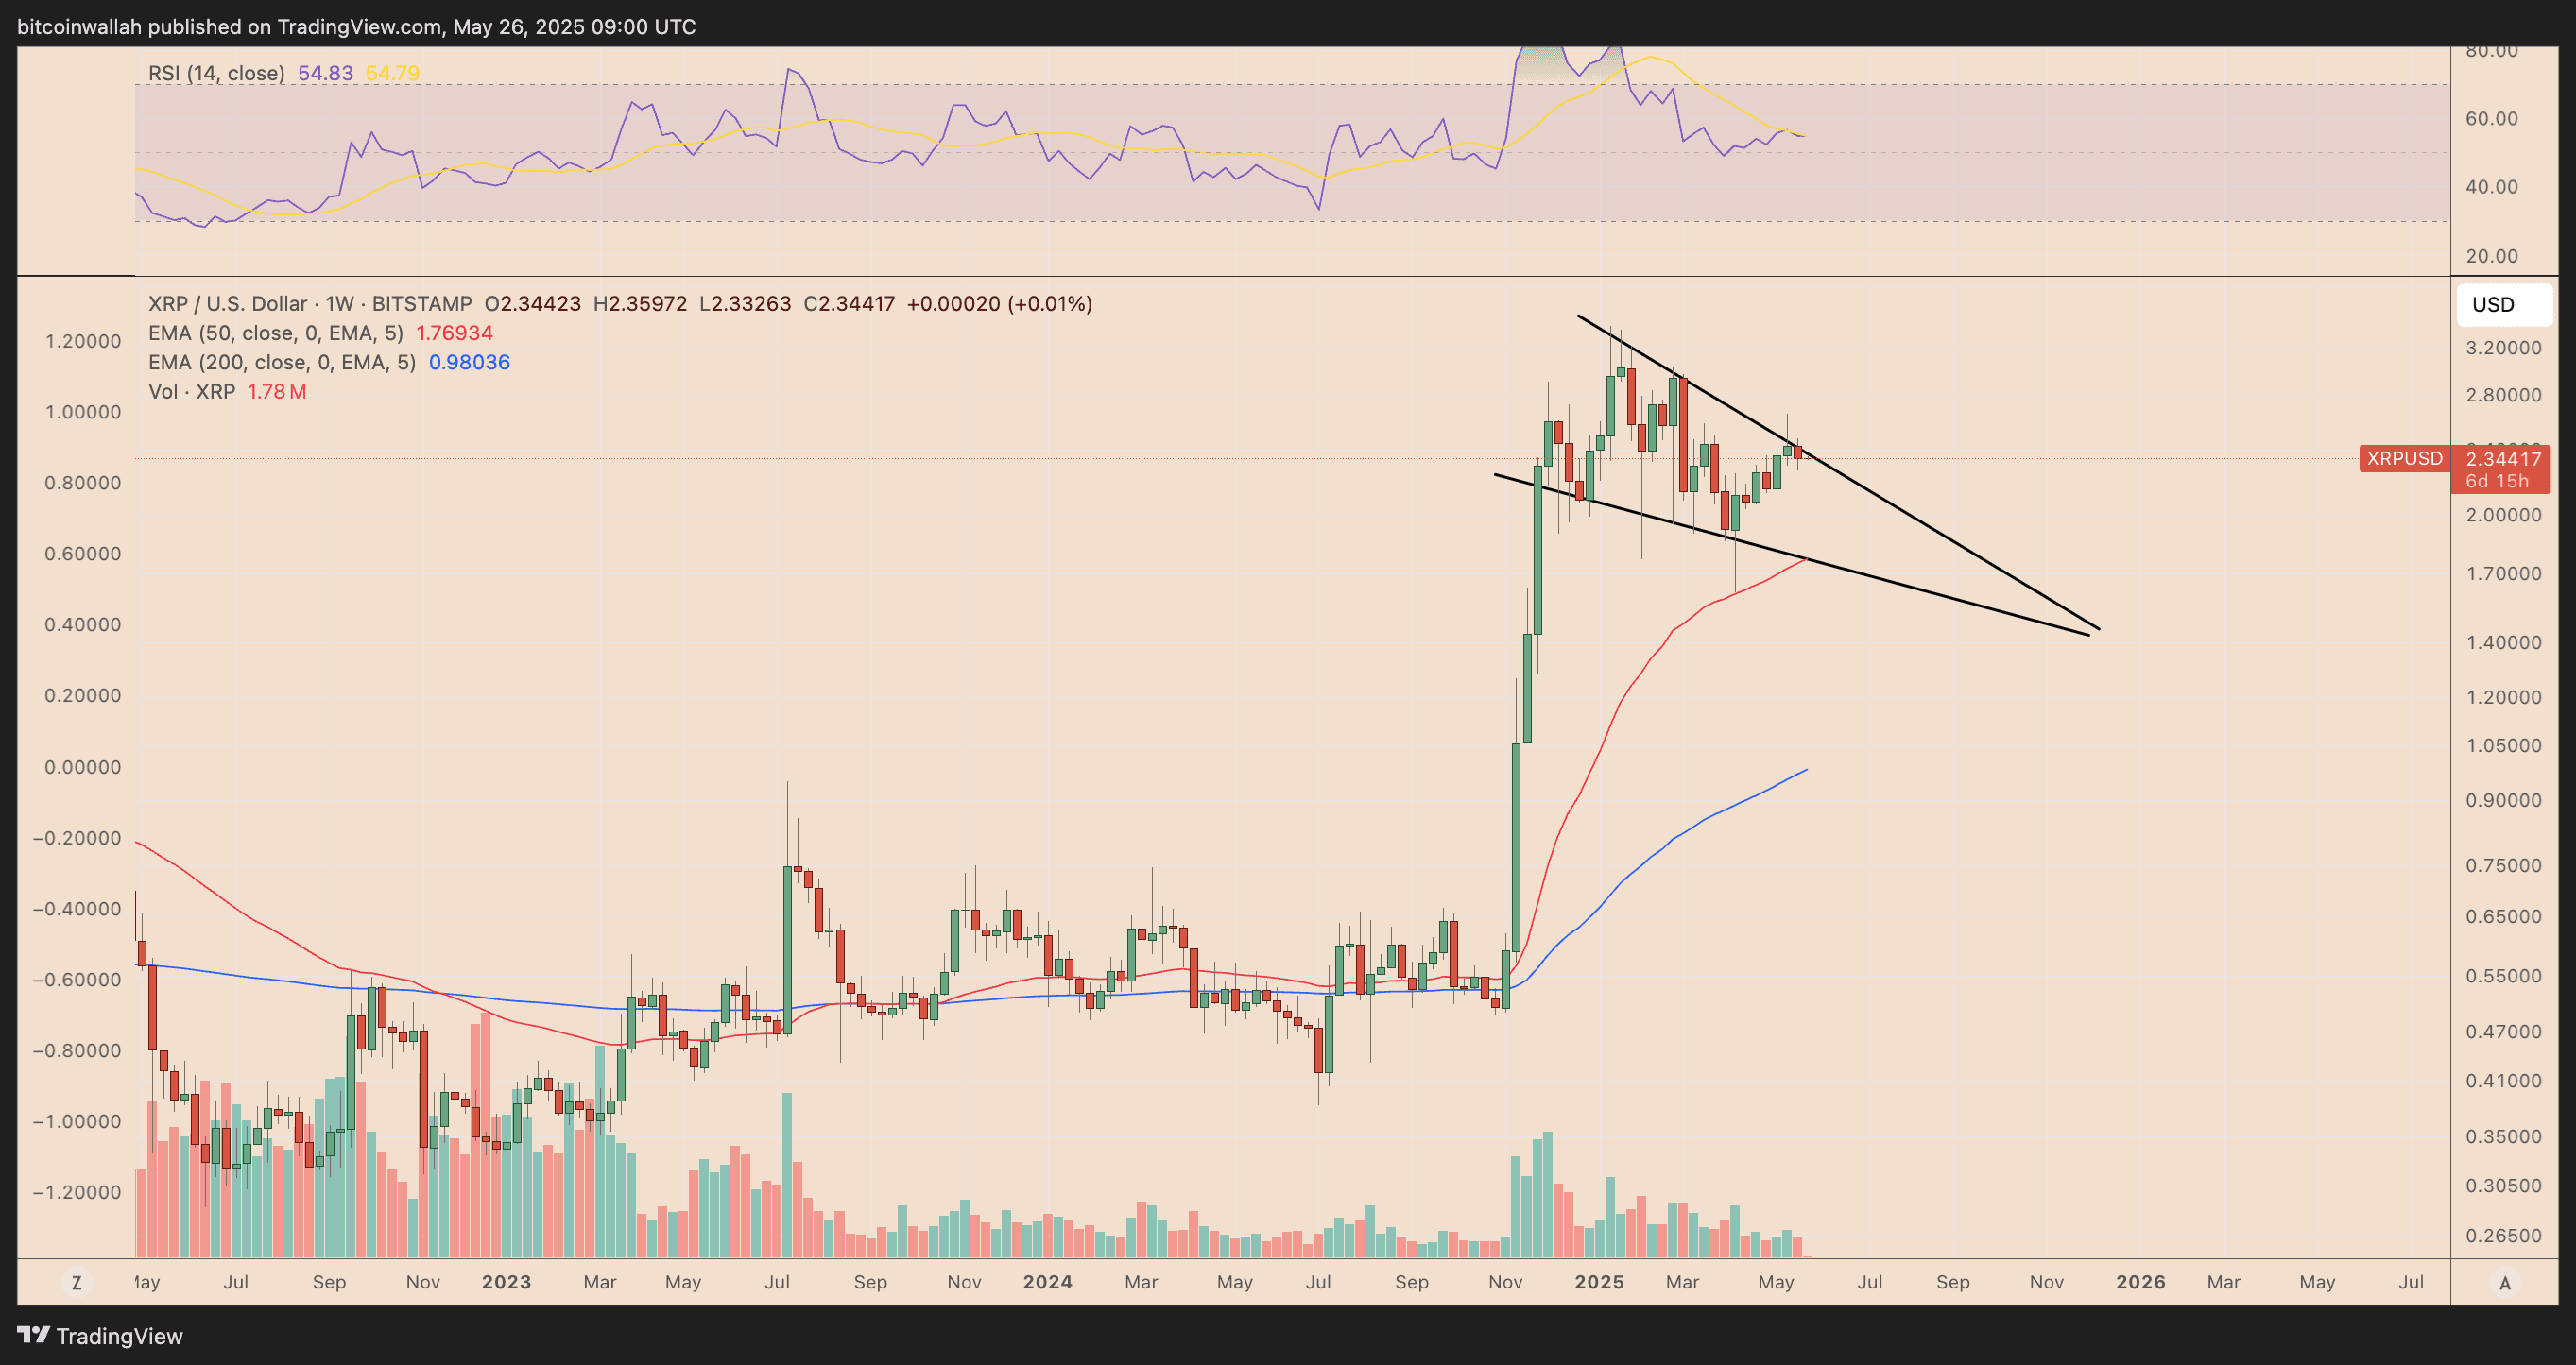
If this pattern holds, a pullback could drive the XRP price towards the wedge’s lower trendline, aligning with the 50-week exponential moving average (EMA) around $1.76. This represents a potential 25% decrease from current levels.
Potential Price Target:
- The falling wedge pattern suggests a possible drop to $1.76, representing a 25% correction.
Factors Influencing XRP’s Price
Several factors can impact XRP’s price beyond technical and on-chain analysis. These include:
- Regulatory developments: Ongoing legal battles and regulatory clarity can significantly influence investor sentiment.
- Adoption by institutions: Widespread adoption by financial institutions and payment processors could drive demand.
- Overall market sentiment: Broader cryptocurrency market trends and risk appetite can affect XRP’s price.
Conclusion
While XRP has enjoyed a substantial rally, multiple factors indicate a potential market top. Declining network activity, concerning on-chain metrics, and bearish technical patterns suggest a possible price correction. Investors should exercise caution and conduct thorough research before making investment decisions.
Disclaimer: This analysis is for informational purposes only and should not be considered investment advice. The cryptocurrency market is volatile, and prices can fluctuate significantly.