XRP has experienced a notable price surge recently, raising the question: will this rally continue, or is a price correction on the horizon? This analysis delves into the technical factors influencing XRP’s price, examining both bullish and bearish signals to provide a comprehensive outlook.
Key Takeaways:
- Correction Risk: XRP is trading significantly above its realized price, historically indicating a heightened risk of correction.
- Short-Term Bearish Signal: A rising wedge pattern on the 4-hour chart suggests a potential breakdown, targeting a price of $1.89 by mid-May.
- Long-Term Bullish Potential: A weekly falling wedge pattern and strong support at the 50-week EMA point to a possible recovery towards $2.92 by June.
Let’s break down these factors further:
Rising Wedge Pattern: A Warning Sign
XRP’s 4-hour chart is displaying a rising wedge pattern, a formation often associated with bearish reversals. As the price rises, the upward sloping trendlines converge, signaling weakening bullish momentum.
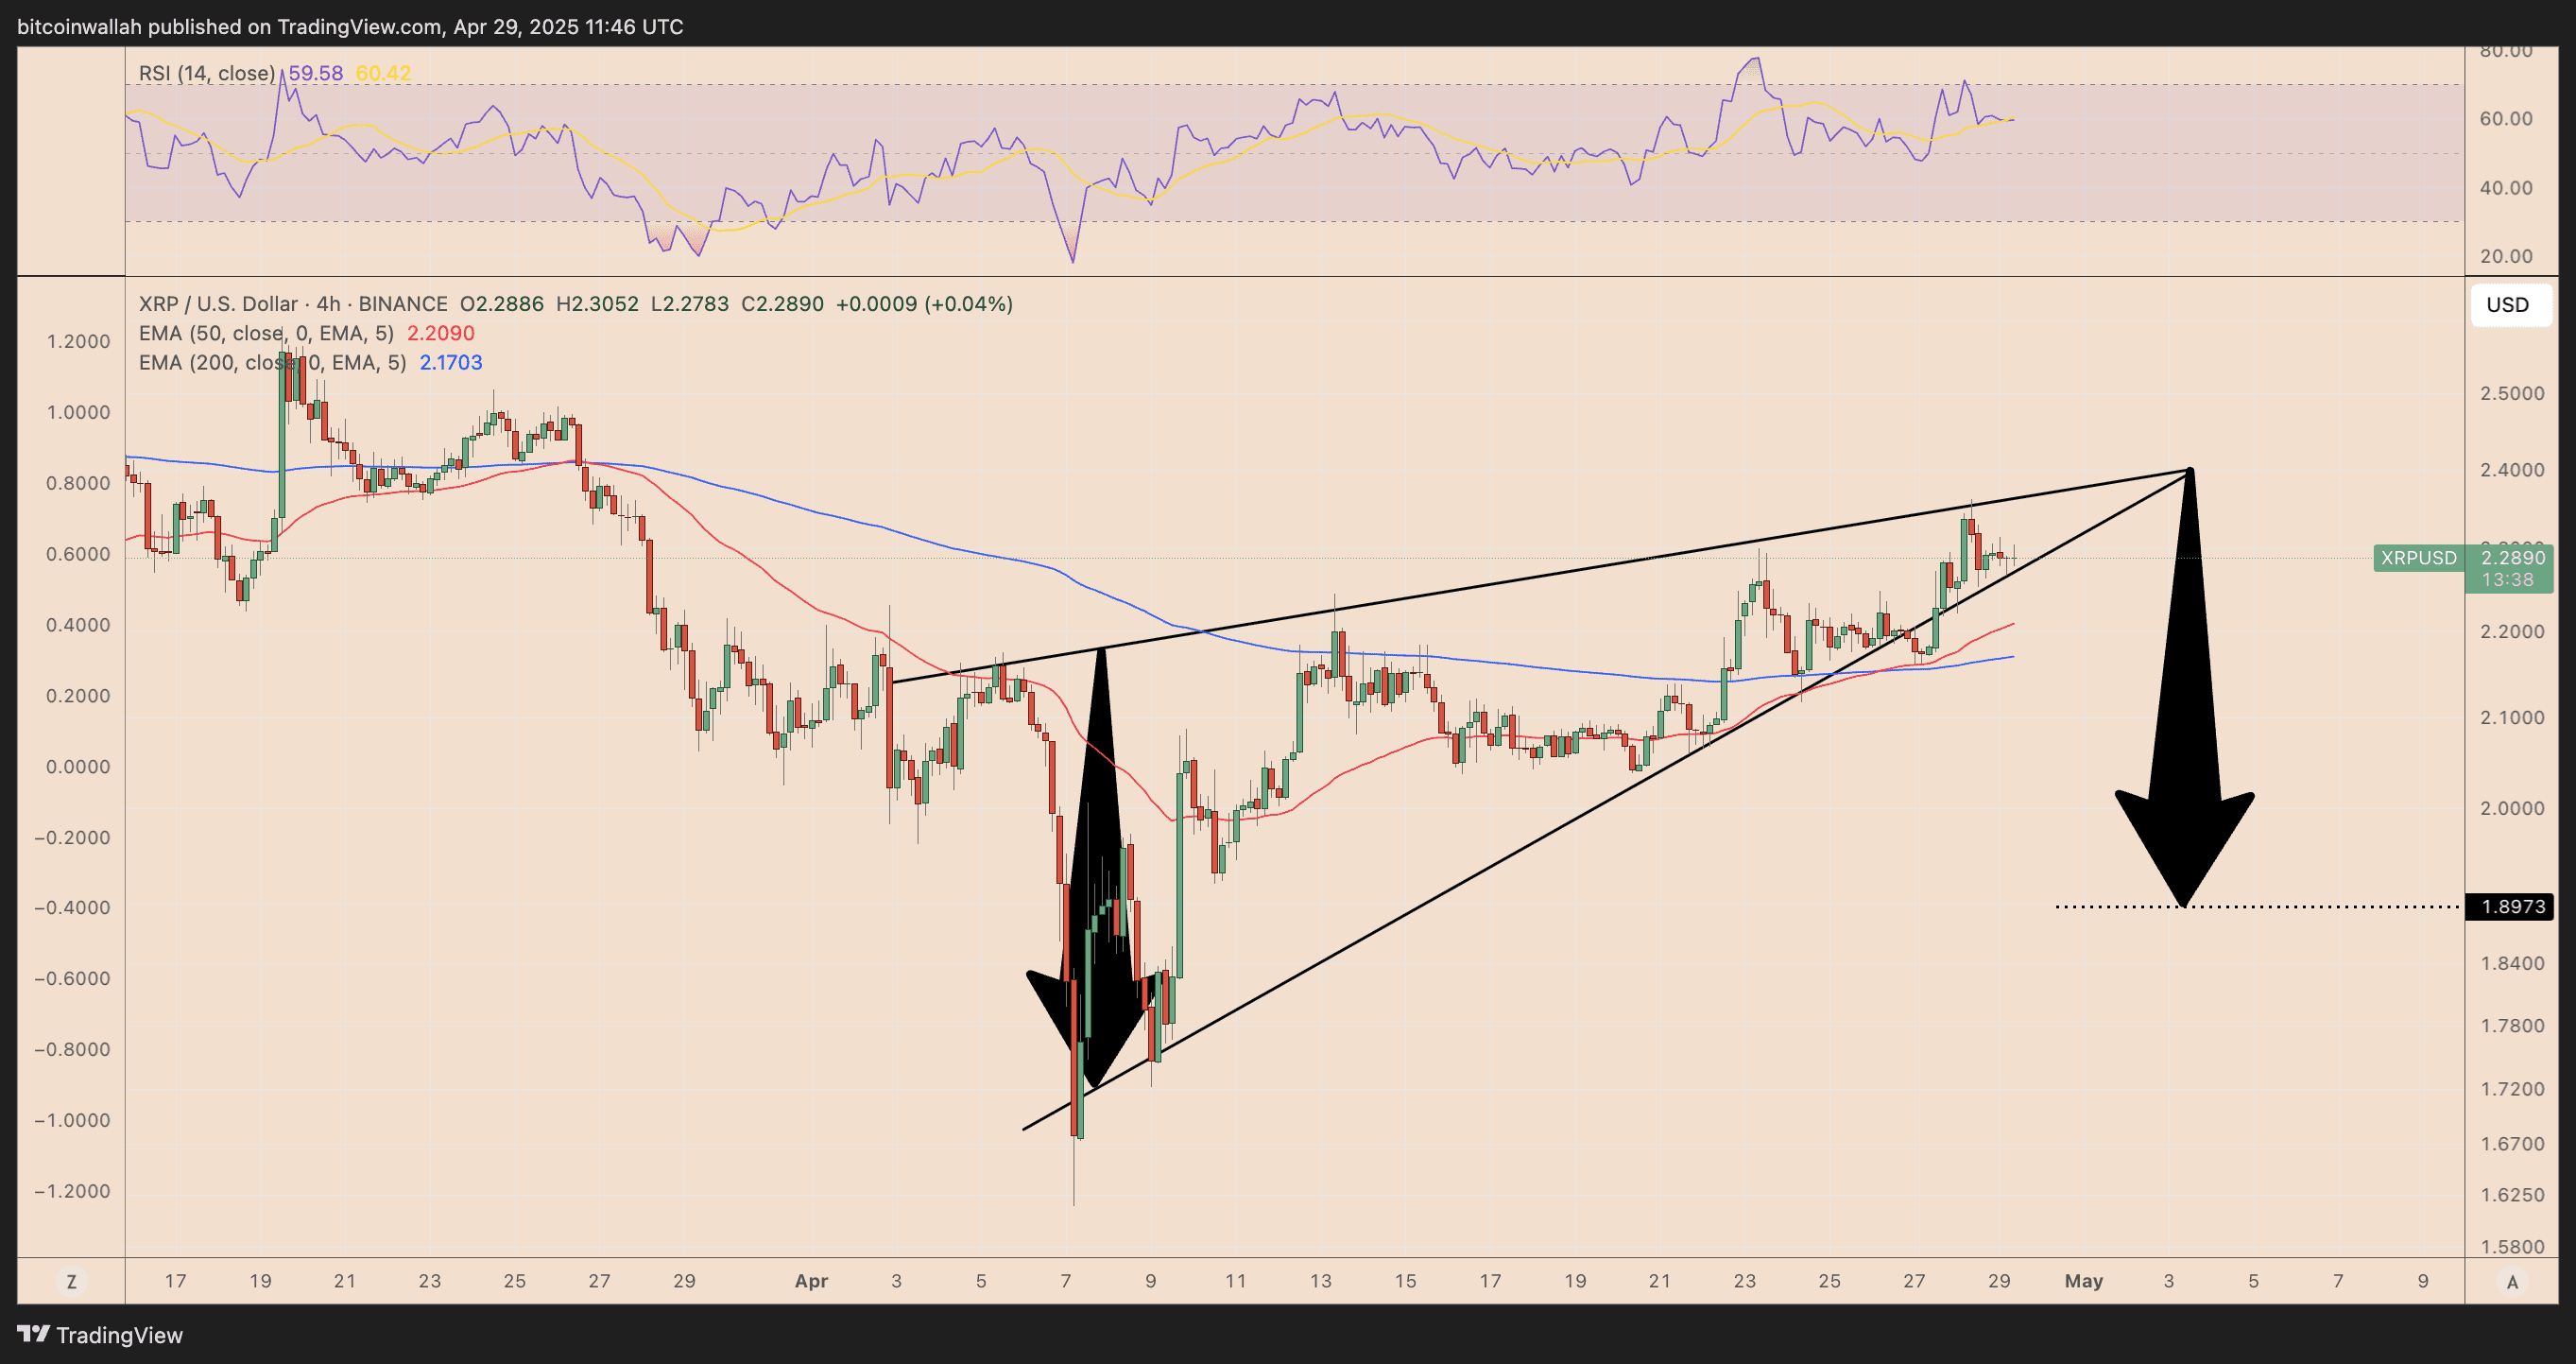
Potential Downside Target: If XRP breaks below the lower support of the rising wedge, the price could decline to around $1.89, representing a potential 17% drop. This scenario is further supported by the Relative Strength Index (RSI), which is nearing overbought levels, potentially triggering profit-taking.
Realized Price: A Historical Perspective
XRP’s realized price, currently around $1.02, represents the average cost basis of all circulating XRP tokens. This metric serves as a gauge of market sentiment, highlighting periods of overvaluation or undervaluation.
Overvaluation Concerns: XRP is currently trading over 120% above its realized price. Historically, such significant divergences have preceded sharp price corrections. In 2018 and 2021, similar gaps between the spot price and realized price led to substantial pullbacks.
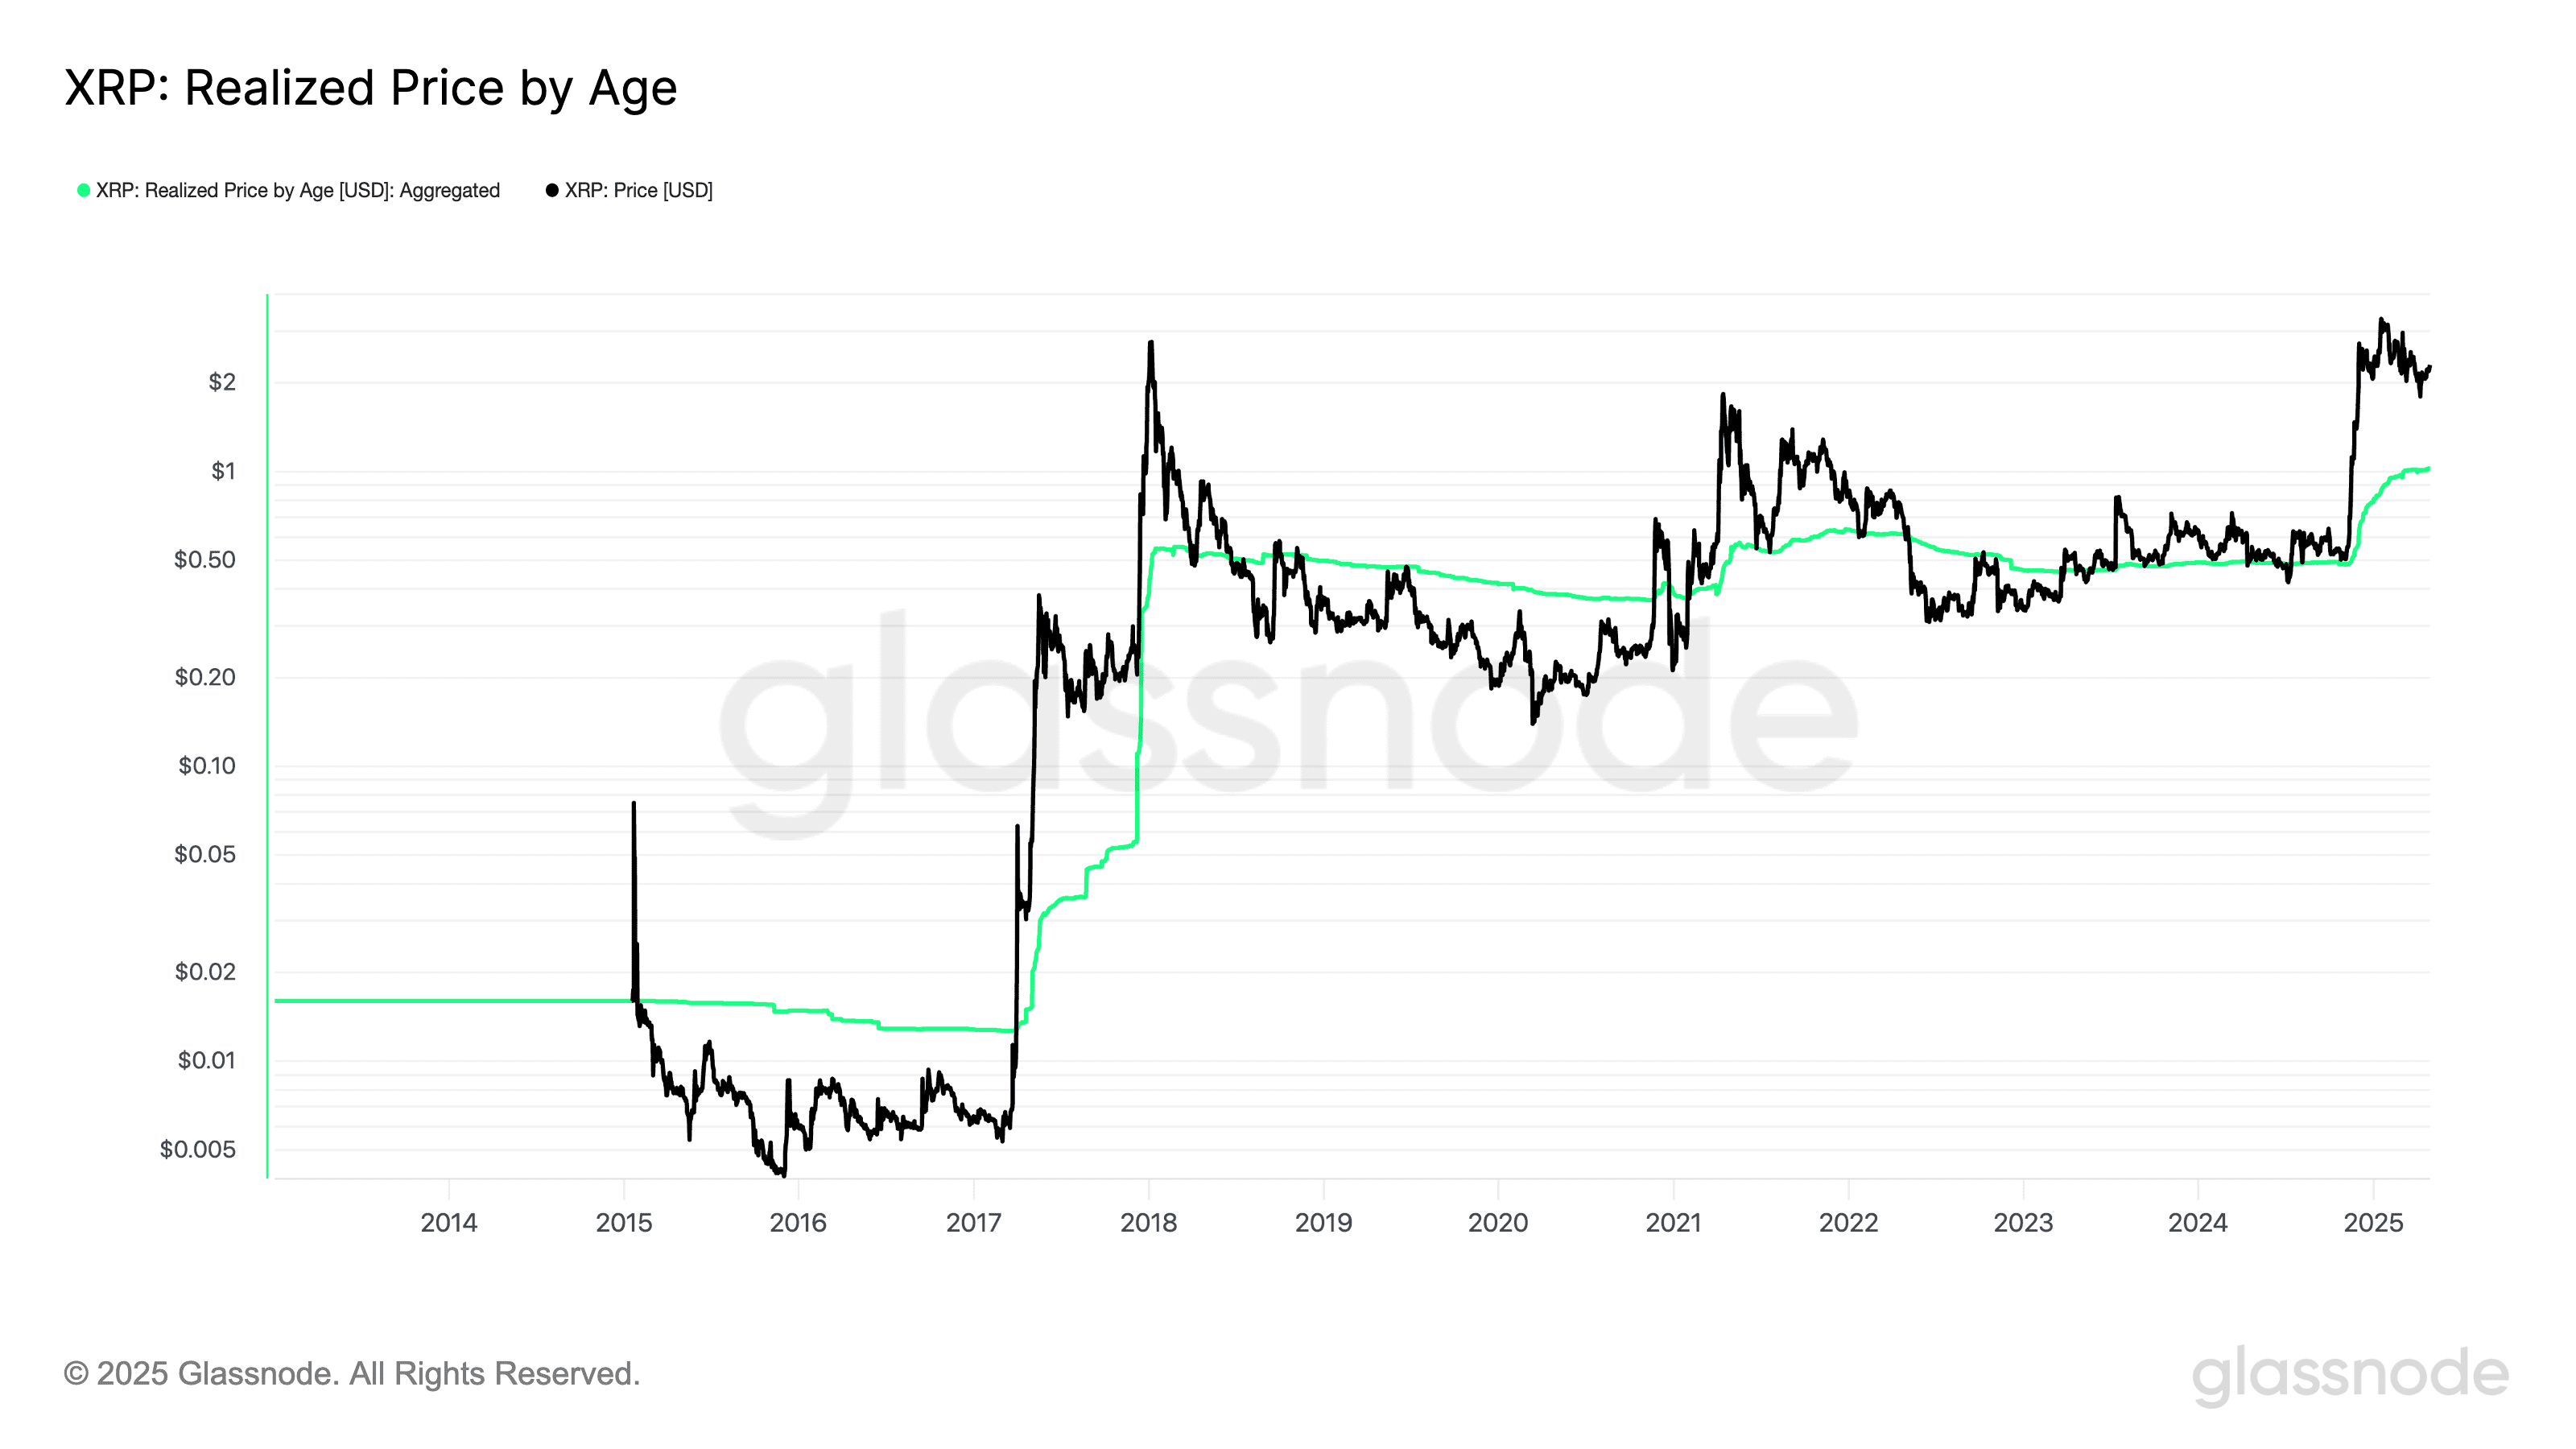
Potential Retracement: If bearish momentum increases, XRP could retrace towards its realized price of $1.02, a decline of over 50% from current levels. This would represent a significant correction to align with the average cost basis of XRP holders.
Falling Wedge Pattern: A Glimmer of Hope for Bulls
Despite the bearish signals, XRP’s weekly chart reveals a falling wedge pattern, a formation that often precedes bullish breakouts. This pattern, combined with strong support at the 50-week Exponential Moving Average (EMA) around $1.67, suggests potential for a recovery.
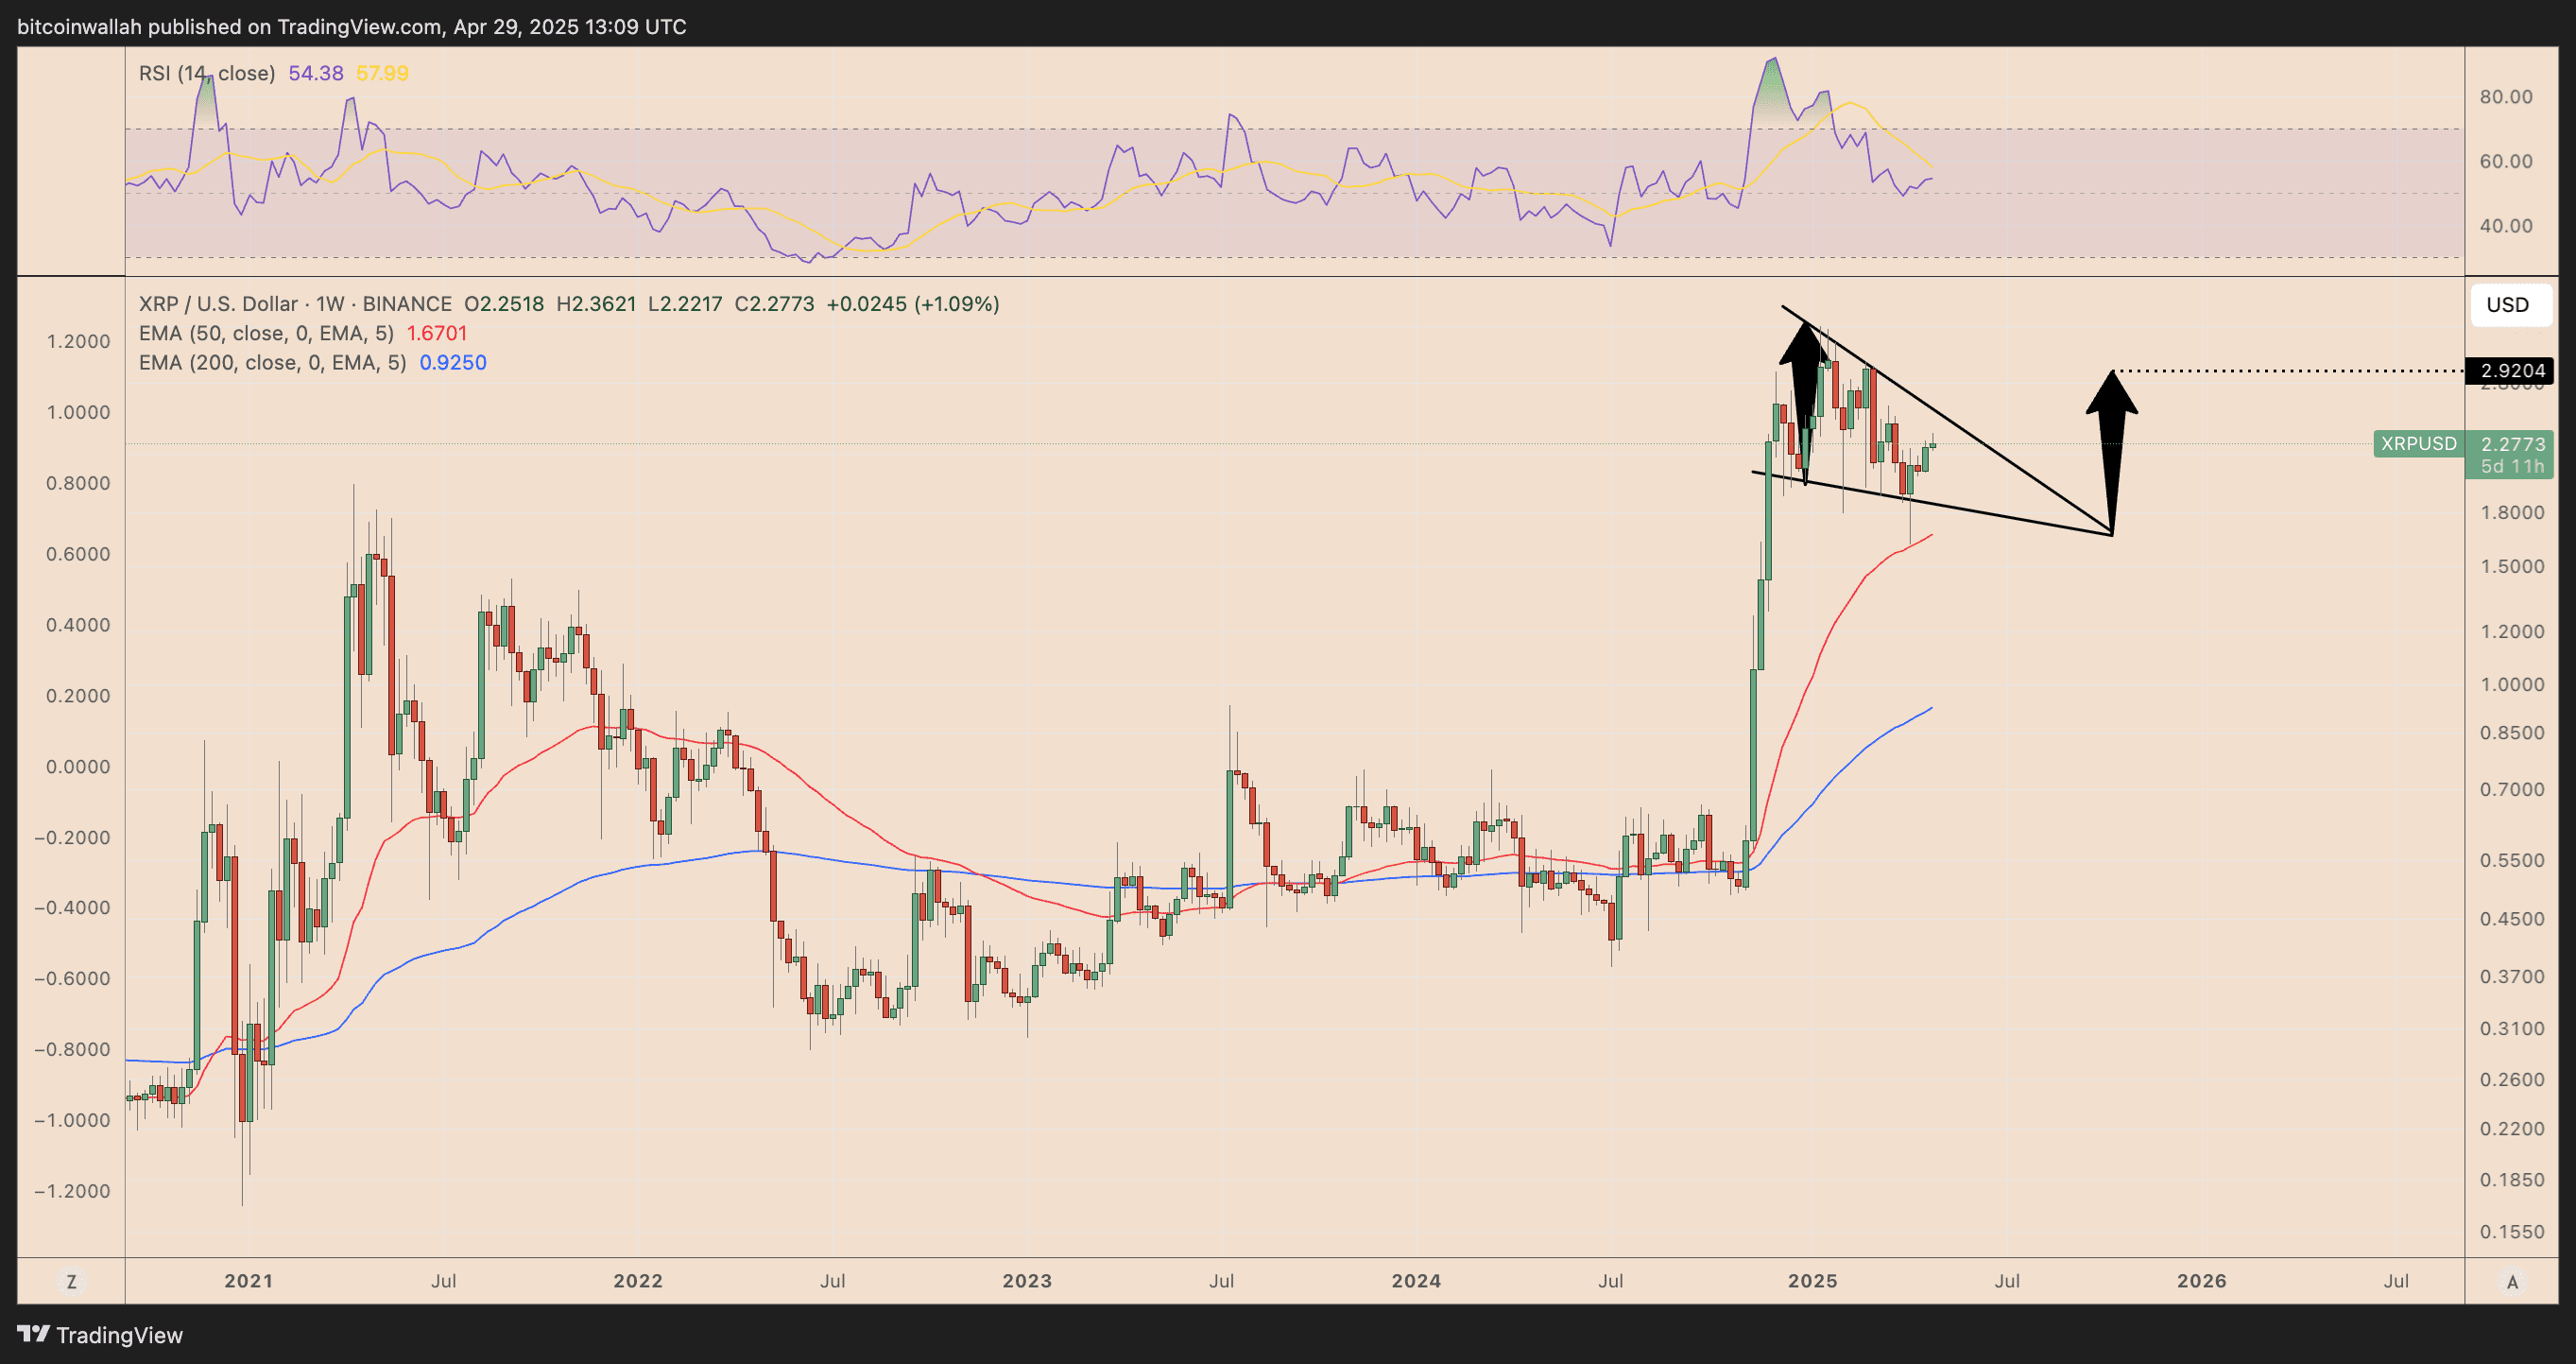
Potential Upside Target: A successful breakout from the falling wedge could propel XRP towards $2.92 by June, marking a potential 25% rally. The RSI bouncing from the midline further supports this bullish outlook, indicating a possible resurgence of buying pressure.
Conclusion: A Mixed Bag of Signals
XRP’s current price action presents a mixed bag of signals. While short-term technical indicators suggest a potential correction, long-term patterns and key support levels offer hope for a bullish recovery. Investors and traders should carefully monitor these factors to make informed decisions.
Factors to Watch:
- Rising Wedge Breakdown: Confirmation of a breakdown below the rising wedge support will signal a likely correction.
- Realized Price Convergence: Increased selling pressure could drive XRP towards its realized price of $1.02.
- Falling Wedge Breakout: A breakout above the falling wedge resistance could trigger a significant rally towards $2.92.
- 50-week EMA Support: Continued support at the 50-week EMA will be crucial for maintaining bullish momentum.